
.jpg&w=3840&q=100)
Market
Insights
Reports delivered globally, covering a wide range of industries and sectors.
Clients who trust our expertise and rely on our insights for business decisions.
Managed Reports, ensuring seamless updates and premium service.
Satisfied Customers, committed to delivering exceptional value and quality.
Asia Pacific Capacitor Bank Market Future-proof Strategies: Trends, Competitor Dynamics, and Opportunities 2025-2033
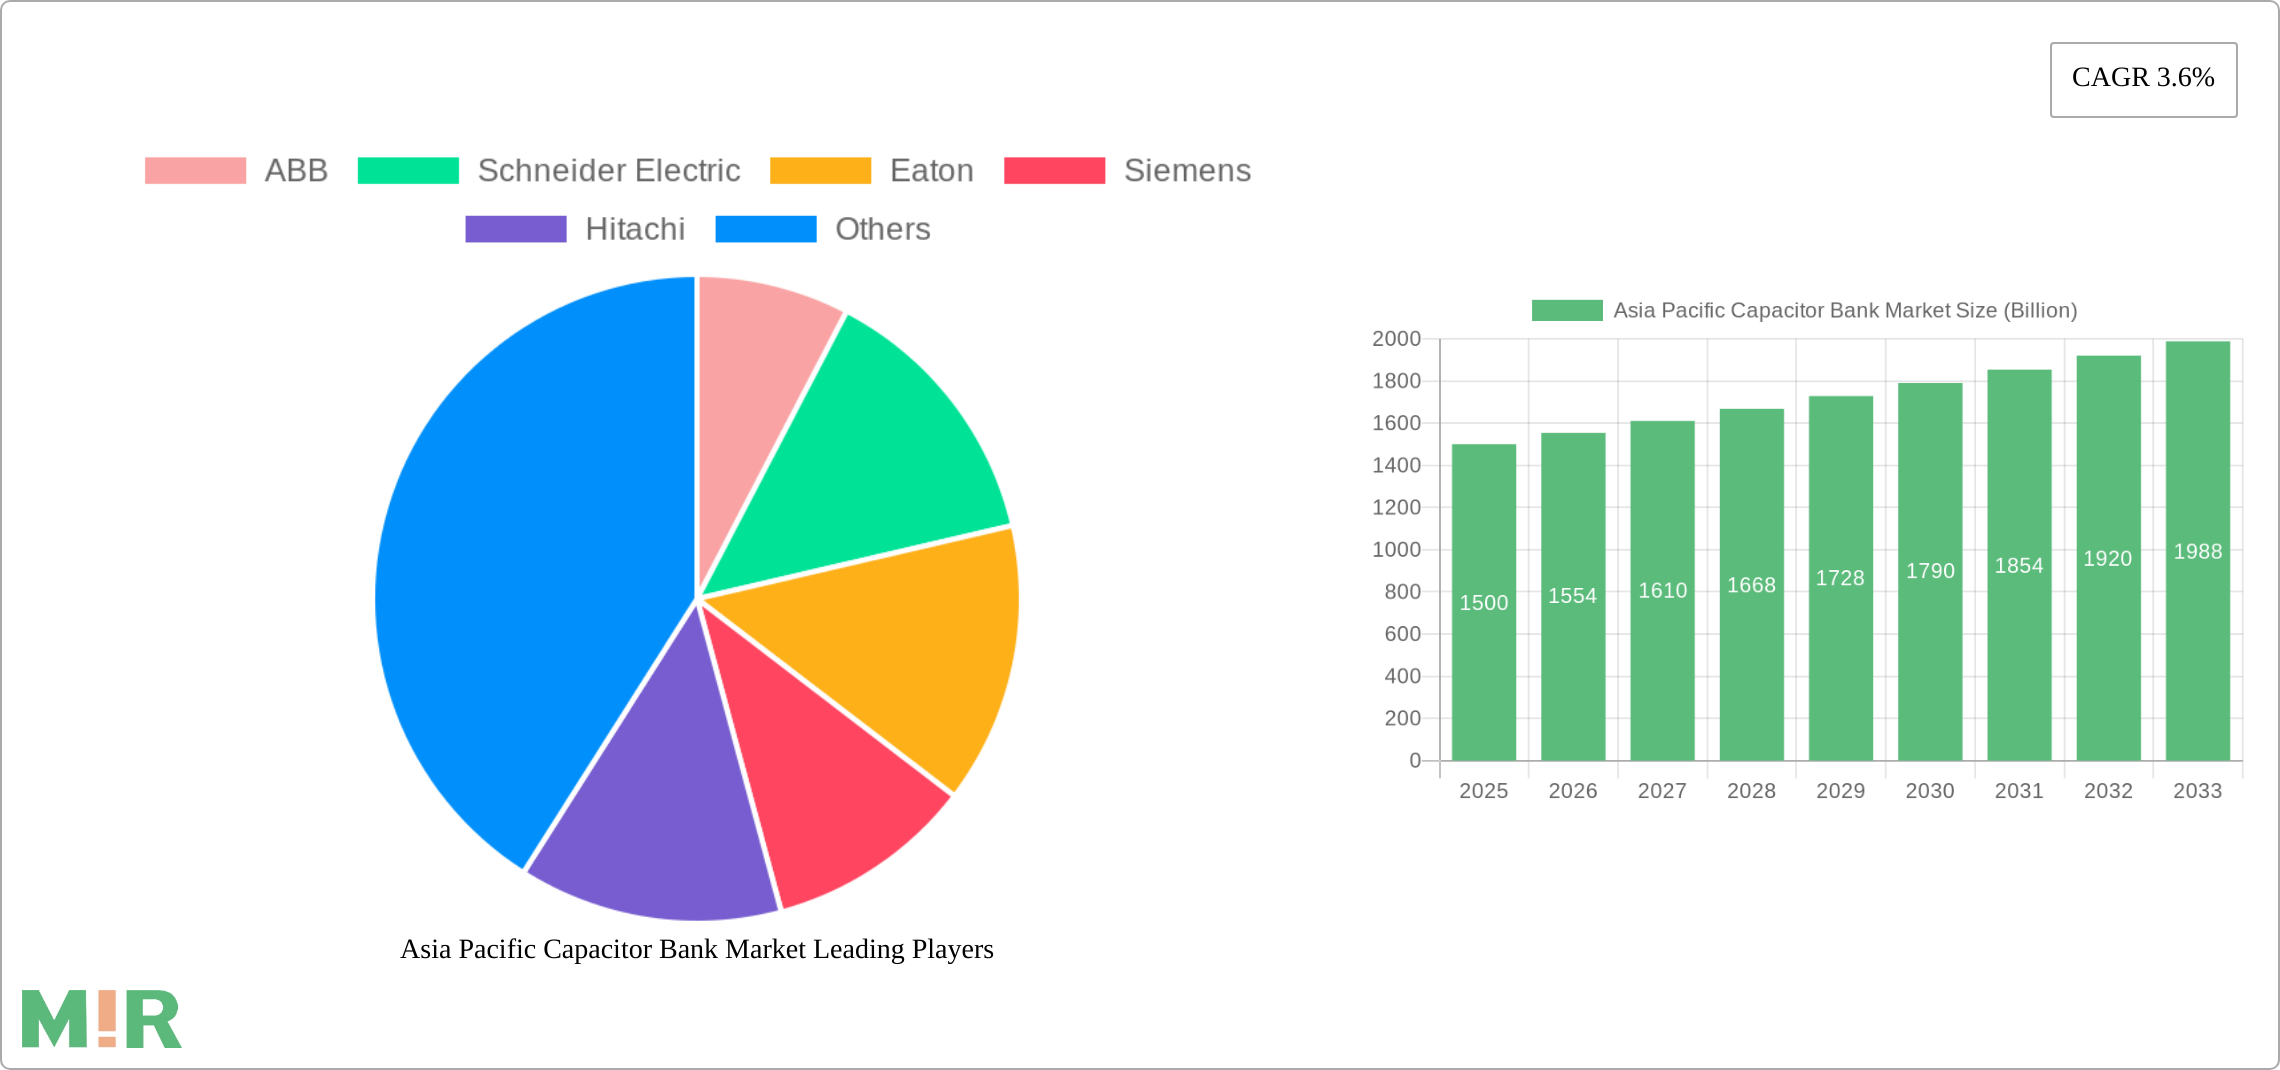
Asia Pacific Capacitor Bank Market by Major players in the capacitor bank market employ a range of strategies to both retain and extend their market share. These strategies are typically influenced by factors such as competitive dynamics, technological progress, shifts in regulations, and evolving customer needs. The participants operating across the market include: (ABB, Schneider Electric, Eaton, Siemens, Hitachi, Legrand, Arteche, Unistar, Lifasa, Genteq, Circutor, Vishay, RTR Energia, YUHCHANG ELECTRIC CO. LTD., Samwha, DUCATI Energia Spa), by Voltage (Low [<10 kV], Medium [10 kV – 69 kV], High [>69 kV]), by Type (Open Air Substation, Metal Enclosed Substation, Pole Mounted, Others), by Application (Power Factor Correction, Harmonic filter, Voltage Regulation, Renewable Integration, Industrial Application, Data Centers, Others), by Asia Pacific (China, India, Japan, Australia, South Korea, Indonesia, Malaysia, Singapore, Thailand, Vietnam, Philippines, Sri Lanka) Forecast 2025-2033
Asia Pacific Capacitor Bank Market Future-proof Strategies: Trends, Competitor Dynamics, and Opportunities 2025-2033
Key Insights
The Asia Pacific capacitor bank market, currently valued at $1.5 billion (2025), is projected to experience robust growth, driven by the region's burgeoning renewable energy sector, rapid industrialization, and increasing demand for reliable power infrastructure. A compound annual growth rate (CAGR) of 3.6% from 2025 to 2033 indicates a steady expansion, with significant contributions expected from key countries like China, India, and Japan. Growth is fueled by the rising adoption of power factor correction solutions in industrial applications and data centers, alongside the integration of renewable energy sources like solar and wind power, which require capacitor banks for voltage stabilization and harmonic filtering. Furthermore, the increasing focus on grid modernization and energy efficiency initiatives across the Asia Pacific region is expected to further propel market demand. While challenges such as fluctuating raw material prices and potential supply chain disruptions could act as restraints, the long-term outlook remains positive, with opportunities for market players to capitalize on the growing demand for advanced capacitor bank technologies, including those with improved energy efficiency and longer lifespans. The presence of major international players like ABB, Schneider Electric, and Siemens, alongside local manufacturers, ensures a competitive landscape fostering innovation and market penetration.
The competitive landscape in the Asia Pacific capacitor bank market is characterized by both established multinational corporations and regional players. These companies employ various strategies including mergers and acquisitions, product diversification, and strategic partnerships to gain a competitive edge. Technological advancements, such as the development of more efficient and compact capacitor banks, are crucial for maintaining market share. The market is segmented by voltage (low voltage, predominantly 69 kV and below), type (open air substation, metal enclosed substation, pole-mounted, and others), and application (power factor correction, harmonic filtering, voltage regulation, renewable integration, industrial applications, data centers, and others). The diversity in applications underscores the versatility and crucial role capacitor banks play in modern power systems, furthering the market's growth trajectory within the Asia Pacific region. Specific regional growth within Asia Pacific will likely be heavily influenced by government policies related to renewable energy integration and industrial development in individual countries.
Asia Pacific Capacitor Bank Market Concentration & Characteristics
The Asia Pacific capacitor bank market is moderately concentrated, with a few major multinational players like ABB, Siemens, and Hitachi holding significant market share. However, several regional players and specialized manufacturers also contribute substantially. Innovation in the sector is driven by the need for improved energy efficiency, grid stability, and the integration of renewable energy sources. This leads to advancements in capacitor bank technology, such as the development of more efficient dielectric materials and advanced control systems.
- Concentration Areas: China, India, and Japan represent the largest market segments due to their substantial energy consumption and ongoing infrastructure development.
- Characteristics of Innovation: Focus is on higher energy density capacitors, smarter control systems with predictive maintenance capabilities, and integration with smart grids.
- Impact of Regulations: Stringent environmental regulations and energy efficiency standards are pushing adoption of advanced, more efficient capacitor banks.
- Product Substitutes: While direct substitutes are limited, alternative power quality solutions like dynamic voltage restorers (DVRs) and unified power flow controllers (UPFCs) offer some competition in niche applications.
- End User Concentration: The market is largely driven by the power generation & transmission utilities, followed by industrial users and data centers.
- Level of M&A: The market has witnessed a moderate level of mergers and acquisitions (M&A) activity, primarily focused on enhancing technological capabilities and geographical reach. Consolidation is expected to continue, albeit at a measured pace.
Asia Pacific Capacitor Bank Market Trends
The Asia Pacific capacitor bank market is experiencing robust growth, fueled by several key trends. The increasing demand for electricity, coupled with the expansion of renewable energy sources and the growing adoption of smart grid technologies, is significantly driving the market. Furthermore, stringent government regulations aimed at improving power quality and energy efficiency are further bolstering market expansion. The increasing adoption of electric vehicles and the growth of data centers are also contributing to increased demand for capacitor banks to mitigate power fluctuations and ensure stable operation. Technological advancements in capacitor materials and control systems are leading to the introduction of more efficient and reliable products, enhancing the overall market appeal. The market is also witnessing a shift towards higher voltage capacitor banks to cater to the needs of large-scale industrial and utility applications. Finally, the focus on reducing carbon emissions is promoting the use of energy-efficient capacitor banks that minimize energy losses and improve overall system efficiency. This trend is being further bolstered by government initiatives promoting renewable energy integration and environmental sustainability. The increasing adoption of advanced energy storage solutions is also influencing capacitor bank technology, leading to innovations that improve energy storage capacity and operational efficiency. This is further enhanced by the development of more robust and reliable capacitor banks, capable of withstanding harsh operating conditions.
The overall market outlook remains positive, with continued growth expected in the coming years. This growth will be driven by the factors mentioned above, alongside the growing awareness of the importance of power quality and energy efficiency among consumers and businesses. The continued investment in infrastructure development and the expansion of renewable energy projects across the Asia-Pacific region will also play a crucial role in shaping the future of the capacitor bank market. Companies are investing heavily in research and development to develop advanced capacitor bank technologies that offer greater efficiency, reliability, and sustainability.

Key Region or Country & Segment to Dominate the Market
Dominant Regions: China and India are expected to dominate the market due to their rapidly growing economies, extensive infrastructure projects, and increasing energy demand. Japan also holds a significant position owing to its technologically advanced power grid and strong industrial base.
Dominant Segments:
- Voltage: Medium-voltage capacitor banks (69 kV and above) are expected to witness higher growth due to the rising demand from large-scale industrial and utility applications.
- Type: Metal-enclosed substations are gaining traction due to their enhanced safety and environmental protection features. However, open-air substations remain dominant in certain applications due to cost considerations.
- Application: Power factor correction continues to be the largest application segment, driven by the need to improve energy efficiency and reduce electricity costs. However, growth in renewable energy integration and data centers is boosting demand for capacitor banks in these sectors.
The robust growth in these segments is primarily driven by government policies promoting energy efficiency, the expansion of industrial infrastructure, and the increasing adoption of renewable energy sources.
Asia Pacific Capacitor Bank Market Product Insights Report Coverage & Deliverables
This report provides comprehensive insights into the Asia Pacific capacitor bank market, covering market size, growth forecasts, key players, competitive landscape, and emerging trends. The report analyzes the market across various segments including voltage levels, installation types, applications, and geographic regions. It includes detailed profiles of leading market participants, their strategies, and their market shares. Furthermore, the report provides in-depth analysis of the factors driving market growth, as well as the challenges and restraints facing the industry. Finally, it offers strategic recommendations for stakeholders to leverage the opportunities presented by this dynamic market.
Asia Pacific Capacitor Bank Market Analysis
The Asia Pacific capacitor bank market is projected to reach a value of $X billion by 2028, registering a CAGR of Y% during the forecast period (2023-2028). The market size is primarily driven by the growing demand for improved power quality and energy efficiency across various sectors, including industrial, commercial, and residential. The market share is largely divided among a few major players, with ABB, Siemens, and Hitachi being among the leading contributors. However, several regional and specialized manufacturers are also gaining significant market share through focused product offerings and strategic partnerships. The market is expected to witness substantial growth, driven by increasing investments in renewable energy integration, infrastructure development, and the expansion of smart grids across the region. Furthermore, the growing adoption of data centers and electric vehicles is further contributing to the rise in demand for capacitor banks.
Asia Pacific Capacitor Bank Market Regional Insights
- Asia Pacific
- China
- India
- Japan
- Australia
- South Korea
- Indonesia
- Malaysia
- Singapore
- Thailand
- Vietnam
- Philippines
- Sri Lanka
Each country's market is further segmented by voltage, type, and application, providing granular insights into the regional dynamics. China and India are expected to dominate, followed by Japan and South Korea. However, other Southeast Asian countries are also witnessing significant growth driven by industrialization and infrastructure development.
Driving Forces: What's Propelling the Asia Pacific Capacitor Bank Market
- Rising energy demand and infrastructure development across the region.
- Increased adoption of renewable energy sources.
- Stringent government regulations promoting energy efficiency and power quality.
- Growing demand from industrial sectors and data centers.
- Advancements in capacitor bank technologies leading to improved efficiency and reliability.
Challenges and Restraints in Asia Pacific Capacitor Bank Market
- High initial investment costs associated with capacitor bank installation.
- Potential safety concerns related to high-voltage systems.
- Limited awareness about the benefits of capacitor banks among certain end-users.
- Competition from alternative power quality solutions.
- Fluctuations in raw material prices.
Emerging Trends in Asia Pacific Capacitor Bank Market
- Increasing adoption of smart capacitor banks with advanced control and monitoring systems.
- Growing demand for energy storage solutions integrated with capacitor banks.
- Focus on developing environmentally friendly and sustainable capacitor bank technologies.
- Expansion of capacitor banks in emerging applications such as electric vehicle charging infrastructure.
- Increased collaboration between manufacturers and end-users to optimize capacitor bank applications.
Asia Pacific Capacitor Bank Industry News
- August 2023: Hitachi announced an expansion of their Bengaluru facility to double production capacity for advanced capacitor units, banks, and power electronic compensators.
Leading Players in the Asia Pacific Capacitor Bank Market
- ABB
- Schneider Electric
- Eaton
- Siemens
- Hitachi
- Legrand
- Arteche
- Unistar
- Lifasa
- Genteq
- Circutor
- Vishay
- RTR Energia
- YUHCHANG ELECTRIC CO. LTD.
- Samwha
- DUCATI Energia Spa
(Note: Market size and CAGR values (X and Y) are estimations based on industry knowledge and are not precise figures.)
Asia Pacific Capacitor Bank Market Segmentation
-
1. Major players in the capacitor bank market employ a range of strategies to both retain and extend their market share. These strategies are typically influenced by factors such as competitive dynamics, technological progress, shifts in regulations, and evolving customer needs. The participants operating across the market include:
- 1.1. ABB
- 1.2. Schneider Electric
- 1.3. Eaton
- 1.4. Siemens
- 1.5. Hitachi
- 1.6. Legrand
- 1.7. Arteche
- 1.8. Unistar
- 1.9. Lifasa
- 1.10. Genteq
- 1.11. Circutor
- 1.12. Vishay
- 1.13. RTR Energia
- 1.14. YUHCHANG ELECTRIC CO. LTD.
- 1.15. Samwha
- 1.16. DUCATI Energia Spa
-
2. Voltage
- 2.1. Low [<10 kV]
- 2.2. Medium [10 kV – 69 kV]
- 2.3. High [>69 kV]
-
3. Type
- 3.1. Open Air Substation
- 3.2. Metal Enclosed Substation
- 3.3. Pole Mounted
- 3.4. Others
-
4. Application
- 4.1. Power Factor Correction
- 4.2. Harmonic filter
- 4.3. Voltage Regulation
- 4.4. Renewable Integration
- 4.5. Industrial Application
- 4.6. Data Centers
- 4.7. Others
Asia Pacific Capacitor Bank Market Segmentation By Geography
-
1. Asia Pacific
- 1.1. China
- 1.2. India
- 1.3. Japan
- 1.4. Australia
- 1.5. South Korea
- 1.6. Indonesia
- 1.7. Malaysia
- 1.8. Singapore
- 1.9. Thailand
- 1.10. Vietnam
- 1.11. Philippines
- 1.12. Sri Lanka

Asia Pacific Capacitor Bank Market REPORT HIGHLIGHTS
| Aspects | Details |
|---|---|
| Study Period | 2019-2033 |
| Base Year | 2024 |
| Estimated Year | 2025 |
| Forecast Period | 2025-2033 |
| Historical Period | 2019-2024 |
| Growth Rate | CAGR of 3.6% from 2019-2033 |
| Segmentation |
|
- 1. Introduction
- 1.1. Research Scope
- 1.2. Market Segmentation
- 1.3. Research Methodology
- 1.4. Definitions and Assumptions
- 2. Executive Summary
- 2.1. Introduction
- 3. Market Dynamics
- 3.1. Introduction
- 3.2. Market Drivers
- 3.2.1 Ongoing refurbishment of existing electricity networks
- 3.2.2 Increasing peak load demand & security of supply concerns
- 3.2.3 Large scale integration of clean energy sources
- 3.2.4 Robust expansion of smart grid networks
- 3.3. Market Restrains
- 3.3.1. Slow paced technological evolution
- 3.4. Market Trends
- 4. Market Factor Analysis
- 4.1. Porters Five Forces
- 4.2. Supply/Value Chain
- 4.3. PESTEL analysis
- 4.4. Market Entropy
- 4.5. Patent/Trademark Analysis
- 5. Asia Pacific Capacitor Bank Market Analysis, Insights and Forecast, 2019-2031
- 5.1. Market Analysis, Insights and Forecast - by Major players in the capacitor bank market employ a range of strategies to both retain and extend their market share. These strategies are typically influenced by factors such as competitive dynamics, technological progress, shifts in regulations, and evolving customer needs. The participants operating across the market include:
- 5.1.1. ABB
- 5.1.2. Schneider Electric
- 5.1.3. Eaton
- 5.1.4. Siemens
- 5.1.5. Hitachi
- 5.1.6. Legrand
- 5.1.7. Arteche
- 5.1.8. Unistar
- 5.1.9. Lifasa
- 5.1.10. Genteq
- 5.1.11. Circutor
- 5.1.12. Vishay
- 5.1.13. RTR Energia
- 5.1.14. YUHCHANG ELECTRIC CO. LTD.
- 5.1.15. Samwha
- 5.1.16. DUCATI Energia Spa
- 5.2. Market Analysis, Insights and Forecast - by Voltage
- 5.2.1. Low [<10 kV]
- 5.2.2. Medium [10 kV – 69 kV]
- 5.2.3. High [>69 kV]
- 5.3. Market Analysis, Insights and Forecast - by Type
- 5.3.1. Open Air Substation
- 5.3.2. Metal Enclosed Substation
- 5.3.3. Pole Mounted
- 5.3.4. Others
- 5.4. Market Analysis, Insights and Forecast - by Application
- 5.4.1. Power Factor Correction
- 5.4.2. Harmonic filter
- 5.4.3. Voltage Regulation
- 5.4.4. Renewable Integration
- 5.4.5. Industrial Application
- 5.4.6. Data Centers
- 5.4.7. Others
- 5.5. Market Analysis, Insights and Forecast - by Region
- 5.5.1. Asia Pacific
- 5.1. Market Analysis, Insights and Forecast - by Major players in the capacitor bank market employ a range of strategies to both retain and extend their market share. These strategies are typically influenced by factors such as competitive dynamics, technological progress, shifts in regulations, and evolving customer needs. The participants operating across the market include:
- 6. Competitive Analysis
- 6.1. Market Share Analysis 2024
- 6.2. Company Profiles
- 6.2.1 ABB
- 6.2.1.1. Overview
- 6.2.1.2. Products
- 6.2.1.3. SWOT Analysis
- 6.2.1.4. Recent Developments
- 6.2.1.5. Financials (Based on Availability)
- 6.2.2 Schneider Electric
- 6.2.2.1. Overview
- 6.2.2.2. Products
- 6.2.2.3. SWOT Analysis
- 6.2.2.4. Recent Developments
- 6.2.2.5. Financials (Based on Availability)
- 6.2.3 Eaton
- 6.2.3.1. Overview
- 6.2.3.2. Products
- 6.2.3.3. SWOT Analysis
- 6.2.3.4. Recent Developments
- 6.2.3.5. Financials (Based on Availability)
- 6.2.4 Siemens
- 6.2.4.1. Overview
- 6.2.4.2. Products
- 6.2.4.3. SWOT Analysis
- 6.2.4.4. Recent Developments
- 6.2.4.5. Financials (Based on Availability)
- 6.2.5 Hitachi
- 6.2.5.1. Overview
- 6.2.5.2. Products
- 6.2.5.3. SWOT Analysis
- 6.2.5.4. Recent Developments
- 6.2.5.5. Financials (Based on Availability)
- 6.2.6 Legrand
- 6.2.6.1. Overview
- 6.2.6.2. Products
- 6.2.6.3. SWOT Analysis
- 6.2.6.4. Recent Developments
- 6.2.6.5. Financials (Based on Availability)
- 6.2.7 Arteche
- 6.2.7.1. Overview
- 6.2.7.2. Products
- 6.2.7.3. SWOT Analysis
- 6.2.7.4. Recent Developments
- 6.2.7.5. Financials (Based on Availability)
- 6.2.8 Unistar
- 6.2.8.1. Overview
- 6.2.8.2. Products
- 6.2.8.3. SWOT Analysis
- 6.2.8.4. Recent Developments
- 6.2.8.5. Financials (Based on Availability)
- 6.2.9 Lifasa
- 6.2.9.1. Overview
- 6.2.9.2. Products
- 6.2.9.3. SWOT Analysis
- 6.2.9.4. Recent Developments
- 6.2.9.5. Financials (Based on Availability)
- 6.2.10 Genteq
- 6.2.10.1. Overview
- 6.2.10.2. Products
- 6.2.10.3. SWOT Analysis
- 6.2.10.4. Recent Developments
- 6.2.10.5. Financials (Based on Availability)
- 6.2.11 Circutor
- 6.2.11.1. Overview
- 6.2.11.2. Products
- 6.2.11.3. SWOT Analysis
- 6.2.11.4. Recent Developments
- 6.2.11.5. Financials (Based on Availability)
- 6.2.12 Vishay
- 6.2.12.1. Overview
- 6.2.12.2. Products
- 6.2.12.3. SWOT Analysis
- 6.2.12.4. Recent Developments
- 6.2.12.5. Financials (Based on Availability)
- 6.2.13 RTR Energia
- 6.2.13.1. Overview
- 6.2.13.2. Products
- 6.2.13.3. SWOT Analysis
- 6.2.13.4. Recent Developments
- 6.2.13.5. Financials (Based on Availability)
- 6.2.14 YUHCHANG ELECTRIC CO. LTD.
- 6.2.14.1. Overview
- 6.2.14.2. Products
- 6.2.14.3. SWOT Analysis
- 6.2.14.4. Recent Developments
- 6.2.14.5. Financials (Based on Availability)
- 6.2.15 Samwha
- 6.2.15.1. Overview
- 6.2.15.2. Products
- 6.2.15.3. SWOT Analysis
- 6.2.15.4. Recent Developments
- 6.2.15.5. Financials (Based on Availability)
- 6.2.16 DUCATI Energia Spa
- 6.2.16.1. Overview
- 6.2.16.2. Products
- 6.2.16.3. SWOT Analysis
- 6.2.16.4. Recent Developments
- 6.2.16.5. Financials (Based on Availability)
- 6.2.1 ABB
- Figure 1: Asia Pacific Capacitor Bank Market Revenue Breakdown (Billion, %) by Product 2024 & 2032
- Figure 2: Asia Pacific Capacitor Bank Market Share (%) by Company 2024
- Table 1: Asia Pacific Capacitor Bank Market Revenue Billion Forecast, by Region 2019 & 2032
- Table 2: Asia Pacific Capacitor Bank Market Revenue Billion Forecast, by Major players in the capacitor bank market employ a range of strategies to both retain and extend their market share. These strategies are typically influenced by factors such as competitive dynamics, technological progress, shifts in regulations, and evolving customer needs. The participants operating across the market include: 2019 & 2032
- Table 3: Asia Pacific Capacitor Bank Market Revenue Billion Forecast, by Voltage 2019 & 2032
- Table 4: Asia Pacific Capacitor Bank Market Revenue Billion Forecast, by Type 2019 & 2032
- Table 5: Asia Pacific Capacitor Bank Market Revenue Billion Forecast, by Application 2019 & 2032
- Table 6: Asia Pacific Capacitor Bank Market Revenue Billion Forecast, by Region 2019 & 2032
- Table 7: Asia Pacific Capacitor Bank Market Revenue Billion Forecast, by Major players in the capacitor bank market employ a range of strategies to both retain and extend their market share. These strategies are typically influenced by factors such as competitive dynamics, technological progress, shifts in regulations, and evolving customer needs. The participants operating across the market include: 2019 & 2032
- Table 8: Asia Pacific Capacitor Bank Market Revenue Billion Forecast, by Voltage 2019 & 2032
- Table 9: Asia Pacific Capacitor Bank Market Revenue Billion Forecast, by Type 2019 & 2032
- Table 10: Asia Pacific Capacitor Bank Market Revenue Billion Forecast, by Application 2019 & 2032
- Table 11: Asia Pacific Capacitor Bank Market Revenue Billion Forecast, by Country 2019 & 2032
- Table 12: China Asia Pacific Capacitor Bank Market Revenue (Billion) Forecast, by Application 2019 & 2032
- Table 13: India Asia Pacific Capacitor Bank Market Revenue (Billion) Forecast, by Application 2019 & 2032
- Table 14: Japan Asia Pacific Capacitor Bank Market Revenue (Billion) Forecast, by Application 2019 & 2032
- Table 15: Australia Asia Pacific Capacitor Bank Market Revenue (Billion) Forecast, by Application 2019 & 2032
- Table 16: South Korea Asia Pacific Capacitor Bank Market Revenue (Billion) Forecast, by Application 2019 & 2032
- Table 17: Indonesia Asia Pacific Capacitor Bank Market Revenue (Billion) Forecast, by Application 2019 & 2032
- Table 18: Malaysia Asia Pacific Capacitor Bank Market Revenue (Billion) Forecast, by Application 2019 & 2032
- Table 19: Singapore Asia Pacific Capacitor Bank Market Revenue (Billion) Forecast, by Application 2019 & 2032
- Table 20: Thailand Asia Pacific Capacitor Bank Market Revenue (Billion) Forecast, by Application 2019 & 2032
- Table 21: Vietnam Asia Pacific Capacitor Bank Market Revenue (Billion) Forecast, by Application 2019 & 2032
- Table 22: Philippines Asia Pacific Capacitor Bank Market Revenue (Billion) Forecast, by Application 2019 & 2032
- Table 23: Sri Lanka Asia Pacific Capacitor Bank Market Revenue (Billion) Forecast, by Application 2019 & 2032
STEP 1 - Identification of Relevant Samples Size from Population Database


STEP 2 - Approaches for Defining Global Market Size (Value, Volume* & Price*)

Note* : In applicable scenarios
STEP 3 - Data Sources
Primary Research
- Web Analytics
- Survey Reports
- Research Institute
- Latest Research Reports
- Opinion Leaders
Secondary Research
- Annual Reports
- White Paper
- Latest Press Release
- Industry Association
- Paid Database
- Investor Presentations

STEP 4 - Data Triangulation
Involves using different sources of information in order to increase the validity of a study
These sources are likely to be stakeholders in a program - participants, other researchers, program staff, other community members, and so on.
Then we put all data in single framework & apply various statistical tools to find out the dynamic on the market.
During the analysis stage, feedback from the stakeholder groups would be compared to determine areas of agreement as well as areas of divergence
Frequently Asked Questions
Related Reports
See the similar reports


About Market Insights Report
Market Insights Reports offers comprehensive market research reports and analysis, giving businesses important information about their clients, rivals, and sector to help them make well-informed decisions on operations, marketing, and business strategy. We offer a variety of services in addition to market research, data analysis, and strategy planning. In order to find opportunities and learn more about our competitors and the industry at large, we employ competitive analysis. To identify areas for development, we also evaluate our performance against that of our rivals. We can determine the places at which we can offer our clients the most value by performing value chain analysis.
Additionally, clients receive a thorough overview of their industry business environment. We can find trends that help us forecast future possibilities and threats by examining global macroeconomic dynamics and consumer behavior patterns. By analyzing their features and advantages, contrasting them with comparable items on the market, and evaluating both their quantitative and qualitative performance, we comprehensively evaluate our clients' products. This allows us to assist customers in determining how their goods compare to those of their rivals and in creating successful marketing plans. Our group has been successful in gaining a thorough grasp of our clients' requirements and offering them creative solutions. We currently provide services to more than 50 nations in Europe, the Middle East, Africa, Latin America, Asia Pacific, and North America. Because of our global reach, we have been able to establish trusting bonds with our partners and clients in various nations, improving customer service and forging a more cohesive worldwide presence.