
.jpg&w=3840&q=100)
Market
Insights
Reports delivered globally, covering a wide range of industries and sectors.
Clients who trust our expertise and rely on our insights for business decisions.
Managed Reports, ensuring seamless updates and premium service.
Satisfied Customers, committed to delivering exceptional value and quality.
Compression Packing Market Unlocking Growth Opportunities: Analysis and Forecast 2025-2033
Compression Packing Market by Material Type (Graphite, PTFE, Aramid, Carbon, Synthetic Fibers), by Application (Pumps, Valves, Rotating equipment, Static equipment, Others), by End-use (Oil and gas, , Chemical and Petrochemical, Power Generation, Food and Beverage, Water and Wastewater, Pharmaceutical and Biotechnology, Others), by North America (U.S., Canada), by Europe (Germany, UK, France, Spain, Italy, Russia), by Asia Pacific (China, Japan, India, Australia, South Korea, Indonesia, Malaysia), by Latin America (Brazil, Mexico), by Middle East & Africa (South Africa, Saudi Arabia, UAE) Forecast 2025-2033
Compression Packing Market Unlocking Growth Opportunities: Analysis and Forecast 2025-2033
Key Insights
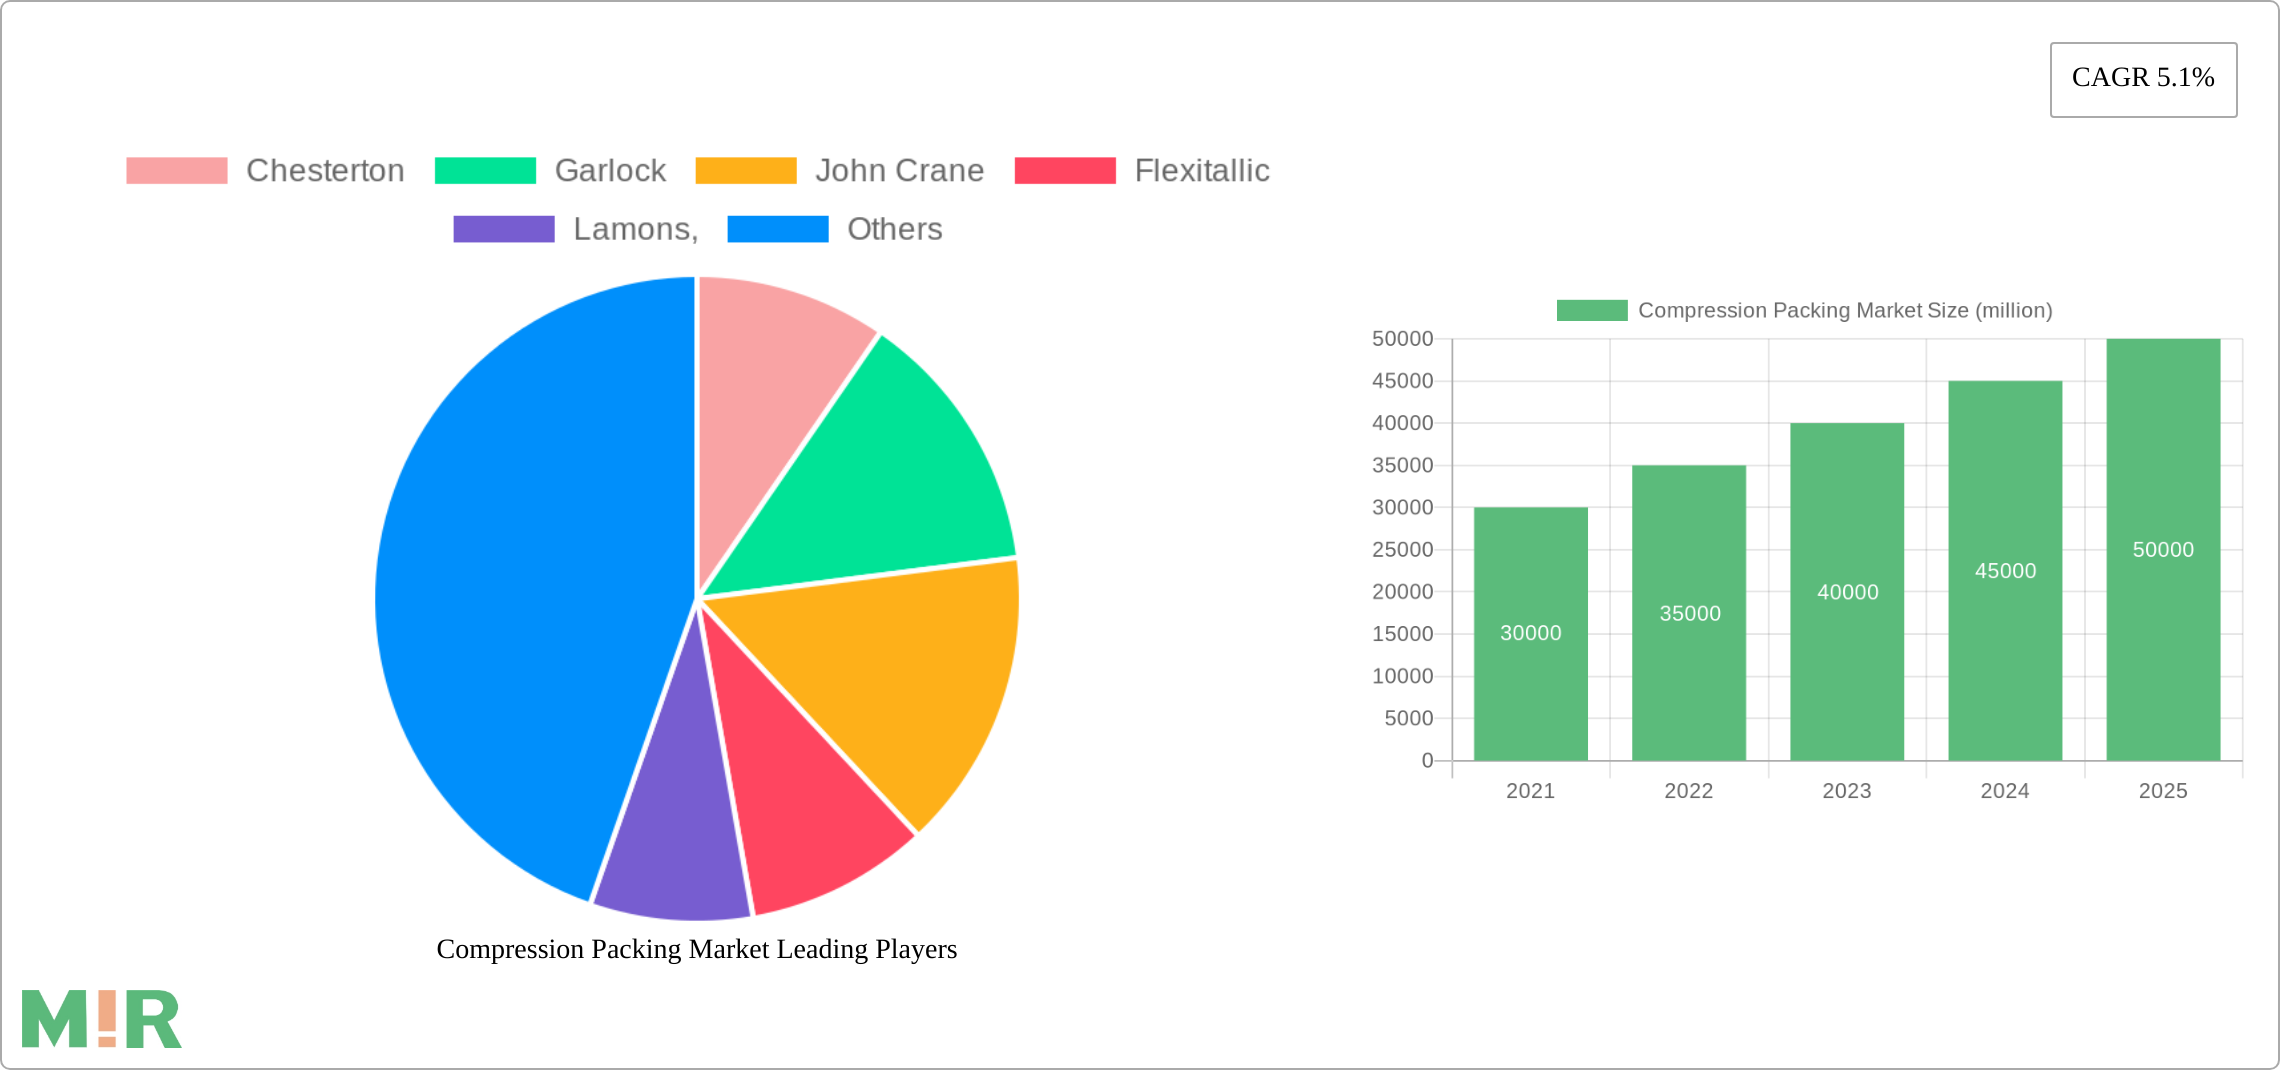
The size of the Compression Packing Market was valued at USD 850 million in 2024 and is projected to reach USD 1204.03 million by 2033, with an expected CAGR of 5.1% during the forecast period. The Compression Packing Market emphasizes the creation and application of sealing materials, mainly intended for industrial uses, where they form seals between components or machinery under compression to avert leaks, sustain pressure, and guarantee system effectiveness. These packing solutions are usually composed of materials like graphite, PTFE (polytetrafluoroethylene), rubber, and substitutes for asbestos. The market caters to sectors such as oil and gas, chemical processing, power generation, automotive, and manufacturing, where devices like pumps, valves, and compressors need dependable sealing to avoid fluid or gas leaks. The need for compression packing is fueled by the demand for enhanced safety, energy efficiency, and reliable operation in essential industrial systems. Furthermore, regulatory demands for environmental safeguarding and leak prevention are urging companies to implement superior compression packing solutions. The market is progressing with an emphasis on environmentally friendly materials and the creation of high-performance packaging solutions that provide enhanced durability and resistance to harsh temperatures, chemicals, and mechanical pressure. As sectors increasingly focus on operational efficiency, safety, and sustainability, the Compression Packing Market is projected to expand, fueled by advancements in material technology and manufacturing methods that will shape its future growth.
Compression Packing Market Concentration & Characteristics
The compression packing market is characterized by a fragmented vendor landscape, with numerous regional and global players competing. Major vendors include Chesterton, Garlock, John Crane, Flexitallic, Lamons, Teadit, and KLINGER. Concentration is particularly evident in the end-user segments, where oil and gas and power generation industries account for a significant share of market demand.
Compression Packing Market Trends
Key market trends shaping the compression packing industry include:
- Increased Focus on Energy Efficiency: Stringent environmental regulations and rising energy costs have led to a growing demand for energy-efficient compression packing solutions.
- Advancements in Material Technology: The development of advanced materials, such as fluorocarbon-based compounds and graphite-based composites, has improved the performance and durability of compression packing.
- Digitalization: The integration of digital technologies, such as sensors and IoT platforms, is enabling real-time monitoring and predictive maintenance, enhancing equipment reliability.
- Rise of Sustainable Solutions: The increasing focus on sustainability is driving demand for environmentally friendly compression packing materials and manufacturing processes.

Key Region or Country & Segment to Dominate the Market
- Region: Asia Pacific is projected to dominate the compression packing market over the forecast period due to rapid industrialization and increasing infrastructure investment in emerging economies like China and India.
- Segment: The oil and gas end-use segment is expected to remain the largest market share holder, driven by growing exploration and production activities.
Compression Packing Market Product Insights Report Coverage & Deliverables
The Compression Packing Market Product Insights Report provides detailed analysis on the following segments:
Material Type:
- Graphite
- PTFE
- Aramid
- Carbon
- Synthetic Fibers
Application:
- Pumps
- Valves
- Rotating equipment
- Static equipment
- Others
End-use:
- Oil and gas
- Chemical and Petrochemical
- Power Generation
- Food and Beverage
- Water and Wastewater
- Pharmaceutical and Biotechnology
- Others
Compression Packing Market Analysis
The Compression Packing Market analysis includes comprehensive market size, market share, and growth analysis for each segment and region.
Compression Packing Market Regional Insights
- North America: U.S., Canada
- Europe: Germany, UK, France, Spain, Italy, Russia
- Asia Pacific: China, Japan, India, Australia, South Korea, Indonesia, Malaysia
- Latin America: Brazil, Mexico
- Middle East & Africa: South Africa, Saudi Arabia, UAE
Driving Forces: What's Propelling the Compression Packing Market
- Rising demand for reliable industrial equipment
- Increased focus on energy efficiency
- Advancements in material technology
- Digitalization and IoT integration
Challenges and Restraints in Compression Packing Market
- Fluctuating raw material prices
- Intense competition in the market
- Stringent environmental regulations
- Availability of alternative sealing solutions
Emerging Trends in Compression Packing Market
- Development of sustainable and environmentally friendly materials
- Adoption of advanced manufacturing techniques
- Integration of sensors and IoT platforms for remote monitoring
- Predictive maintenance and condition-based monitoring
Compression Packing Industry News
- John Crane Announces New Non-Asbestos Packing for Rotating Equipment
- Teadit Launches Innovative Bio-Based Packing Material
- Flexitallic Partners with Siemens for Digitalization Solutions
Leading Players in the Compression Packing Market
Compression Packing Market Segmentation
- 1. Material Type
- 1.1. Graphite
- 1.2. PTFE
- 1.3. Aramid
- 1.4. Carbon
- 1.5. Synthetic Fibers
- 2. Application
- 2.1. Pumps
- 2.2. Valves
- 2.3. Rotating equipment
- 2.4. Static equipment
- 2.5. Others
- 3. End-use
- 3.1. Oil and gas,
- 3.2. Chemical and Petrochemical
- 3.3. Power Generation
- 3.4. Food and Beverage
- 3.5. Water and Wastewater
- 3.6. Pharmaceutical and Biotechnology
- 3.7. Others
Compression Packing Market Segmentation By Geography
- 1. North America
- 1.1. U.S.
- 1.2. Canada
- 2. Europe
- 2.1. Germany
- 2.2. UK
- 2.3. France
- 2.4. Spain
- 2.5. Italy
- 2.6. Russia
- 3. Asia Pacific
- 3.1. China
- 3.2. Japan
- 3.3. India
- 3.4. Australia
- 3.5. South Korea
- 3.6. Indonesia
- 3.7. Malaysia
- 4. Latin America
- 4.1. Brazil
- 4.2. Mexico
- 5. Middle East & Africa
- 5.1. South Africa
- 5.2. Saudi Arabia
- 5.3. UAE

Compression Packing Market REPORT HIGHLIGHTS
| Aspects | Details |
|---|---|
| Study Period | 2019-2033 |
| Base Year | 2024 |
| Estimated Year | 2025 |
| Forecast Period | 2025-2033 |
| Historical Period | 2019-2024 |
| Growth Rate | CAGR of 5.1% from 2019-2033 |
| Segmentation |
|
- 1. Introduction
- 1.1. Research Scope
- 1.2. Market Segmentation
- 1.3. Research Methodology
- 1.4. Definitions and Assumptions
- 2. Executive Summary
- 2.1. Introduction
- 3. Market Dynamics
- 3.1. Introduction
- 3.2. Market Drivers
- 3.2.1 Increasing industrial activities
- 3.2.2 Infrastructure development in emerging economies
- 3.2.3 Need for maintenance and repair of existing equipment
- 3.2.4 Fluctuations in raw material prices
- 3.3. Market Restrains
- 3.3.1 The availability of alternative sealing technologies
- 3.3.2 Price sensitivity of customers
- 3.4. Market Trends
- 4. Market Factor Analysis
- 4.1. Porters Five Forces
- 4.2. Supply/Value Chain
- 4.3. PESTEL analysis
- 4.4. Market Entropy
- 4.5. Patent/Trademark Analysis
- 5. Global Compression Packing Market Analysis, Insights and Forecast, 2019-2031
- 5.1. Market Analysis, Insights and Forecast - by Material Type
- 5.1.1. Graphite
- 5.1.2. PTFE
- 5.1.3. Aramid
- 5.1.4. Carbon
- 5.1.5. Synthetic Fibers
- 5.2. Market Analysis, Insights and Forecast - by Application
- 5.2.1. Pumps
- 5.2.2. Valves
- 5.2.3. Rotating equipment
- 5.2.4. Static equipment
- 5.2.5. Others
- 5.3. Market Analysis, Insights and Forecast - by End-use
- 5.3.1. Oil and gas,
- 5.3.2. Chemical and Petrochemical
- 5.3.3. Power Generation
- 5.3.4. Food and Beverage
- 5.3.5. Water and Wastewater
- 5.3.6. Pharmaceutical and Biotechnology
- 5.3.7. Others
- 5.4. Market Analysis, Insights and Forecast - by Region
- 5.4.1. North America
- 5.4.2. Europe
- 5.4.3. Asia Pacific
- 5.4.4. Latin America
- 5.4.5. Middle East & Africa
- 5.1. Market Analysis, Insights and Forecast - by Material Type
- 6. North America Compression Packing Market Analysis, Insights and Forecast, 2019-2031
- 6.1. Market Analysis, Insights and Forecast - by Material Type
- 6.1.1. Graphite
- 6.1.2. PTFE
- 6.1.3. Aramid
- 6.1.4. Carbon
- 6.1.5. Synthetic Fibers
- 6.2. Market Analysis, Insights and Forecast - by Application
- 6.2.1. Pumps
- 6.2.2. Valves
- 6.2.3. Rotating equipment
- 6.2.4. Static equipment
- 6.2.5. Others
- 6.3. Market Analysis, Insights and Forecast - by End-use
- 6.3.1. Oil and gas,
- 6.3.2. Chemical and Petrochemical
- 6.3.3. Power Generation
- 6.3.4. Food and Beverage
- 6.3.5. Water and Wastewater
- 6.3.6. Pharmaceutical and Biotechnology
- 6.3.7. Others
- 6.1. Market Analysis, Insights and Forecast - by Material Type
- 7. Europe Compression Packing Market Analysis, Insights and Forecast, 2019-2031
- 7.1. Market Analysis, Insights and Forecast - by Material Type
- 7.1.1. Graphite
- 7.1.2. PTFE
- 7.1.3. Aramid
- 7.1.4. Carbon
- 7.1.5. Synthetic Fibers
- 7.2. Market Analysis, Insights and Forecast - by Application
- 7.2.1. Pumps
- 7.2.2. Valves
- 7.2.3. Rotating equipment
- 7.2.4. Static equipment
- 7.2.5. Others
- 7.3. Market Analysis, Insights and Forecast - by End-use
- 7.3.1. Oil and gas,
- 7.3.2. Chemical and Petrochemical
- 7.3.3. Power Generation
- 7.3.4. Food and Beverage
- 7.3.5. Water and Wastewater
- 7.3.6. Pharmaceutical and Biotechnology
- 7.3.7. Others
- 7.1. Market Analysis, Insights and Forecast - by Material Type
- 8. Asia Pacific Compression Packing Market Analysis, Insights and Forecast, 2019-2031
- 8.1. Market Analysis, Insights and Forecast - by Material Type
- 8.1.1. Graphite
- 8.1.2. PTFE
- 8.1.3. Aramid
- 8.1.4. Carbon
- 8.1.5. Synthetic Fibers
- 8.2. Market Analysis, Insights and Forecast - by Application
- 8.2.1. Pumps
- 8.2.2. Valves
- 8.2.3. Rotating equipment
- 8.2.4. Static equipment
- 8.2.5. Others
- 8.3. Market Analysis, Insights and Forecast - by End-use
- 8.3.1. Oil and gas,
- 8.3.2. Chemical and Petrochemical
- 8.3.3. Power Generation
- 8.3.4. Food and Beverage
- 8.3.5. Water and Wastewater
- 8.3.6. Pharmaceutical and Biotechnology
- 8.3.7. Others
- 8.1. Market Analysis, Insights and Forecast - by Material Type
- 9. Latin America Compression Packing Market Analysis, Insights and Forecast, 2019-2031
- 9.1. Market Analysis, Insights and Forecast - by Material Type
- 9.1.1. Graphite
- 9.1.2. PTFE
- 9.1.3. Aramid
- 9.1.4. Carbon
- 9.1.5. Synthetic Fibers
- 9.2. Market Analysis, Insights and Forecast - by Application
- 9.2.1. Pumps
- 9.2.2. Valves
- 9.2.3. Rotating equipment
- 9.2.4. Static equipment
- 9.2.5. Others
- 9.3. Market Analysis, Insights and Forecast - by End-use
- 9.3.1. Oil and gas,
- 9.3.2. Chemical and Petrochemical
- 9.3.3. Power Generation
- 9.3.4. Food and Beverage
- 9.3.5. Water and Wastewater
- 9.3.6. Pharmaceutical and Biotechnology
- 9.3.7. Others
- 9.1. Market Analysis, Insights and Forecast - by Material Type
- 10. Middle East & Africa Compression Packing Market Analysis, Insights and Forecast, 2019-2031
- 10.1. Market Analysis, Insights and Forecast - by Material Type
- 10.1.1. Graphite
- 10.1.2. PTFE
- 10.1.3. Aramid
- 10.1.4. Carbon
- 10.1.5. Synthetic Fibers
- 10.2. Market Analysis, Insights and Forecast - by Application
- 10.2.1. Pumps
- 10.2.2. Valves
- 10.2.3. Rotating equipment
- 10.2.4. Static equipment
- 10.2.5. Others
- 10.3. Market Analysis, Insights and Forecast - by End-use
- 10.3.1. Oil and gas,
- 10.3.2. Chemical and Petrochemical
- 10.3.3. Power Generation
- 10.3.4. Food and Beverage
- 10.3.5. Water and Wastewater
- 10.3.6. Pharmaceutical and Biotechnology
- 10.3.7. Others
- 10.1. Market Analysis, Insights and Forecast - by Material Type
- 11. Competitive Analysis
- 11.1. Global Market Share Analysis 2024
- 11.2. Company Profiles
- 11.2.1 Chesterton
- 11.2.1.1. Overview
- 11.2.1.2. Products
- 11.2.1.3. SWOT Analysis
- 11.2.1.4. Recent Developments
- 11.2.1.5. Financials (Based on Availability)
- 11.2.2 Garlock
- 11.2.2.1. Overview
- 11.2.2.2. Products
- 11.2.2.3. SWOT Analysis
- 11.2.2.4. Recent Developments
- 11.2.2.5. Financials (Based on Availability)
- 11.2.3 John Crane
- 11.2.3.1. Overview
- 11.2.3.2. Products
- 11.2.3.3. SWOT Analysis
- 11.2.3.4. Recent Developments
- 11.2.3.5. Financials (Based on Availability)
- 11.2.4 Flexitallic
- 11.2.4.1. Overview
- 11.2.4.2. Products
- 11.2.4.3. SWOT Analysis
- 11.2.4.4. Recent Developments
- 11.2.4.5. Financials (Based on Availability)
- 11.2.5 Lamons
- 11.2.5.1. Overview
- 11.2.5.2. Products
- 11.2.5.3. SWOT Analysis
- 11.2.5.4. Recent Developments
- 11.2.5.5. Financials (Based on Availability)
- 11.2.6 Teadit
- 11.2.6.1. Overview
- 11.2.6.2. Products
- 11.2.6.3. SWOT Analysis
- 11.2.6.4. Recent Developments
- 11.2.6.5. Financials (Based on Availability)
- 11.2.7 KLINGER
- 11.2.7.1. Overview
- 11.2.7.2. Products
- 11.2.7.3. SWOT Analysis
- 11.2.7.4. Recent Developments
- 11.2.7.5. Financials (Based on Availability)
- 11.2.1 Chesterton
- Figure 1: Global Compression Packing Market Revenue Breakdown (million, %) by Region 2024 & 2032
- Figure 2: Global Compression Packing Market Volume Breakdown (K Tons, %) by Region 2024 & 2032
- Figure 3: North America Compression Packing Market Revenue (million), by Material Type 2024 & 2032
- Figure 4: North America Compression Packing Market Volume (K Tons), by Material Type 2024 & 2032
- Figure 5: North America Compression Packing Market Revenue Share (%), by Material Type 2024 & 2032
- Figure 6: North America Compression Packing Market Volume Share (%), by Material Type 2024 & 2032
- Figure 7: North America Compression Packing Market Revenue (million), by Application 2024 & 2032
- Figure 8: North America Compression Packing Market Volume (K Tons), by Application 2024 & 2032
- Figure 9: North America Compression Packing Market Revenue Share (%), by Application 2024 & 2032
- Figure 10: North America Compression Packing Market Volume Share (%), by Application 2024 & 2032
- Figure 11: North America Compression Packing Market Revenue (million), by End-use 2024 & 2032
- Figure 12: North America Compression Packing Market Volume (K Tons), by End-use 2024 & 2032
- Figure 13: North America Compression Packing Market Revenue Share (%), by End-use 2024 & 2032
- Figure 14: North America Compression Packing Market Volume Share (%), by End-use 2024 & 2032
- Figure 15: North America Compression Packing Market Revenue (million), by Country 2024 & 2032
- Figure 16: North America Compression Packing Market Volume (K Tons), by Country 2024 & 2032
- Figure 17: North America Compression Packing Market Revenue Share (%), by Country 2024 & 2032
- Figure 18: North America Compression Packing Market Volume Share (%), by Country 2024 & 2032
- Figure 19: Europe Compression Packing Market Revenue (million), by Material Type 2024 & 2032
- Figure 20: Europe Compression Packing Market Volume (K Tons), by Material Type 2024 & 2032
- Figure 21: Europe Compression Packing Market Revenue Share (%), by Material Type 2024 & 2032
- Figure 22: Europe Compression Packing Market Volume Share (%), by Material Type 2024 & 2032
- Figure 23: Europe Compression Packing Market Revenue (million), by Application 2024 & 2032
- Figure 24: Europe Compression Packing Market Volume (K Tons), by Application 2024 & 2032
- Figure 25: Europe Compression Packing Market Revenue Share (%), by Application 2024 & 2032
- Figure 26: Europe Compression Packing Market Volume Share (%), by Application 2024 & 2032
- Figure 27: Europe Compression Packing Market Revenue (million), by End-use 2024 & 2032
- Figure 28: Europe Compression Packing Market Volume (K Tons), by End-use 2024 & 2032
- Figure 29: Europe Compression Packing Market Revenue Share (%), by End-use 2024 & 2032
- Figure 30: Europe Compression Packing Market Volume Share (%), by End-use 2024 & 2032
- Figure 31: Europe Compression Packing Market Revenue (million), by Country 2024 & 2032
- Figure 32: Europe Compression Packing Market Volume (K Tons), by Country 2024 & 2032
- Figure 33: Europe Compression Packing Market Revenue Share (%), by Country 2024 & 2032
- Figure 34: Europe Compression Packing Market Volume Share (%), by Country 2024 & 2032
- Figure 35: Asia Pacific Compression Packing Market Revenue (million), by Material Type 2024 & 2032
- Figure 36: Asia Pacific Compression Packing Market Volume (K Tons), by Material Type 2024 & 2032
- Figure 37: Asia Pacific Compression Packing Market Revenue Share (%), by Material Type 2024 & 2032
- Figure 38: Asia Pacific Compression Packing Market Volume Share (%), by Material Type 2024 & 2032
- Figure 39: Asia Pacific Compression Packing Market Revenue (million), by Application 2024 & 2032
- Figure 40: Asia Pacific Compression Packing Market Volume (K Tons), by Application 2024 & 2032
- Figure 41: Asia Pacific Compression Packing Market Revenue Share (%), by Application 2024 & 2032
- Figure 42: Asia Pacific Compression Packing Market Volume Share (%), by Application 2024 & 2032
- Figure 43: Asia Pacific Compression Packing Market Revenue (million), by End-use 2024 & 2032
- Figure 44: Asia Pacific Compression Packing Market Volume (K Tons), by End-use 2024 & 2032
- Figure 45: Asia Pacific Compression Packing Market Revenue Share (%), by End-use 2024 & 2032
- Figure 46: Asia Pacific Compression Packing Market Volume Share (%), by End-use 2024 & 2032
- Figure 47: Asia Pacific Compression Packing Market Revenue (million), by Country 2024 & 2032
- Figure 48: Asia Pacific Compression Packing Market Volume (K Tons), by Country 2024 & 2032
- Figure 49: Asia Pacific Compression Packing Market Revenue Share (%), by Country 2024 & 2032
- Figure 50: Asia Pacific Compression Packing Market Volume Share (%), by Country 2024 & 2032
- Figure 51: Latin America Compression Packing Market Revenue (million), by Material Type 2024 & 2032
- Figure 52: Latin America Compression Packing Market Volume (K Tons), by Material Type 2024 & 2032
- Figure 53: Latin America Compression Packing Market Revenue Share (%), by Material Type 2024 & 2032
- Figure 54: Latin America Compression Packing Market Volume Share (%), by Material Type 2024 & 2032
- Figure 55: Latin America Compression Packing Market Revenue (million), by Application 2024 & 2032
- Figure 56: Latin America Compression Packing Market Volume (K Tons), by Application 2024 & 2032
- Figure 57: Latin America Compression Packing Market Revenue Share (%), by Application 2024 & 2032
- Figure 58: Latin America Compression Packing Market Volume Share (%), by Application 2024 & 2032
- Figure 59: Latin America Compression Packing Market Revenue (million), by End-use 2024 & 2032
- Figure 60: Latin America Compression Packing Market Volume (K Tons), by End-use 2024 & 2032
- Figure 61: Latin America Compression Packing Market Revenue Share (%), by End-use 2024 & 2032
- Figure 62: Latin America Compression Packing Market Volume Share (%), by End-use 2024 & 2032
- Figure 63: Latin America Compression Packing Market Revenue (million), by Country 2024 & 2032
- Figure 64: Latin America Compression Packing Market Volume (K Tons), by Country 2024 & 2032
- Figure 65: Latin America Compression Packing Market Revenue Share (%), by Country 2024 & 2032
- Figure 66: Latin America Compression Packing Market Volume Share (%), by Country 2024 & 2032
- Figure 67: Middle East & Africa Compression Packing Market Revenue (million), by Material Type 2024 & 2032
- Figure 68: Middle East & Africa Compression Packing Market Volume (K Tons), by Material Type 2024 & 2032
- Figure 69: Middle East & Africa Compression Packing Market Revenue Share (%), by Material Type 2024 & 2032
- Figure 70: Middle East & Africa Compression Packing Market Volume Share (%), by Material Type 2024 & 2032
- Figure 71: Middle East & Africa Compression Packing Market Revenue (million), by Application 2024 & 2032
- Figure 72: Middle East & Africa Compression Packing Market Volume (K Tons), by Application 2024 & 2032
- Figure 73: Middle East & Africa Compression Packing Market Revenue Share (%), by Application 2024 & 2032
- Figure 74: Middle East & Africa Compression Packing Market Volume Share (%), by Application 2024 & 2032
- Figure 75: Middle East & Africa Compression Packing Market Revenue (million), by End-use 2024 & 2032
- Figure 76: Middle East & Africa Compression Packing Market Volume (K Tons), by End-use 2024 & 2032
- Figure 77: Middle East & Africa Compression Packing Market Revenue Share (%), by End-use 2024 & 2032
- Figure 78: Middle East & Africa Compression Packing Market Volume Share (%), by End-use 2024 & 2032
- Figure 79: Middle East & Africa Compression Packing Market Revenue (million), by Country 2024 & 2032
- Figure 80: Middle East & Africa Compression Packing Market Volume (K Tons), by Country 2024 & 2032
- Figure 81: Middle East & Africa Compression Packing Market Revenue Share (%), by Country 2024 & 2032
- Figure 82: Middle East & Africa Compression Packing Market Volume Share (%), by Country 2024 & 2032
- Table 1: Global Compression Packing Market Revenue million Forecast, by Region 2019 & 2032
- Table 2: Global Compression Packing Market Volume K Tons Forecast, by Region 2019 & 2032
- Table 3: Global Compression Packing Market Revenue million Forecast, by Material Type 2019 & 2032
- Table 4: Global Compression Packing Market Volume K Tons Forecast, by Material Type 2019 & 2032
- Table 5: Global Compression Packing Market Revenue million Forecast, by Application 2019 & 2032
- Table 6: Global Compression Packing Market Volume K Tons Forecast, by Application 2019 & 2032
- Table 7: Global Compression Packing Market Revenue million Forecast, by End-use 2019 & 2032
- Table 8: Global Compression Packing Market Volume K Tons Forecast, by End-use 2019 & 2032
- Table 9: Global Compression Packing Market Revenue million Forecast, by Region 2019 & 2032
- Table 10: Global Compression Packing Market Volume K Tons Forecast, by Region 2019 & 2032
- Table 11: Global Compression Packing Market Revenue million Forecast, by Material Type 2019 & 2032
- Table 12: Global Compression Packing Market Volume K Tons Forecast, by Material Type 2019 & 2032
- Table 13: Global Compression Packing Market Revenue million Forecast, by Application 2019 & 2032
- Table 14: Global Compression Packing Market Volume K Tons Forecast, by Application 2019 & 2032
- Table 15: Global Compression Packing Market Revenue million Forecast, by End-use 2019 & 2032
- Table 16: Global Compression Packing Market Volume K Tons Forecast, by End-use 2019 & 2032
- Table 17: Global Compression Packing Market Revenue million Forecast, by Country 2019 & 2032
- Table 18: Global Compression Packing Market Volume K Tons Forecast, by Country 2019 & 2032
- Table 19: U.S. Compression Packing Market Revenue (million) Forecast, by Application 2019 & 2032
- Table 20: U.S. Compression Packing Market Volume (K Tons) Forecast, by Application 2019 & 2032
- Table 21: Canada Compression Packing Market Revenue (million) Forecast, by Application 2019 & 2032
- Table 22: Canada Compression Packing Market Volume (K Tons) Forecast, by Application 2019 & 2032
- Table 23: Global Compression Packing Market Revenue million Forecast, by Material Type 2019 & 2032
- Table 24: Global Compression Packing Market Volume K Tons Forecast, by Material Type 2019 & 2032
- Table 25: Global Compression Packing Market Revenue million Forecast, by Application 2019 & 2032
- Table 26: Global Compression Packing Market Volume K Tons Forecast, by Application 2019 & 2032
- Table 27: Global Compression Packing Market Revenue million Forecast, by End-use 2019 & 2032
- Table 28: Global Compression Packing Market Volume K Tons Forecast, by End-use 2019 & 2032
- Table 29: Global Compression Packing Market Revenue million Forecast, by Country 2019 & 2032
- Table 30: Global Compression Packing Market Volume K Tons Forecast, by Country 2019 & 2032
- Table 31: Germany Compression Packing Market Revenue (million) Forecast, by Application 2019 & 2032
- Table 32: Germany Compression Packing Market Volume (K Tons) Forecast, by Application 2019 & 2032
- Table 33: UK Compression Packing Market Revenue (million) Forecast, by Application 2019 & 2032
- Table 34: UK Compression Packing Market Volume (K Tons) Forecast, by Application 2019 & 2032
- Table 35: France Compression Packing Market Revenue (million) Forecast, by Application 2019 & 2032
- Table 36: France Compression Packing Market Volume (K Tons) Forecast, by Application 2019 & 2032
- Table 37: Spain Compression Packing Market Revenue (million) Forecast, by Application 2019 & 2032
- Table 38: Spain Compression Packing Market Volume (K Tons) Forecast, by Application 2019 & 2032
- Table 39: Italy Compression Packing Market Revenue (million) Forecast, by Application 2019 & 2032
- Table 40: Italy Compression Packing Market Volume (K Tons) Forecast, by Application 2019 & 2032
- Table 41: Russia Compression Packing Market Revenue (million) Forecast, by Application 2019 & 2032
- Table 42: Russia Compression Packing Market Volume (K Tons) Forecast, by Application 2019 & 2032
- Table 43: Global Compression Packing Market Revenue million Forecast, by Material Type 2019 & 2032
- Table 44: Global Compression Packing Market Volume K Tons Forecast, by Material Type 2019 & 2032
- Table 45: Global Compression Packing Market Revenue million Forecast, by Application 2019 & 2032
- Table 46: Global Compression Packing Market Volume K Tons Forecast, by Application 2019 & 2032
- Table 47: Global Compression Packing Market Revenue million Forecast, by End-use 2019 & 2032
- Table 48: Global Compression Packing Market Volume K Tons Forecast, by End-use 2019 & 2032
- Table 49: Global Compression Packing Market Revenue million Forecast, by Country 2019 & 2032
- Table 50: Global Compression Packing Market Volume K Tons Forecast, by Country 2019 & 2032
- Table 51: China Compression Packing Market Revenue (million) Forecast, by Application 2019 & 2032
- Table 52: China Compression Packing Market Volume (K Tons) Forecast, by Application 2019 & 2032
- Table 53: Japan Compression Packing Market Revenue (million) Forecast, by Application 2019 & 2032
- Table 54: Japan Compression Packing Market Volume (K Tons) Forecast, by Application 2019 & 2032
- Table 55: India Compression Packing Market Revenue (million) Forecast, by Application 2019 & 2032
- Table 56: India Compression Packing Market Volume (K Tons) Forecast, by Application 2019 & 2032
- Table 57: Australia Compression Packing Market Revenue (million) Forecast, by Application 2019 & 2032
- Table 58: Australia Compression Packing Market Volume (K Tons) Forecast, by Application 2019 & 2032
- Table 59: South Korea Compression Packing Market Revenue (million) Forecast, by Application 2019 & 2032
- Table 60: South Korea Compression Packing Market Volume (K Tons) Forecast, by Application 2019 & 2032
- Table 61: Indonesia Compression Packing Market Revenue (million) Forecast, by Application 2019 & 2032
- Table 62: Indonesia Compression Packing Market Volume (K Tons) Forecast, by Application 2019 & 2032
- Table 63: Malaysia Compression Packing Market Revenue (million) Forecast, by Application 2019 & 2032
- Table 64: Malaysia Compression Packing Market Volume (K Tons) Forecast, by Application 2019 & 2032
- Table 65: Global Compression Packing Market Revenue million Forecast, by Material Type 2019 & 2032
- Table 66: Global Compression Packing Market Volume K Tons Forecast, by Material Type 2019 & 2032
- Table 67: Global Compression Packing Market Revenue million Forecast, by Application 2019 & 2032
- Table 68: Global Compression Packing Market Volume K Tons Forecast, by Application 2019 & 2032
- Table 69: Global Compression Packing Market Revenue million Forecast, by End-use 2019 & 2032
- Table 70: Global Compression Packing Market Volume K Tons Forecast, by End-use 2019 & 2032
- Table 71: Global Compression Packing Market Revenue million Forecast, by Country 2019 & 2032
- Table 72: Global Compression Packing Market Volume K Tons Forecast, by Country 2019 & 2032
- Table 73: Brazil Compression Packing Market Revenue (million) Forecast, by Application 2019 & 2032
- Table 74: Brazil Compression Packing Market Volume (K Tons) Forecast, by Application 2019 & 2032
- Table 75: Mexico Compression Packing Market Revenue (million) Forecast, by Application 2019 & 2032
- Table 76: Mexico Compression Packing Market Volume (K Tons) Forecast, by Application 2019 & 2032
- Table 77: Global Compression Packing Market Revenue million Forecast, by Material Type 2019 & 2032
- Table 78: Global Compression Packing Market Volume K Tons Forecast, by Material Type 2019 & 2032
- Table 79: Global Compression Packing Market Revenue million Forecast, by Application 2019 & 2032
- Table 80: Global Compression Packing Market Volume K Tons Forecast, by Application 2019 & 2032
- Table 81: Global Compression Packing Market Revenue million Forecast, by End-use 2019 & 2032
- Table 82: Global Compression Packing Market Volume K Tons Forecast, by End-use 2019 & 2032
- Table 83: Global Compression Packing Market Revenue million Forecast, by Country 2019 & 2032
- Table 84: Global Compression Packing Market Volume K Tons Forecast, by Country 2019 & 2032
- Table 85: South Africa Compression Packing Market Revenue (million) Forecast, by Application 2019 & 2032
- Table 86: South Africa Compression Packing Market Volume (K Tons) Forecast, by Application 2019 & 2032
- Table 87: Saudi Arabia Compression Packing Market Revenue (million) Forecast, by Application 2019 & 2032
- Table 88: Saudi Arabia Compression Packing Market Volume (K Tons) Forecast, by Application 2019 & 2032
- Table 89: UAE Compression Packing Market Revenue (million) Forecast, by Application 2019 & 2032
- Table 90: UAE Compression Packing Market Volume (K Tons) Forecast, by Application 2019 & 2032
STEP 1 - Identification of Relevant Samples Size from Population Database


STEP 2 - Approaches for Defining Global Market Size (Value, Volume* & Price*)

Note* : In applicable scenarios
STEP 3 - Data Sources
Primary Research
- Web Analytics
- Survey Reports
- Research Institute
- Latest Research Reports
- Opinion Leaders
Secondary Research
- Annual Reports
- White Paper
- Latest Press Release
- Industry Association
- Paid Database
- Investor Presentations

STEP 4 - Data Triangulation
Involves using different sources of information in order to increase the validity of a study
These sources are likely to be stakeholders in a program - participants, other researchers, program staff, other community members, and so on.
Then we put all data in single framework & apply various statistical tools to find out the dynamic on the market.
During the analysis stage, feedback from the stakeholder groups would be compared to determine areas of agreement as well as areas of divergence
Frequently Asked Questions
Related Reports
See the similar reports


About Market Insights Report
Market Insights Reports offers comprehensive market research reports and analysis, giving businesses important information about their clients, rivals, and sector to help them make well-informed decisions on operations, marketing, and business strategy. We offer a variety of services in addition to market research, data analysis, and strategy planning. In order to find opportunities and learn more about our competitors and the industry at large, we employ competitive analysis. To identify areas for development, we also evaluate our performance against that of our rivals. We can determine the places at which we can offer our clients the most value by performing value chain analysis.
Additionally, clients receive a thorough overview of their industry business environment. We can find trends that help us forecast future possibilities and threats by examining global macroeconomic dynamics and consumer behavior patterns. By analyzing their features and advantages, contrasting them with comparable items on the market, and evaluating both their quantitative and qualitative performance, we comprehensively evaluate our clients' products. This allows us to assist customers in determining how their goods compare to those of their rivals and in creating successful marketing plans. Our group has been successful in gaining a thorough grasp of our clients' requirements and offering them creative solutions. We currently provide services to more than 50 nations in Europe, the Middle East, Africa, Latin America, Asia Pacific, and North America. Because of our global reach, we have been able to establish trusting bonds with our partners and clients in various nations, improving customer service and forging a more cohesive worldwide presence.