Report banner
Data Center Power Market
Updated On

Feb 16 2025

Total Pages

250

Data Center Power Market Strategic Roadmap: Analysis and Forecasts 2025-2033

Data Center Power Market by Component (Solution, Service), by Application (BFSI, Colocation, Energy, Government, Healthcare, Manufacturing, IT & telecom, Others), by North America (U.S., Canada, Mexico), by Europe (UK, Germany, France, Spain, Poland, Benelux, Rest of Europe), by Asia Pacific (China, India, Japan, Singapore, Australia, Rest of Asia Pacific), by South America (Brazil, Chile, Peru, Argentina, Rest of South America), by MEA (GCC, South Africa, Rest of MEA) Forecast 2025-2033

Publisher Logo

Data Center Power Market Strategic Roadmap: Analysis and Forecasts 2025-2033


Key Insights

The size of the Data Center Power Market was valued at USD 12.6 Billion in 2024 and is projected to reach USD 20.90 Billion by 2033, with an expected CAGR of 7.5% during the forecast period. This expansion is driven by the rising demand for data center facilities worldwide, fueled by the increasing adoption of cloud computing, edge computing, and digital transformation initiatives. Additionally, the integration of renewable energy sources and advancements in power distribution and cooling technologies are enhancing data center efficiency and sustainability. Organizations are prioritizing reliable and energy-efficient power solutions to optimize operations and reduce carbon footprints. The benefits of advanced data center power solutions include improved efficiency, enhanced reliability, and robust security, leading to widespread adoption across various industries, including IT & telecom, healthcare, banking, and retail. Major players in this market include ABB, Active Power, Cummins, Hewlett Packard Company, Eaton Corporation, Caterpillar, Vertiv, Legrand, and Huawei. As data volumes continue to surge, investments in energy-efficient power infrastructure will remain a key focus.

Data Center Power Market Research Report - Market Size, Growth & Forecast

Data Center Power Market Concentration & Characteristics

The Data Center Power Market is moderately concentrated, with a few key players holding a significant market share. The market is characterized by continuous innovation, with players constantly introducing new technologies to meet the evolving needs of data centers. Regulatory policies regarding energy efficiency and sustainability also impact the market.

End-user concentration is high, with a few large data center operators accounting for a significant portion of the market. The level of M&A activity is moderate, with several acquisitions and partnerships occurring to expand market reach and strengthen product portfolios.

Data Center Power Market Trends

  • Increased Adoption of Cloud and Edge Computing: The growth of cloud computing and the proliferation of edge devices are driving demand for data centers, leading to increased investments in power infrastructure.
  • Focus on Sustainability and Energy Efficiency: Data centers consume significant energy, leading to a growing emphasis on sustainable and energy-efficient power solutions.
  • Advancements in Power Distribution and Cooling Technologies: Innovations in power distribution units (PDUs), uninterruptible power supplies (UPS), generators, and cooling systems are improving efficiency, reliability, and space utilization in data centers.

Data Center Power Market Growth

Key Region or Country & Segment to Dominate the Market

Key Regions:

  • North America: Dominates the market due to the presence of major data center providers and the high adoption of cloud services.
  • Asia Pacific: Expected to experience significant growth due to the increasing demand for data center facilities in emerging economies like China and India.

Dominating Segment:

  • Solution: Power Distribution Units (PDU) segment holds the largest market share due to the critical role of PDUs in distributing power within data centers.

Data Center Power Market Product Insights Report Coverage & Deliverables

The report provides a comprehensive analysis of the Data Center Power Market, including:

  • Market size and growth forecasts
  • Market segmentation by component, service, and application
  • Market share analysis of key players
  • Industry trends and drivers
  • Competitive landscape

Data Center Power Market Analysis

Market Size and Growth: The Data Center Power Market is valued at 12.6 Billion in 2023 and is projected to reach 19.4 Billion by 2030, growing at a CAGR of 7.5%.

Market Share: Eaton Corporation, Vertiv, and ABB hold significant market shares, accounting for over 40% of the total market.

Growth Drivers: The key growth drivers include increasing data center demand, advancements in power distribution technologies, and sustainability regulations.

Data Center Power Market Regional Insights

North America: U.S., Canada, Mexico

Europe: UK, Germany, France, Spain, Poland, Benelux

Asia Pacific: China, India, Japan, Singapore, Australia

South America: Brazil, Chile, Peru, Argentina

Driving Forces: What's Propelling the Data Center Power Market

  • Growth of data center facilities worldwide
  • Integration of renewable energy sources
  • Advancements in power distribution and cooling technologies
  • Adoption of cloud and edge computing
  • Increasing emphasis on sustainability and energy efficiency

Challenges and Restraints in Data Center Power Market

  • High capital investment in power infrastructure
  • Environmental regulations regarding energy consumption
  • Skilled labor shortage for deployment and maintenance
  • Fluctuations in raw material prices

Emerging Trends in Data Center Power Market

  • Adoption of artificial intelligence (AI) for predictive maintenance
  • Integration of microgrids for enhanced power redundancy
  • Liquid cooling technologies for improved energy efficiency

Data Center Power Industry News

  • December 2023: Eaton introduced the Rack PDU G4, offering advanced security and flexibility in power distribution.
  • July 2023: ABB India unveiled the MegaFlex DPA UPS solution, featuring sustainability and compactness in data center power supply.

Leading Players in the Data Center Power Market Keyword

Data Center Power Market Segmentation

  • 1. Component
    • 1.1. Solution
    • 1.2. Service
  • 2. Application
    • 2.1. BFSI
    • 2.2. Colocation
    • 2.3. Energy
    • 2.4. Government
    • 2.5. Healthcare
    • 2.6. Manufacturing
    • 2.7. IT & telecom
    • 2.8. Others

Data Center Power Market Segmentation By Geography

  • 1. North America
    • 1.1. U.S.
    • 1.2. Canada
    • 1.3. Mexico
  • 2. Europe
    • 2.1. UK
    • 2.2. Germany
    • 2.3. France
    • 2.4. Spain
    • 2.5. Poland
    • 2.6. Benelux
    • 2.7. Rest of Europe
  • 3. Asia Pacific
    • 3.1. China
    • 3.2. India
    • 3.3. Japan
    • 3.4. Singapore
    • 3.5. Australia
    • 3.6. Rest of Asia Pacific
  • 4. South America
    • 4.1. Brazil
    • 4.2. Chile
    • 4.3. Peru
    • 4.4. Argentina
    • 4.5. Rest of South America
  • 5. MEA
    • 5.1. GCC
    • 5.2. South Africa
    • 5.3. Rest of MEA

Data Center Power Market Regional Share


Data Center Power Market REPORT HIGHLIGHTS

AspectsDetails
Study Period 2019-2033
Base Year 2024
Estimated Year 2025
Forecast Period2025-2033
Historical Period2019-2024
Growth RateCAGR of 7.5% from 2019-2033
Segmentation
    • By Component
      • Solution
      • Service
    • By Application
      • BFSI
      • Colocation
      • Energy
      • Government
      • Healthcare
      • Manufacturing
      • IT & telecom
      • Others
  • By Geography
    • North America
      • U.S.
      • Canada
      • Mexico
    • Europe
      • UK
      • Germany
      • France
      • Spain
      • Poland
      • Benelux
      • Rest of Europe
    • Asia Pacific
      • China
      • India
      • Japan
      • Singapore
      • Australia
      • Rest of Asia Pacific
    • South America
      • Brazil
      • Chile
      • Peru
      • Argentina
      • Rest of South America
    • MEA
      • GCC
      • South Africa
      • Rest of MEA


Table of Contents

  1. 1. Introduction
    • 1.1. Research Scope
    • 1.2. Market Segmentation
    • 1.3. Research Methodology
    • 1.4. Definitions and Assumptions
  2. 2. Executive Summary
    • 2.1. Introduction
  3. 3. Market Dynamics
    • 3.1. Introduction
      • 3.2. Market Drivers
        • 3.2.1 Rising power consumption for data centers globally
        • 3.2.2 Development of modular data centers
        • 3.2.3 Shift toward intelligent power managing solutions
        • 3.2.4 Increase usage of OTT content services
        • 3.2.5 Growing demand for high power rating solutions
      • 3.3. Market Restrains
        • 3.3.1. High initial investments
      • 3.4. Market Trends
        • 3.4.1. Increased Adoption of Cloud and Edge Computing
  4. 4. Market Factor Analysis
    • 4.1. Porters Five Forces
    • 4.2. Supply/Value Chain
    • 4.3. PESTEL analysis
    • 4.4. Market Entropy
    • 4.5. Patent/Trademark Analysis
  5. 5. Global Data Center Power Market Analysis, Insights and Forecast, 2019-2031
    • 5.1. Market Analysis, Insights and Forecast - by Component
      • 5.1.1. Solution
      • 5.1.2. Service
    • 5.2. Market Analysis, Insights and Forecast - by Application
      • 5.2.1. BFSI
      • 5.2.2. Colocation
      • 5.2.3. Energy
      • 5.2.4. Government
      • 5.2.5. Healthcare
      • 5.2.6. Manufacturing
      • 5.2.7. IT & telecom
      • 5.2.8. Others
    • 5.3. Market Analysis, Insights and Forecast - by Region
      • 5.3.1. North America
      • 5.3.2. Europe
      • 5.3.3. Asia Pacific
      • 5.3.4. South America
      • 5.3.5. MEA
  6. 6. North America Data Center Power Market Analysis, Insights and Forecast, 2019-2031
    • 6.1. Market Analysis, Insights and Forecast - by Component
      • 6.1.1. Solution
      • 6.1.2. Service
    • 6.2. Market Analysis, Insights and Forecast - by Application
      • 6.2.1. BFSI
      • 6.2.2. Colocation
      • 6.2.3. Energy
      • 6.2.4. Government
      • 6.2.5. Healthcare
      • 6.2.6. Manufacturing
      • 6.2.7. IT & telecom
      • 6.2.8. Others
  7. 7. Europe Data Center Power Market Analysis, Insights and Forecast, 2019-2031
    • 7.1. Market Analysis, Insights and Forecast - by Component
      • 7.1.1. Solution
      • 7.1.2. Service
    • 7.2. Market Analysis, Insights and Forecast - by Application
      • 7.2.1. BFSI
      • 7.2.2. Colocation
      • 7.2.3. Energy
      • 7.2.4. Government
      • 7.2.5. Healthcare
      • 7.2.6. Manufacturing
      • 7.2.7. IT & telecom
      • 7.2.8. Others
  8. 8. Asia Pacific Data Center Power Market Analysis, Insights and Forecast, 2019-2031
    • 8.1. Market Analysis, Insights and Forecast - by Component
      • 8.1.1. Solution
      • 8.1.2. Service
    • 8.2. Market Analysis, Insights and Forecast - by Application
      • 8.2.1. BFSI
      • 8.2.2. Colocation
      • 8.2.3. Energy
      • 8.2.4. Government
      • 8.2.5. Healthcare
      • 8.2.6. Manufacturing
      • 8.2.7. IT & telecom
      • 8.2.8. Others
  9. 9. South America Data Center Power Market Analysis, Insights and Forecast, 2019-2031
    • 9.1. Market Analysis, Insights and Forecast - by Component
      • 9.1.1. Solution
      • 9.1.2. Service
    • 9.2. Market Analysis, Insights and Forecast - by Application
      • 9.2.1. BFSI
      • 9.2.2. Colocation
      • 9.2.3. Energy
      • 9.2.4. Government
      • 9.2.5. Healthcare
      • 9.2.6. Manufacturing
      • 9.2.7. IT & telecom
      • 9.2.8. Others
  10. 10. MEA Data Center Power Market Analysis, Insights and Forecast, 2019-2031
    • 10.1. Market Analysis, Insights and Forecast - by Component
      • 10.1.1. Solution
      • 10.1.2. Service
    • 10.2. Market Analysis, Insights and Forecast - by Application
      • 10.2.1. BFSI
      • 10.2.2. Colocation
      • 10.2.3. Energy
      • 10.2.4. Government
      • 10.2.5. Healthcare
      • 10.2.6. Manufacturing
      • 10.2.7. IT & telecom
      • 10.2.8. Others
  11. 11. Competitive Analysis
    • 11.1. Global Market Share Analysis 2024
      • 11.2. Company Profiles
        • 11.2.1 ABB
          • 11.2.1.1. Overview
          • 11.2.1.2. Products
          • 11.2.1.3. SWOT Analysis
          • 11.2.1.4. Recent Developments
          • 11.2.1.5. Financials (Based on Availability)
        • 11.2.2 Active Power
          • 11.2.2.1. Overview
          • 11.2.2.2. Products
          • 11.2.2.3. SWOT Analysis
          • 11.2.2.4. Recent Developments
          • 11.2.2.5. Financials (Based on Availability)
        • 11.2.3 Cummins
          • 11.2.3.1. Overview
          • 11.2.3.2. Products
          • 11.2.3.3. SWOT Analysis
          • 11.2.3.4. Recent Developments
          • 11.2.3.5. Financials (Based on Availability)
        • 11.2.4 Hewlett Packard Company
          • 11.2.4.1. Overview
          • 11.2.4.2. Products
          • 11.2.4.3. SWOT Analysis
          • 11.2.4.4. Recent Developments
          • 11.2.4.5. Financials (Based on Availability)
        • 11.2.5 Eaton Corporation
          • 11.2.5.1. Overview
          • 11.2.5.2. Products
          • 11.2.5.3. SWOT Analysis
          • 11.2.5.4. Recent Developments
          • 11.2.5.5. Financials (Based on Availability)
        • 11.2.6 Caterpillar
          • 11.2.6.1. Overview
          • 11.2.6.2. Products
          • 11.2.6.3. SWOT Analysis
          • 11.2.6.4. Recent Developments
          • 11.2.6.5. Financials (Based on Availability)
        • 11.2.7 Vertiv
          • 11.2.7.1. Overview
          • 11.2.7.2. Products
          • 11.2.7.3. SWOT Analysis
          • 11.2.7.4. Recent Developments
          • 11.2.7.5. Financials (Based on Availability)
        • 11.2.8 Legrand
          • 11.2.8.1. Overview
          • 11.2.8.2. Products
          • 11.2.8.3. SWOT Analysis
          • 11.2.8.4. Recent Developments
          • 11.2.8.5. Financials (Based on Availability)
        • 11.2.9 Huawei
          • 11.2.9.1. Overview
          • 11.2.9.2. Products
          • 11.2.9.3. SWOT Analysis
          • 11.2.9.4. Recent Developments
          • 11.2.9.5. Financials (Based on Availability)

List of Figures

  1. Figure 1: Global Data Center Power Market Revenue Breakdown (Billion, %) by Region 2024 & 2032
  2. Figure 2: Global Data Center Power Market Volume Breakdown (units, %) by Region 2024 & 2032
  3. Figure 3: North America Data Center Power Market Revenue (Billion), by Component 2024 & 2032
  4. Figure 4: North America Data Center Power Market Volume (units), by Component 2024 & 2032
  5. Figure 5: North America Data Center Power Market Revenue Share (%), by Component 2024 & 2032
  6. Figure 6: North America Data Center Power Market Volume Share (%), by Component 2024 & 2032
  7. Figure 7: North America Data Center Power Market Revenue (Billion), by Application 2024 & 2032
  8. Figure 8: North America Data Center Power Market Volume (units), by Application 2024 & 2032
  9. Figure 9: North America Data Center Power Market Revenue Share (%), by Application 2024 & 2032
  10. Figure 10: North America Data Center Power Market Volume Share (%), by Application 2024 & 2032
  11. Figure 11: North America Data Center Power Market Revenue (Billion), by Country 2024 & 2032
  12. Figure 12: North America Data Center Power Market Volume (units), by Country 2024 & 2032
  13. Figure 13: North America Data Center Power Market Revenue Share (%), by Country 2024 & 2032
  14. Figure 14: North America Data Center Power Market Volume Share (%), by Country 2024 & 2032
  15. Figure 15: Europe Data Center Power Market Revenue (Billion), by Component 2024 & 2032
  16. Figure 16: Europe Data Center Power Market Volume (units), by Component 2024 & 2032
  17. Figure 17: Europe Data Center Power Market Revenue Share (%), by Component 2024 & 2032
  18. Figure 18: Europe Data Center Power Market Volume Share (%), by Component 2024 & 2032
  19. Figure 19: Europe Data Center Power Market Revenue (Billion), by Application 2024 & 2032
  20. Figure 20: Europe Data Center Power Market Volume (units), by Application 2024 & 2032
  21. Figure 21: Europe Data Center Power Market Revenue Share (%), by Application 2024 & 2032
  22. Figure 22: Europe Data Center Power Market Volume Share (%), by Application 2024 & 2032
  23. Figure 23: Europe Data Center Power Market Revenue (Billion), by Country 2024 & 2032
  24. Figure 24: Europe Data Center Power Market Volume (units), by Country 2024 & 2032
  25. Figure 25: Europe Data Center Power Market Revenue Share (%), by Country 2024 & 2032
  26. Figure 26: Europe Data Center Power Market Volume Share (%), by Country 2024 & 2032
  27. Figure 27: Asia Pacific Data Center Power Market Revenue (Billion), by Component 2024 & 2032
  28. Figure 28: Asia Pacific Data Center Power Market Volume (units), by Component 2024 & 2032
  29. Figure 29: Asia Pacific Data Center Power Market Revenue Share (%), by Component 2024 & 2032
  30. Figure 30: Asia Pacific Data Center Power Market Volume Share (%), by Component 2024 & 2032
  31. Figure 31: Asia Pacific Data Center Power Market Revenue (Billion), by Application 2024 & 2032
  32. Figure 32: Asia Pacific Data Center Power Market Volume (units), by Application 2024 & 2032
  33. Figure 33: Asia Pacific Data Center Power Market Revenue Share (%), by Application 2024 & 2032
  34. Figure 34: Asia Pacific Data Center Power Market Volume Share (%), by Application 2024 & 2032
  35. Figure 35: Asia Pacific Data Center Power Market Revenue (Billion), by Country 2024 & 2032
  36. Figure 36: Asia Pacific Data Center Power Market Volume (units), by Country 2024 & 2032
  37. Figure 37: Asia Pacific Data Center Power Market Revenue Share (%), by Country 2024 & 2032
  38. Figure 38: Asia Pacific Data Center Power Market Volume Share (%), by Country 2024 & 2032
  39. Figure 39: South America Data Center Power Market Revenue (Billion), by Component 2024 & 2032
  40. Figure 40: South America Data Center Power Market Volume (units), by Component 2024 & 2032
  41. Figure 41: South America Data Center Power Market Revenue Share (%), by Component 2024 & 2032
  42. Figure 42: South America Data Center Power Market Volume Share (%), by Component 2024 & 2032
  43. Figure 43: South America Data Center Power Market Revenue (Billion), by Application 2024 & 2032
  44. Figure 44: South America Data Center Power Market Volume (units), by Application 2024 & 2032
  45. Figure 45: South America Data Center Power Market Revenue Share (%), by Application 2024 & 2032
  46. Figure 46: South America Data Center Power Market Volume Share (%), by Application 2024 & 2032
  47. Figure 47: South America Data Center Power Market Revenue (Billion), by Country 2024 & 2032
  48. Figure 48: South America Data Center Power Market Volume (units), by Country 2024 & 2032
  49. Figure 49: South America Data Center Power Market Revenue Share (%), by Country 2024 & 2032
  50. Figure 50: South America Data Center Power Market Volume Share (%), by Country 2024 & 2032
  51. Figure 51: MEA Data Center Power Market Revenue (Billion), by Component 2024 & 2032
  52. Figure 52: MEA Data Center Power Market Volume (units), by Component 2024 & 2032
  53. Figure 53: MEA Data Center Power Market Revenue Share (%), by Component 2024 & 2032
  54. Figure 54: MEA Data Center Power Market Volume Share (%), by Component 2024 & 2032
  55. Figure 55: MEA Data Center Power Market Revenue (Billion), by Application 2024 & 2032
  56. Figure 56: MEA Data Center Power Market Volume (units), by Application 2024 & 2032
  57. Figure 57: MEA Data Center Power Market Revenue Share (%), by Application 2024 & 2032
  58. Figure 58: MEA Data Center Power Market Volume Share (%), by Application 2024 & 2032
  59. Figure 59: MEA Data Center Power Market Revenue (Billion), by Country 2024 & 2032
  60. Figure 60: MEA Data Center Power Market Volume (units), by Country 2024 & 2032
  61. Figure 61: MEA Data Center Power Market Revenue Share (%), by Country 2024 & 2032
  62. Figure 62: MEA Data Center Power Market Volume Share (%), by Country 2024 & 2032

List of Tables

  1. Table 1: Global Data Center Power Market Revenue Billion Forecast, by Region 2019 & 2032
  2. Table 2: Global Data Center Power Market Volume units Forecast, by Region 2019 & 2032
  3. Table 3: Global Data Center Power Market Revenue Billion Forecast, by Component 2019 & 2032
  4. Table 4: Global Data Center Power Market Volume units Forecast, by Component 2019 & 2032
  5. Table 5: Global Data Center Power Market Revenue Billion Forecast, by Application 2019 & 2032
  6. Table 6: Global Data Center Power Market Volume units Forecast, by Application 2019 & 2032
  7. Table 7: Global Data Center Power Market Revenue Billion Forecast, by Region 2019 & 2032
  8. Table 8: Global Data Center Power Market Volume units Forecast, by Region 2019 & 2032
  9. Table 9: Global Data Center Power Market Revenue Billion Forecast, by Component 2019 & 2032
  10. Table 10: Global Data Center Power Market Volume units Forecast, by Component 2019 & 2032
  11. Table 11: Global Data Center Power Market Revenue Billion Forecast, by Application 2019 & 2032
  12. Table 12: Global Data Center Power Market Volume units Forecast, by Application 2019 & 2032
  13. Table 13: Global Data Center Power Market Revenue Billion Forecast, by Country 2019 & 2032
  14. Table 14: Global Data Center Power Market Volume units Forecast, by Country 2019 & 2032
  15. Table 15: U.S. Data Center Power Market Revenue (Billion) Forecast, by Application 2019 & 2032
  16. Table 16: U.S. Data Center Power Market Volume (units) Forecast, by Application 2019 & 2032
  17. Table 17: Canada Data Center Power Market Revenue (Billion) Forecast, by Application 2019 & 2032
  18. Table 18: Canada Data Center Power Market Volume (units) Forecast, by Application 2019 & 2032
  19. Table 19: Mexico Data Center Power Market Revenue (Billion) Forecast, by Application 2019 & 2032
  20. Table 20: Mexico Data Center Power Market Volume (units) Forecast, by Application 2019 & 2032
  21. Table 21: Global Data Center Power Market Revenue Billion Forecast, by Component 2019 & 2032
  22. Table 22: Global Data Center Power Market Volume units Forecast, by Component 2019 & 2032
  23. Table 23: Global Data Center Power Market Revenue Billion Forecast, by Application 2019 & 2032
  24. Table 24: Global Data Center Power Market Volume units Forecast, by Application 2019 & 2032
  25. Table 25: Global Data Center Power Market Revenue Billion Forecast, by Country 2019 & 2032
  26. Table 26: Global Data Center Power Market Volume units Forecast, by Country 2019 & 2032
  27. Table 27: UK Data Center Power Market Revenue (Billion) Forecast, by Application 2019 & 2032
  28. Table 28: UK Data Center Power Market Volume (units) Forecast, by Application 2019 & 2032
  29. Table 29: Germany Data Center Power Market Revenue (Billion) Forecast, by Application 2019 & 2032
  30. Table 30: Germany Data Center Power Market Volume (units) Forecast, by Application 2019 & 2032
  31. Table 31: France Data Center Power Market Revenue (Billion) Forecast, by Application 2019 & 2032
  32. Table 32: France Data Center Power Market Volume (units) Forecast, by Application 2019 & 2032
  33. Table 33: Spain Data Center Power Market Revenue (Billion) Forecast, by Application 2019 & 2032
  34. Table 34: Spain Data Center Power Market Volume (units) Forecast, by Application 2019 & 2032
  35. Table 35: Poland Data Center Power Market Revenue (Billion) Forecast, by Application 2019 & 2032
  36. Table 36: Poland Data Center Power Market Volume (units) Forecast, by Application 2019 & 2032
  37. Table 37: Benelux Data Center Power Market Revenue (Billion) Forecast, by Application 2019 & 2032
  38. Table 38: Benelux Data Center Power Market Volume (units) Forecast, by Application 2019 & 2032
  39. Table 39: Rest of Europe Data Center Power Market Revenue (Billion) Forecast, by Application 2019 & 2032
  40. Table 40: Rest of Europe Data Center Power Market Volume (units) Forecast, by Application 2019 & 2032
  41. Table 41: Global Data Center Power Market Revenue Billion Forecast, by Component 2019 & 2032
  42. Table 42: Global Data Center Power Market Volume units Forecast, by Component 2019 & 2032
  43. Table 43: Global Data Center Power Market Revenue Billion Forecast, by Application 2019 & 2032
  44. Table 44: Global Data Center Power Market Volume units Forecast, by Application 2019 & 2032
  45. Table 45: Global Data Center Power Market Revenue Billion Forecast, by Country 2019 & 2032
  46. Table 46: Global Data Center Power Market Volume units Forecast, by Country 2019 & 2032
  47. Table 47: China Data Center Power Market Revenue (Billion) Forecast, by Application 2019 & 2032
  48. Table 48: China Data Center Power Market Volume (units) Forecast, by Application 2019 & 2032
  49. Table 49: India Data Center Power Market Revenue (Billion) Forecast, by Application 2019 & 2032
  50. Table 50: India Data Center Power Market Volume (units) Forecast, by Application 2019 & 2032
  51. Table 51: Japan Data Center Power Market Revenue (Billion) Forecast, by Application 2019 & 2032
  52. Table 52: Japan Data Center Power Market Volume (units) Forecast, by Application 2019 & 2032
  53. Table 53: Singapore Data Center Power Market Revenue (Billion) Forecast, by Application 2019 & 2032
  54. Table 54: Singapore Data Center Power Market Volume (units) Forecast, by Application 2019 & 2032
  55. Table 55: Australia Data Center Power Market Revenue (Billion) Forecast, by Application 2019 & 2032
  56. Table 56: Australia Data Center Power Market Volume (units) Forecast, by Application 2019 & 2032
  57. Table 57: Rest of Asia Pacific Data Center Power Market Revenue (Billion) Forecast, by Application 2019 & 2032
  58. Table 58: Rest of Asia Pacific Data Center Power Market Volume (units) Forecast, by Application 2019 & 2032
  59. Table 59: Global Data Center Power Market Revenue Billion Forecast, by Component 2019 & 2032
  60. Table 60: Global Data Center Power Market Volume units Forecast, by Component 2019 & 2032
  61. Table 61: Global Data Center Power Market Revenue Billion Forecast, by Application 2019 & 2032
  62. Table 62: Global Data Center Power Market Volume units Forecast, by Application 2019 & 2032
  63. Table 63: Global Data Center Power Market Revenue Billion Forecast, by Country 2019 & 2032
  64. Table 64: Global Data Center Power Market Volume units Forecast, by Country 2019 & 2032
  65. Table 65: Brazil Data Center Power Market Revenue (Billion) Forecast, by Application 2019 & 2032
  66. Table 66: Brazil Data Center Power Market Volume (units) Forecast, by Application 2019 & 2032
  67. Table 67: Chile Data Center Power Market Revenue (Billion) Forecast, by Application 2019 & 2032
  68. Table 68: Chile Data Center Power Market Volume (units) Forecast, by Application 2019 & 2032
  69. Table 69: Peru Data Center Power Market Revenue (Billion) Forecast, by Application 2019 & 2032
  70. Table 70: Peru Data Center Power Market Volume (units) Forecast, by Application 2019 & 2032
  71. Table 71: Argentina Data Center Power Market Revenue (Billion) Forecast, by Application 2019 & 2032
  72. Table 72: Argentina Data Center Power Market Volume (units) Forecast, by Application 2019 & 2032
  73. Table 73: Rest of South America Data Center Power Market Revenue (Billion) Forecast, by Application 2019 & 2032
  74. Table 74: Rest of South America Data Center Power Market Volume (units) Forecast, by Application 2019 & 2032
  75. Table 75: Global Data Center Power Market Revenue Billion Forecast, by Component 2019 & 2032
  76. Table 76: Global Data Center Power Market Volume units Forecast, by Component 2019 & 2032
  77. Table 77: Global Data Center Power Market Revenue Billion Forecast, by Application 2019 & 2032
  78. Table 78: Global Data Center Power Market Volume units Forecast, by Application 2019 & 2032
  79. Table 79: Global Data Center Power Market Revenue Billion Forecast, by Country 2019 & 2032
  80. Table 80: Global Data Center Power Market Volume units Forecast, by Country 2019 & 2032
  81. Table 81: GCC Data Center Power Market Revenue (Billion) Forecast, by Application 2019 & 2032
  82. Table 82: GCC Data Center Power Market Volume (units) Forecast, by Application 2019 & 2032
  83. Table 83: South Africa Data Center Power Market Revenue (Billion) Forecast, by Application 2019 & 2032
  84. Table 84: South Africa Data Center Power Market Volume (units) Forecast, by Application 2019 & 2032
  85. Table 85: Rest of MEA Data Center Power Market Revenue (Billion) Forecast, by Application 2019 & 2032
  86. Table 86: Rest of MEA Data Center Power Market Volume (units) Forecast, by Application 2019 & 2032


STEP 1 - Identification of Relevant Samples Size from Population Database

Step Chart
bar chart
method chart

STEP 2 - Approaches for Defining Global Market Size (Value, Volume* & Price*)

approach chart
Top-down and bottom-up approaches are used to validate the global market size and estimate the market size for manufactures, regional segemnts, product and application.

Note* : In applicable scenarios

STEP 3 - Data Sources

Primary Research

  • Web Analytics
  • Survey Reports
  • Research Institute
  • Latest Research Reports
  • Opinion Leaders

Secondary Research

  • Annual Reports
  • White Paper
  • Latest Press Release
  • Industry Association
  • Paid Database
  • Investor Presentations
approach chart

STEP 4 - Data Triangulation

Involves using different sources of information in order to increase the validity of a study

These sources are likely to be stakeholders in a program - participants, other researchers, program staff, other community members, and so on.

Then we put all data in single framework & apply various statistical tools to find out the dynamic on the market.

During the analysis stage, feedback from the stakeholder groups would be compared to determine areas of agreement as well as areas of divergence

Additionally after gathering mix and scattered data from wide range of sources, data is triangull- ated and correlated to come up with estimated figures which are further validated through primary mediums, or industry experts, opinion leader.

Frequently Asked Questions

1. What is the projected Compound Annual Growth Rate (CAGR) of the Data Center Power Market?

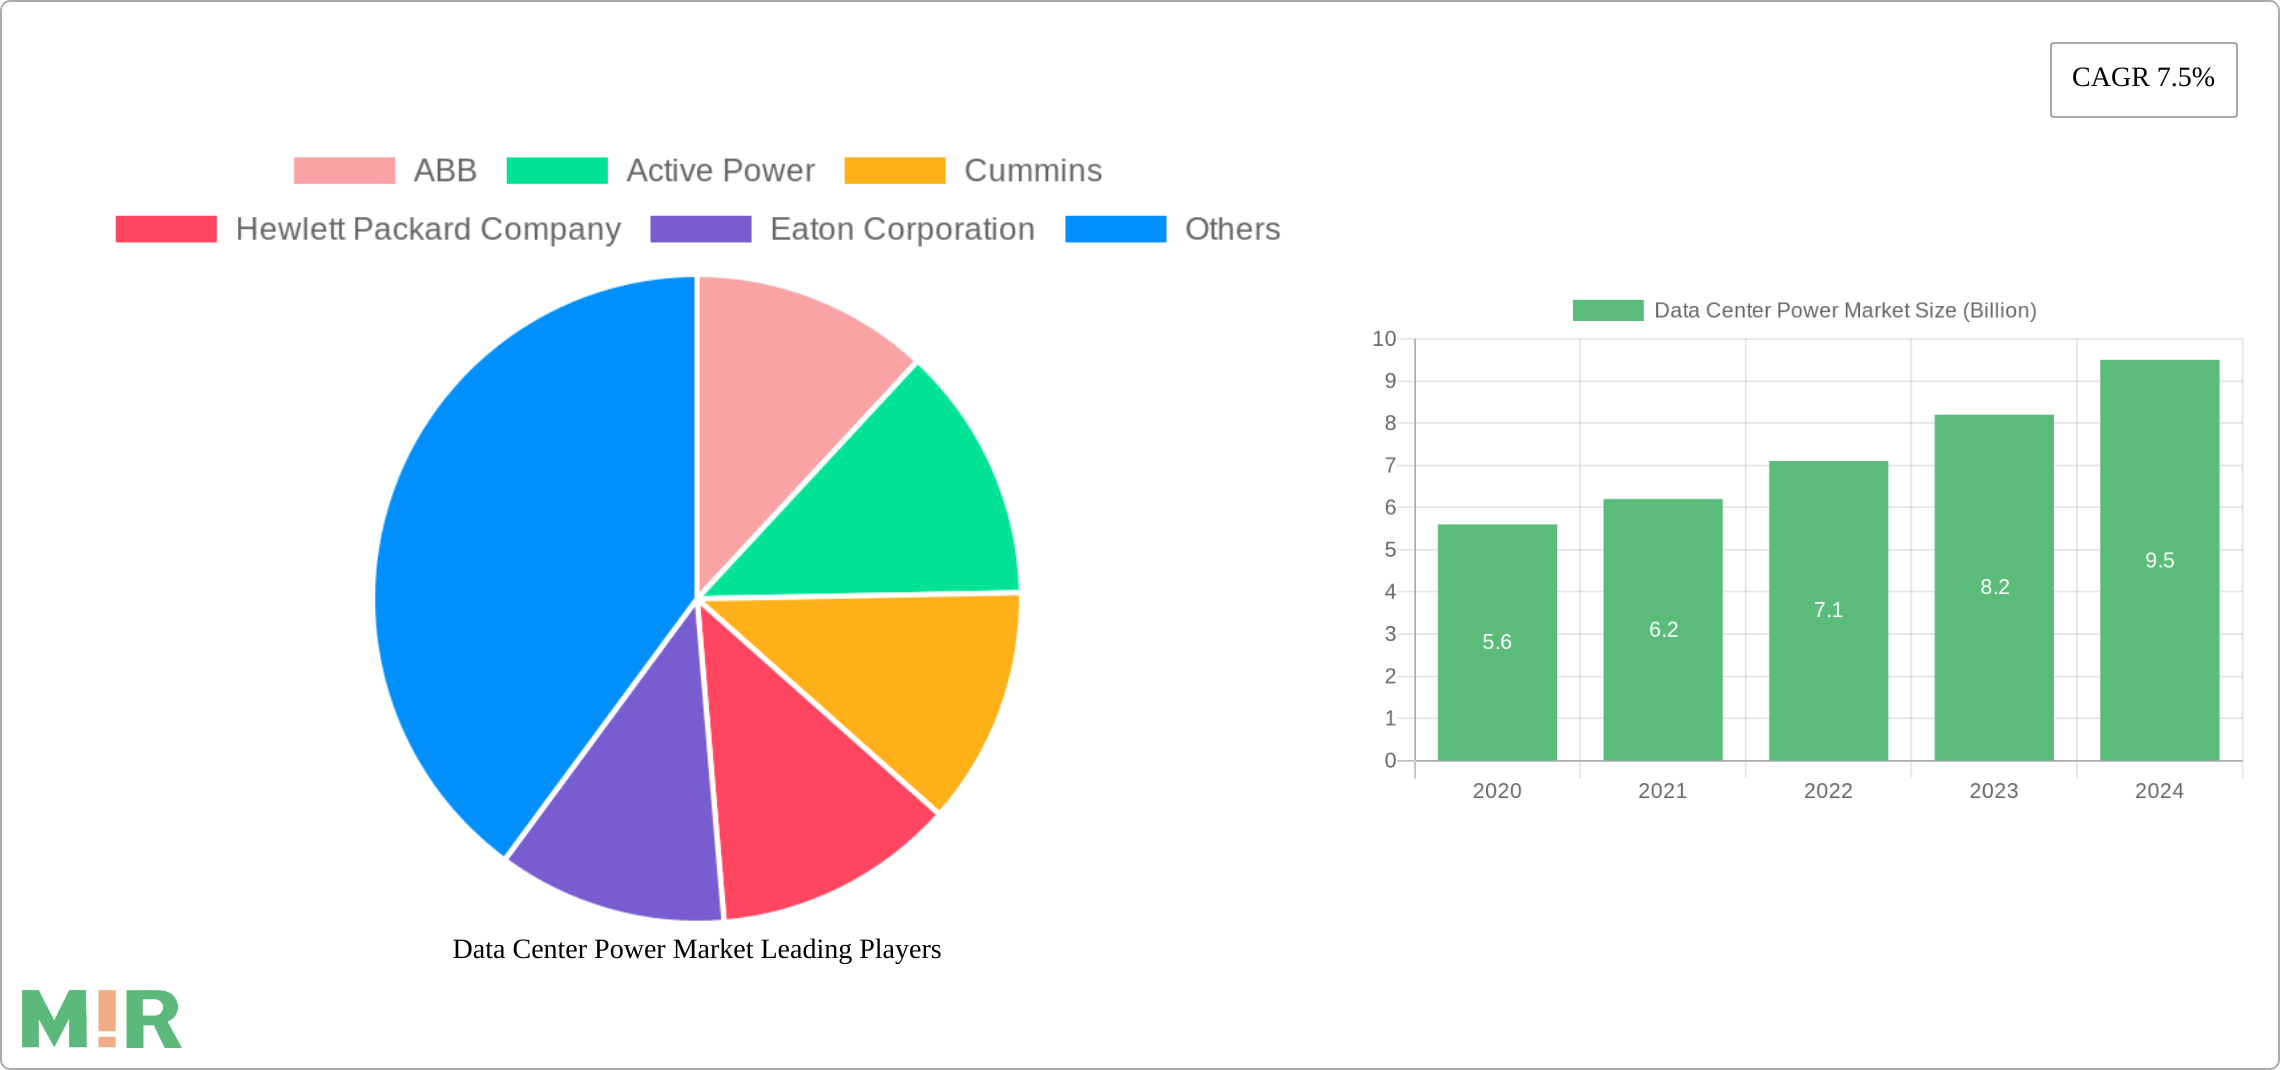
The projected CAGR is approximately 7.5%.

2. Which companies are prominent players in the Data Center Power Market?

Key companies in the market include ABB, Active Power, Cummins, Hewlett Packard Company, Eaton Corporation, Caterpillar, Vertiv, Legrand, Huawei.

3. What are the main segments of the Data Center Power Market?

The market segments include Component, Application.

4. Can you provide details about the market size?

The market size is estimated to be USD 12.6 Billion as of 2022.

5. What are some drivers contributing to market growth?

Rising power consumption for data centers globally. Development of modular data centers. Shift toward intelligent power managing solutions. Increase usage of OTT content services. Growing demand for high power rating solutions.

6. What are the notable trends driving market growth?

Increased Adoption of Cloud and Edge Computing: The growth of cloud computing and the proliferation of edge devices are driving demand for data centers. leading to increased investments in power infrastructure..

7. Are there any restraints impacting market growth?

High initial investments.

8. Can you provide examples of recent developments in the market?

In December 2023, Eaton introduced its latest innovation, the Rack PDU G4, marking the fourth generation of this product line. Engineered to elevate security, business continuity, and operational flexibility in data centers, the Rack PDU G4 showcases cutting-edge attributes such as combined C39 outlets, a high retention system, and a locking mechanism for ensuring secure power cord connections.

9. What pricing options are available for accessing the report?

Pricing options include single-user, multi-user, and enterprise licenses priced at USD 4,850, USD 5,350, and USD 8,350 respectively.

10. Is the market size provided in terms of value or volume?

The market size is provided in terms of value, measured in Billion and volume, measured in units.

11. Are there any specific market keywords associated with the report?

Yes, the market keyword associated with the report is "Data Center Power Market," which aids in identifying and referencing the specific market segment covered.

12. How do I determine which pricing option suits my needs best?

The pricing options vary based on user requirements and access needs. Individual users may opt for single-user licenses, while businesses requiring broader access may choose multi-user or enterprise licenses for cost-effective access to the report.

13. Are there any additional resources or data provided in the Data Center Power Market report?

While the report offers comprehensive insights, it's advisable to review the specific contents or supplementary materials provided to ascertain if additional resources or data are available.

14. How can I stay updated on further developments or reports in the Data Center Power Market?

To stay informed about further developments, trends, and reports in the Data Center Power Market, consider subscribing to industry newsletters, following relevant companies and organizations, or regularly checking reputable industry news sources and publications.

Related Reports

See the similar reports

Discover the Latest Market Insight Reports

Access in-depth insights on industries, companies, trends, and global markets. Our expertly curated reports provide the most relevant data and analysis in a condensed, easy-to-read format.

shop image 1

About Market Insights Report

Market Insights Reports offers comprehensive market research reports and analysis, giving businesses important information about their clients, rivals, and sector to help them make well-informed decisions on operations, marketing, and business strategy. We offer a variety of services in addition to market research, data analysis, and strategy planning. In order to find opportunities and learn more about our competitors and the industry at large, we employ competitive analysis. To identify areas for development, we also evaluate our performance against that of our rivals. We can determine the places at which we can offer our clients the most value by performing value chain analysis.

Additionally, clients receive a thorough overview of their industry business environment. We can find trends that help us forecast future possibilities and threats by examining global macroeconomic dynamics and consumer behavior patterns. By analyzing their features and advantages, contrasting them with comparable items on the market, and evaluating both their quantitative and qualitative performance, we comprehensively evaluate our clients' products. This allows us to assist customers in determining how their goods compare to those of their rivals and in creating successful marketing plans. Our group has been successful in gaining a thorough grasp of our clients' requirements and offering them creative solutions. We currently provide services to more than 50 nations in Europe, the Middle East, Africa, Latin America, Asia Pacific, and North America. Because of our global reach, we have been able to establish trusting bonds with our partners and clients in various nations, improving customer service and forging a more cohesive worldwide presence.

We use cookies to enhance your experience.

By clicking "Accept All", you consent to the use of all cookies.

Customize your preferences or read our Cookie Policy.