
.jpg&w=3840&q=100)
Market
Insights
Reports delivered globally, covering a wide range of industries and sectors.
Clients who trust our expertise and rely on our insights for business decisions.
Managed Reports, ensuring seamless updates and premium service.
Satisfied Customers, committed to delivering exceptional value and quality.
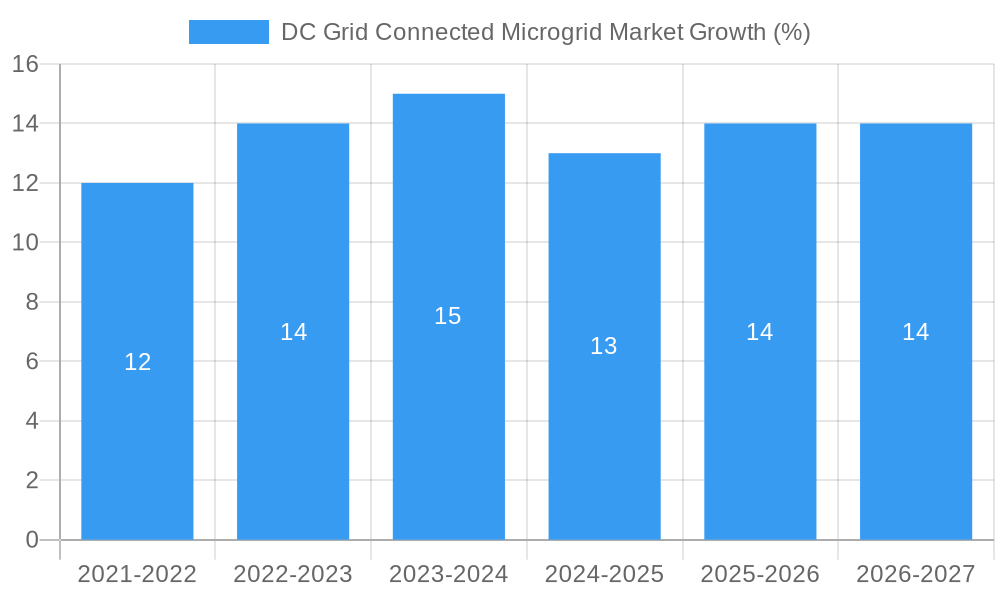
DC Grid Connected Microgrid Market Future-proof Strategies: Trends, Competitor Dynamics, and Opportunities 2025-2033
DC Grid Connected Microgrid Market by Power Source (Diesel Generators, Natural Gas, Solar PV, CHP, Others), by Storage Device (Lithium-ion, Lead Acid, Flow Battery, Flywheels, Others), by Application (Healthcare, Educational Institutes, Military, Utility, Industrial/ Commercial, Remote, Others), by North America (U.S., Canada, Mexico), by Europe (Germany, France, UK, Russia, Spain, Italy, Denmark), by Asia Pacific (China, Japan, South Korea, India, Australia, Malaysia, Indonesia), by Middle East and Africa (Saudi Arabia, UAE, South Africa, Iran, Nigeria), by Latin America (Brazil, Argentina, Chile) Forecast 2025-2033
DC Grid Connected Microgrid Market Future-proof Strategies: Trends, Competitor Dynamics, and Opportunities 2025-2033
Key Insights
The size of the DC Grid Connected Microgrid Market was valued at USD 3.9 Billion in 2023 and is projected to reach USD 14.72 Billion by 2032, with an expected CAGR of 20.9% during the forecast period. The DC Grid Connected Microgrid Market emphasizes the incorporation of microgrids utilizing direct current (DC) systems, frequently integrating renewable energy resources like solar panels, wind turbines, and energy storage options. These microgrids are intended to function independently or alongside the primary power grid, allowing for localized energy generation, storage, and distribution to improve efficiency, reliability, and sustainability. DC grids provide benefits compared to conventional alternating current (AC) systems, such as lowered energy losses, easier integration with renewable energy sources, and enhanced performance in settings including off-grid areas, distant communities, and industrial sites. The market is propelled by the rising demand for energy autonomy, the embrace of clean energy alternatives, and the necessity for robust energy infrastructure capable of enduring disruptions. Moreover, improvements in energy storage systems and power electronics are driving the expansion of the DC Grid Connected Microgrid Market. With the increasing need for decentralized, dependable, and sustainable energy systems, especially in developing nations, the market is poised for substantial expansion, providing affordable and effective energy solutions throughout different sectors.

DC Grid Connected Microgrid Market Concentration & Characteristics
The DC Grid Connected Microgrid Market exhibits a moderately fragmented competitive landscape with several key players holding a significant market share. The market is characterized by continuous innovation, with companies investing heavily in R&D to develop advanced DC microgrid solutions. Regulatory frameworks and policies play a crucial role in shaping the market, fostering innovation and sustainability. Product substitution from traditional AC grids is minimal, as DC microgrids offer unique advantages for distributed energy systems. End-user concentration is diverse, with industries, utilities, and remote communities as the primary consumers. M&A activity is prevalent as companies seek to expand their portfolios and gain technological expertise.
DC Grid Connected Microgrid Market Trends
- Increasing Adoption of Renewable Energy Sources: DC microgrids facilitate the integration of solar PV and other renewable energy sources, enabling the shift towards clean and sustainable energy.
- Decentralized Energy Generation: The rise of distributed generation through microgrids empowers consumers to produce their electricity, reducing reliance on centralized power plants.
- Resiliency and Reliability Enhancement: DC microgrids enhance the resilience and reliability of power systems, providing backup power during outages and protecting against cyber threats.
- Advanced Control and Optimization Systems: The adoption of sophisticated control systems optimizes DC microgrid performance, improving energy efficiency and reducing costs.
- Integration with Energy Storage Systems: The integration of batteries and other energy storage technologies enables load balancing, peak shaving, and frequency regulation within DC microgrids.
Key Region or Country & Segment to Dominate the Market
Dominant Region:
- Asia Pacific: This region is witnessing rapid urbanization and industrialization, driving the demand for reliable and sustainable energy solutions. Governments in countries like China, Japan, and India are actively promoting the adoption of DC microgrids.
Dominant Segment:
- Solar PV: The solar PV segment is expected to dominate the DC Grid Connected Microgrid Market due to the increasing deployment of solar PV systems and the cost-effectiveness of DC power distribution for solar applications.
DC Grid Connected Microgrid Market Product Insights Report Coverage & Deliverables
- Market size and growth analysis
- Market share and competitive analysis
- Key market trends and drivers
- Regional market insights
- Product segmentation and forecast
- Competitive landscape and key players
- SWOT analysis and market recommendations
DC Grid Connected Microgrid Market Analysis
Market Size and Growth: The DC Grid Connected Microgrid Market is projected to grow from 3.9 Billion in 2023 to 22.9 Billion by 2032, exhibiting a CAGR of 20.9%.
Market Share and Competitive Analysis: ABB and Schneider Electric SE hold significant market shares, while AEG International, Eaton, and Nextek Power Systems are other notable players.
Key Market Trends: Growing demand for microgrids, increasing adoption of renewable energy, and technological advancements are key factors driving market growth.
DC Grid Connected Microgrid Market Regional Insights
North America:
- Significant investment in renewable energy and distributed generation
- Focus on grid resilience and reliability
- Government incentives and policies support microgrid adoption
Europe:
- Strong regulatory support for renewable energy and distributed energy systems
- High demand for microgrids in remote areas and islands
- Advanced research and development in DC microgrid technologies
Asia Pacific:
- Rapid urbanization and industrialization drive microgrid demand
- Growing adoption of solar PV and energy storage systems
- Government initiatives promote distributed energy and grid resilience
Middle East and Africa:
- Increasing demand for microgrids in remote and off-grid areas
- Investments in renewable energy projects
- Limited infrastructure presents growth challenges
Driving Forces: What's Propelling the DC Grid Connected Microgrid Market
- Rising demand for reliable and sustainable energy solutions
- Growing concerns over climate change and energy security
- Technological advancements in DC power distribution and control systems
- Government incentives and policies supporting microgrid adoption
- Increasing deployment of renewable energy sources and distributed generation
Challenges and Restraints in DC Grid Connected Microgrid Market
- Initial investment costs and project complexity
- Interoperability and compatibility issues between different DC microgrid components
- Lack of standardization and certification guidelines
- Limited grid integration capabilities in some cases
Leading Players in DC Grid Connected Microgrid Market
- ABB
- AEG International
- ARDA Power
- Eaton
- Nextek Power Systems
- Schneider Electric SE
- SolarWorX
- Schaltbau Group
- Stellar Energy
- Sumitomo Electric Industries, Ltd
DC Grid Connected Microgrid Market Segmentation
- 1. Power Source
- 1.1. Diesel Generators
- 1.2. Natural Gas
- 1.3. Solar PV
- 1.4. CHP
- 1.5. Others
- 2. Storage Device
- 2.1. Lithium-ion
- 2.2. Lead Acid
- 2.3. Flow Battery
- 2.4. Flywheels
- 2.5. Others
- 3. Application
- 3.1. Healthcare
- 3.2. Educational Institutes
- 3.3. Military
- 3.4. Utility
- 3.5. Industrial/ Commercial
- 3.6. Remote
- 3.7. Others
DC Grid Connected Microgrid Market Segmentation By Geography
- 1. North America
- 1.1. U.S.
- 1.2. Canada
- 1.3. Mexico
- 2. Europe
- 2.1. Germany
- 2.2. France
- 2.3. UK
- 2.4. Russia
- 2.5. Spain
- 2.6. Italy
- 2.7. Denmark
- 3. Asia Pacific
- 3.1. China
- 3.2. Japan
- 3.3. South Korea
- 3.4. India
- 3.5. Australia
- 3.6. Malaysia
- 3.7. Indonesia
- 4. Middle East and Africa
- 4.1. Saudi Arabia
- 4.2. UAE
- 4.3. South Africa
- 4.4. Iran
- 4.5. Nigeria
- 5. Latin America
- 5.1. Brazil
- 5.2. Argentina
- 5.3. Chile

DC Grid Connected Microgrid Market REPORT HIGHLIGHTS
| Aspects | Details |
|---|---|
| Study Period | 2019-2033 |
| Base Year | 2024 |
| Estimated Year | 2025 |
| Forecast Period | 2025-2033 |
| Historical Period | 2019-2024 |
| Growth Rate | CAGR of 20.9% from 2019-2033 |
| Segmentation |
|
- 1. Introduction
- 1.1. Research Scope
- 1.2. Market Segmentation
- 1.3. Research Methodology
- 1.4. Definitions and Assumptions
- 2. Executive Summary
- 2.1. Introduction
- 3. Market Dynamics
- 3.1. Introduction
- 3.2. Market Drivers
- 3.2.1 Regulatory and compliance flexibility
- 3.2.2 Integration with energy storage solutions
- 3.2.3 Grid modernization and decentralization
- 3.3. Market Restrains
- 3.3.1. Grid integration challenges
- 3.4. Market Trends
- 4. Market Factor Analysis
- 4.1. Porters Five Forces
- 4.2. Supply/Value Chain
- 4.3. PESTEL analysis
- 4.4. Market Entropy
- 4.5. Patent/Trademark Analysis
- 5. Global DC Grid Connected Microgrid Market Analysis, Insights and Forecast, 2019-2031
- 5.1. Market Analysis, Insights and Forecast - by Power Source
- 5.1.1. Diesel Generators
- 5.1.2. Natural Gas
- 5.1.3. Solar PV
- 5.1.4. CHP
- 5.1.5. Others
- 5.2. Market Analysis, Insights and Forecast - by Storage Device
- 5.2.1. Lithium-ion
- 5.2.2. Lead Acid
- 5.2.3. Flow Battery
- 5.2.4. Flywheels
- 5.2.5. Others
- 5.3. Market Analysis, Insights and Forecast - by Application
- 5.3.1. Healthcare
- 5.3.2. Educational Institutes
- 5.3.3. Military
- 5.3.4. Utility
- 5.3.5. Industrial/ Commercial
- 5.3.6. Remote
- 5.3.7. Others
- 5.4. Market Analysis, Insights and Forecast - by Region
- 5.4.1. North America
- 5.4.2. Europe
- 5.4.3. Asia Pacific
- 5.4.4. Middle East and Africa
- 5.4.5. Latin America
- 5.1. Market Analysis, Insights and Forecast - by Power Source
- 6. North America DC Grid Connected Microgrid Market Analysis, Insights and Forecast, 2019-2031
- 6.1. Market Analysis, Insights and Forecast - by Power Source
- 6.1.1. Diesel Generators
- 6.1.2. Natural Gas
- 6.1.3. Solar PV
- 6.1.4. CHP
- 6.1.5. Others
- 6.2. Market Analysis, Insights and Forecast - by Storage Device
- 6.2.1. Lithium-ion
- 6.2.2. Lead Acid
- 6.2.3. Flow Battery
- 6.2.4. Flywheels
- 6.2.5. Others
- 6.3. Market Analysis, Insights and Forecast - by Application
- 6.3.1. Healthcare
- 6.3.2. Educational Institutes
- 6.3.3. Military
- 6.3.4. Utility
- 6.3.5. Industrial/ Commercial
- 6.3.6. Remote
- 6.3.7. Others
- 6.1. Market Analysis, Insights and Forecast - by Power Source
- 7. Europe DC Grid Connected Microgrid Market Analysis, Insights and Forecast, 2019-2031
- 7.1. Market Analysis, Insights and Forecast - by Power Source
- 7.1.1. Diesel Generators
- 7.1.2. Natural Gas
- 7.1.3. Solar PV
- 7.1.4. CHP
- 7.1.5. Others
- 7.2. Market Analysis, Insights and Forecast - by Storage Device
- 7.2.1. Lithium-ion
- 7.2.2. Lead Acid
- 7.2.3. Flow Battery
- 7.2.4. Flywheels
- 7.2.5. Others
- 7.3. Market Analysis, Insights and Forecast - by Application
- 7.3.1. Healthcare
- 7.3.2. Educational Institutes
- 7.3.3. Military
- 7.3.4. Utility
- 7.3.5. Industrial/ Commercial
- 7.3.6. Remote
- 7.3.7. Others
- 7.1. Market Analysis, Insights and Forecast - by Power Source
- 8. Asia Pacific DC Grid Connected Microgrid Market Analysis, Insights and Forecast, 2019-2031
- 8.1. Market Analysis, Insights and Forecast - by Power Source
- 8.1.1. Diesel Generators
- 8.1.2. Natural Gas
- 8.1.3. Solar PV
- 8.1.4. CHP
- 8.1.5. Others
- 8.2. Market Analysis, Insights and Forecast - by Storage Device
- 8.2.1. Lithium-ion
- 8.2.2. Lead Acid
- 8.2.3. Flow Battery
- 8.2.4. Flywheels
- 8.2.5. Others
- 8.3. Market Analysis, Insights and Forecast - by Application
- 8.3.1. Healthcare
- 8.3.2. Educational Institutes
- 8.3.3. Military
- 8.3.4. Utility
- 8.3.5. Industrial/ Commercial
- 8.3.6. Remote
- 8.3.7. Others
- 8.1. Market Analysis, Insights and Forecast - by Power Source
- 9. Middle East and Africa DC Grid Connected Microgrid Market Analysis, Insights and Forecast, 2019-2031
- 9.1. Market Analysis, Insights and Forecast - by Power Source
- 9.1.1. Diesel Generators
- 9.1.2. Natural Gas
- 9.1.3. Solar PV
- 9.1.4. CHP
- 9.1.5. Others
- 9.2. Market Analysis, Insights and Forecast - by Storage Device
- 9.2.1. Lithium-ion
- 9.2.2. Lead Acid
- 9.2.3. Flow Battery
- 9.2.4. Flywheels
- 9.2.5. Others
- 9.3. Market Analysis, Insights and Forecast - by Application
- 9.3.1. Healthcare
- 9.3.2. Educational Institutes
- 9.3.3. Military
- 9.3.4. Utility
- 9.3.5. Industrial/ Commercial
- 9.3.6. Remote
- 9.3.7. Others
- 9.1. Market Analysis, Insights and Forecast - by Power Source
- 10. Latin America DC Grid Connected Microgrid Market Analysis, Insights and Forecast, 2019-2031
- 10.1. Market Analysis, Insights and Forecast - by Power Source
- 10.1.1. Diesel Generators
- 10.1.2. Natural Gas
- 10.1.3. Solar PV
- 10.1.4. CHP
- 10.1.5. Others
- 10.2. Market Analysis, Insights and Forecast - by Storage Device
- 10.2.1. Lithium-ion
- 10.2.2. Lead Acid
- 10.2.3. Flow Battery
- 10.2.4. Flywheels
- 10.2.5. Others
- 10.3. Market Analysis, Insights and Forecast - by Application
- 10.3.1. Healthcare
- 10.3.2. Educational Institutes
- 10.3.3. Military
- 10.3.4. Utility
- 10.3.5. Industrial/ Commercial
- 10.3.6. Remote
- 10.3.7. Others
- 10.1. Market Analysis, Insights and Forecast - by Power Source
- 11. Competitive Analysis
- 11.1. Global Market Share Analysis 2024
- 11.2. Company Profiles
- 11.2.1 ABB
- 11.2.1.1. Overview
- 11.2.1.2. Products
- 11.2.1.3. SWOT Analysis
- 11.2.1.4. Recent Developments
- 11.2.1.5. Financials (Based on Availability)
- 11.2.2 AEG International
- 11.2.2.1. Overview
- 11.2.2.2. Products
- 11.2.2.3. SWOT Analysis
- 11.2.2.4. Recent Developments
- 11.2.2.5. Financials (Based on Availability)
- 11.2.3 ARDA Power
- 11.2.3.1. Overview
- 11.2.3.2. Products
- 11.2.3.3. SWOT Analysis
- 11.2.3.4. Recent Developments
- 11.2.3.5. Financials (Based on Availability)
- 11.2.4 Eaton
- 11.2.4.1. Overview
- 11.2.4.2. Products
- 11.2.4.3. SWOT Analysis
- 11.2.4.4. Recent Developments
- 11.2.4.5. Financials (Based on Availability)
- 11.2.5 Nextek Power Systems
- 11.2.5.1. Overview
- 11.2.5.2. Products
- 11.2.5.3. SWOT Analysis
- 11.2.5.4. Recent Developments
- 11.2.5.5. Financials (Based on Availability)
- 11.2.6 Schneider Electric SE
- 11.2.6.1. Overview
- 11.2.6.2. Products
- 11.2.6.3. SWOT Analysis
- 11.2.6.4. Recent Developments
- 11.2.6.5. Financials (Based on Availability)
- 11.2.7 SolarWorX
- 11.2.7.1. Overview
- 11.2.7.2. Products
- 11.2.7.3. SWOT Analysis
- 11.2.7.4. Recent Developments
- 11.2.7.5. Financials (Based on Availability)
- 11.2.8 Schaltbau Group
- 11.2.8.1. Overview
- 11.2.8.2. Products
- 11.2.8.3. SWOT Analysis
- 11.2.8.4. Recent Developments
- 11.2.8.5. Financials (Based on Availability)
- 11.2.9 Stellar Energy
- 11.2.9.1. Overview
- 11.2.9.2. Products
- 11.2.9.3. SWOT Analysis
- 11.2.9.4. Recent Developments
- 11.2.9.5. Financials (Based on Availability)
- 11.2.10 Sumitomo Electric Industries Ltd
- 11.2.10.1. Overview
- 11.2.10.2. Products
- 11.2.10.3. SWOT Analysis
- 11.2.10.4. Recent Developments
- 11.2.10.5. Financials (Based on Availability)
- 11.2.1 ABB
- Figure 1: Global DC Grid Connected Microgrid Market Revenue Breakdown (Billion, %) by Region 2024 & 2032
- Figure 2: Global DC Grid Connected Microgrid Market Volume Breakdown (K Tons, %) by Region 2024 & 2032
- Figure 3: North America DC Grid Connected Microgrid Market Revenue (Billion), by Power Source 2024 & 2032
- Figure 4: North America DC Grid Connected Microgrid Market Volume (K Tons), by Power Source 2024 & 2032
- Figure 5: North America DC Grid Connected Microgrid Market Revenue Share (%), by Power Source 2024 & 2032
- Figure 6: North America DC Grid Connected Microgrid Market Volume Share (%), by Power Source 2024 & 2032
- Figure 7: North America DC Grid Connected Microgrid Market Revenue (Billion), by Storage Device 2024 & 2032
- Figure 8: North America DC Grid Connected Microgrid Market Volume (K Tons), by Storage Device 2024 & 2032
- Figure 9: North America DC Grid Connected Microgrid Market Revenue Share (%), by Storage Device 2024 & 2032
- Figure 10: North America DC Grid Connected Microgrid Market Volume Share (%), by Storage Device 2024 & 2032
- Figure 11: North America DC Grid Connected Microgrid Market Revenue (Billion), by Application 2024 & 2032
- Figure 12: North America DC Grid Connected Microgrid Market Volume (K Tons), by Application 2024 & 2032
- Figure 13: North America DC Grid Connected Microgrid Market Revenue Share (%), by Application 2024 & 2032
- Figure 14: North America DC Grid Connected Microgrid Market Volume Share (%), by Application 2024 & 2032
- Figure 15: North America DC Grid Connected Microgrid Market Revenue (Billion), by Country 2024 & 2032
- Figure 16: North America DC Grid Connected Microgrid Market Volume (K Tons), by Country 2024 & 2032
- Figure 17: North America DC Grid Connected Microgrid Market Revenue Share (%), by Country 2024 & 2032
- Figure 18: North America DC Grid Connected Microgrid Market Volume Share (%), by Country 2024 & 2032
- Figure 19: Europe DC Grid Connected Microgrid Market Revenue (Billion), by Power Source 2024 & 2032
- Figure 20: Europe DC Grid Connected Microgrid Market Volume (K Tons), by Power Source 2024 & 2032
- Figure 21: Europe DC Grid Connected Microgrid Market Revenue Share (%), by Power Source 2024 & 2032
- Figure 22: Europe DC Grid Connected Microgrid Market Volume Share (%), by Power Source 2024 & 2032
- Figure 23: Europe DC Grid Connected Microgrid Market Revenue (Billion), by Storage Device 2024 & 2032
- Figure 24: Europe DC Grid Connected Microgrid Market Volume (K Tons), by Storage Device 2024 & 2032
- Figure 25: Europe DC Grid Connected Microgrid Market Revenue Share (%), by Storage Device 2024 & 2032
- Figure 26: Europe DC Grid Connected Microgrid Market Volume Share (%), by Storage Device 2024 & 2032
- Figure 27: Europe DC Grid Connected Microgrid Market Revenue (Billion), by Application 2024 & 2032
- Figure 28: Europe DC Grid Connected Microgrid Market Volume (K Tons), by Application 2024 & 2032
- Figure 29: Europe DC Grid Connected Microgrid Market Revenue Share (%), by Application 2024 & 2032
- Figure 30: Europe DC Grid Connected Microgrid Market Volume Share (%), by Application 2024 & 2032
- Figure 31: Europe DC Grid Connected Microgrid Market Revenue (Billion), by Country 2024 & 2032
- Figure 32: Europe DC Grid Connected Microgrid Market Volume (K Tons), by Country 2024 & 2032
- Figure 33: Europe DC Grid Connected Microgrid Market Revenue Share (%), by Country 2024 & 2032
- Figure 34: Europe DC Grid Connected Microgrid Market Volume Share (%), by Country 2024 & 2032
- Figure 35: Asia Pacific DC Grid Connected Microgrid Market Revenue (Billion), by Power Source 2024 & 2032
- Figure 36: Asia Pacific DC Grid Connected Microgrid Market Volume (K Tons), by Power Source 2024 & 2032
- Figure 37: Asia Pacific DC Grid Connected Microgrid Market Revenue Share (%), by Power Source 2024 & 2032
- Figure 38: Asia Pacific DC Grid Connected Microgrid Market Volume Share (%), by Power Source 2024 & 2032
- Figure 39: Asia Pacific DC Grid Connected Microgrid Market Revenue (Billion), by Storage Device 2024 & 2032
- Figure 40: Asia Pacific DC Grid Connected Microgrid Market Volume (K Tons), by Storage Device 2024 & 2032
- Figure 41: Asia Pacific DC Grid Connected Microgrid Market Revenue Share (%), by Storage Device 2024 & 2032
- Figure 42: Asia Pacific DC Grid Connected Microgrid Market Volume Share (%), by Storage Device 2024 & 2032
- Figure 43: Asia Pacific DC Grid Connected Microgrid Market Revenue (Billion), by Application 2024 & 2032
- Figure 44: Asia Pacific DC Grid Connected Microgrid Market Volume (K Tons), by Application 2024 & 2032
- Figure 45: Asia Pacific DC Grid Connected Microgrid Market Revenue Share (%), by Application 2024 & 2032
- Figure 46: Asia Pacific DC Grid Connected Microgrid Market Volume Share (%), by Application 2024 & 2032
- Figure 47: Asia Pacific DC Grid Connected Microgrid Market Revenue (Billion), by Country 2024 & 2032
- Figure 48: Asia Pacific DC Grid Connected Microgrid Market Volume (K Tons), by Country 2024 & 2032
- Figure 49: Asia Pacific DC Grid Connected Microgrid Market Revenue Share (%), by Country 2024 & 2032
- Figure 50: Asia Pacific DC Grid Connected Microgrid Market Volume Share (%), by Country 2024 & 2032
- Figure 51: Middle East and Africa DC Grid Connected Microgrid Market Revenue (Billion), by Power Source 2024 & 2032
- Figure 52: Middle East and Africa DC Grid Connected Microgrid Market Volume (K Tons), by Power Source 2024 & 2032
- Figure 53: Middle East and Africa DC Grid Connected Microgrid Market Revenue Share (%), by Power Source 2024 & 2032
- Figure 54: Middle East and Africa DC Grid Connected Microgrid Market Volume Share (%), by Power Source 2024 & 2032
- Figure 55: Middle East and Africa DC Grid Connected Microgrid Market Revenue (Billion), by Storage Device 2024 & 2032
- Figure 56: Middle East and Africa DC Grid Connected Microgrid Market Volume (K Tons), by Storage Device 2024 & 2032
- Figure 57: Middle East and Africa DC Grid Connected Microgrid Market Revenue Share (%), by Storage Device 2024 & 2032
- Figure 58: Middle East and Africa DC Grid Connected Microgrid Market Volume Share (%), by Storage Device 2024 & 2032
- Figure 59: Middle East and Africa DC Grid Connected Microgrid Market Revenue (Billion), by Application 2024 & 2032
- Figure 60: Middle East and Africa DC Grid Connected Microgrid Market Volume (K Tons), by Application 2024 & 2032
- Figure 61: Middle East and Africa DC Grid Connected Microgrid Market Revenue Share (%), by Application 2024 & 2032
- Figure 62: Middle East and Africa DC Grid Connected Microgrid Market Volume Share (%), by Application 2024 & 2032
- Figure 63: Middle East and Africa DC Grid Connected Microgrid Market Revenue (Billion), by Country 2024 & 2032
- Figure 64: Middle East and Africa DC Grid Connected Microgrid Market Volume (K Tons), by Country 2024 & 2032
- Figure 65: Middle East and Africa DC Grid Connected Microgrid Market Revenue Share (%), by Country 2024 & 2032
- Figure 66: Middle East and Africa DC Grid Connected Microgrid Market Volume Share (%), by Country 2024 & 2032
- Figure 67: Latin America DC Grid Connected Microgrid Market Revenue (Billion), by Power Source 2024 & 2032
- Figure 68: Latin America DC Grid Connected Microgrid Market Volume (K Tons), by Power Source 2024 & 2032
- Figure 69: Latin America DC Grid Connected Microgrid Market Revenue Share (%), by Power Source 2024 & 2032
- Figure 70: Latin America DC Grid Connected Microgrid Market Volume Share (%), by Power Source 2024 & 2032
- Figure 71: Latin America DC Grid Connected Microgrid Market Revenue (Billion), by Storage Device 2024 & 2032
- Figure 72: Latin America DC Grid Connected Microgrid Market Volume (K Tons), by Storage Device 2024 & 2032
- Figure 73: Latin America DC Grid Connected Microgrid Market Revenue Share (%), by Storage Device 2024 & 2032
- Figure 74: Latin America DC Grid Connected Microgrid Market Volume Share (%), by Storage Device 2024 & 2032
- Figure 75: Latin America DC Grid Connected Microgrid Market Revenue (Billion), by Application 2024 & 2032
- Figure 76: Latin America DC Grid Connected Microgrid Market Volume (K Tons), by Application 2024 & 2032
- Figure 77: Latin America DC Grid Connected Microgrid Market Revenue Share (%), by Application 2024 & 2032
- Figure 78: Latin America DC Grid Connected Microgrid Market Volume Share (%), by Application 2024 & 2032
- Figure 79: Latin America DC Grid Connected Microgrid Market Revenue (Billion), by Country 2024 & 2032
- Figure 80: Latin America DC Grid Connected Microgrid Market Volume (K Tons), by Country 2024 & 2032
- Figure 81: Latin America DC Grid Connected Microgrid Market Revenue Share (%), by Country 2024 & 2032
- Figure 82: Latin America DC Grid Connected Microgrid Market Volume Share (%), by Country 2024 & 2032
- Table 1: Global DC Grid Connected Microgrid Market Revenue Billion Forecast, by Region 2019 & 2032
- Table 2: Global DC Grid Connected Microgrid Market Volume K Tons Forecast, by Region 2019 & 2032
- Table 3: Global DC Grid Connected Microgrid Market Revenue Billion Forecast, by Power Source 2019 & 2032
- Table 4: Global DC Grid Connected Microgrid Market Volume K Tons Forecast, by Power Source 2019 & 2032
- Table 5: Global DC Grid Connected Microgrid Market Revenue Billion Forecast, by Storage Device 2019 & 2032
- Table 6: Global DC Grid Connected Microgrid Market Volume K Tons Forecast, by Storage Device 2019 & 2032
- Table 7: Global DC Grid Connected Microgrid Market Revenue Billion Forecast, by Application 2019 & 2032
- Table 8: Global DC Grid Connected Microgrid Market Volume K Tons Forecast, by Application 2019 & 2032
- Table 9: Global DC Grid Connected Microgrid Market Revenue Billion Forecast, by Region 2019 & 2032
- Table 10: Global DC Grid Connected Microgrid Market Volume K Tons Forecast, by Region 2019 & 2032
- Table 11: Global DC Grid Connected Microgrid Market Revenue Billion Forecast, by Power Source 2019 & 2032
- Table 12: Global DC Grid Connected Microgrid Market Volume K Tons Forecast, by Power Source 2019 & 2032
- Table 13: Global DC Grid Connected Microgrid Market Revenue Billion Forecast, by Storage Device 2019 & 2032
- Table 14: Global DC Grid Connected Microgrid Market Volume K Tons Forecast, by Storage Device 2019 & 2032
- Table 15: Global DC Grid Connected Microgrid Market Revenue Billion Forecast, by Application 2019 & 2032
- Table 16: Global DC Grid Connected Microgrid Market Volume K Tons Forecast, by Application 2019 & 2032
- Table 17: Global DC Grid Connected Microgrid Market Revenue Billion Forecast, by Country 2019 & 2032
- Table 18: Global DC Grid Connected Microgrid Market Volume K Tons Forecast, by Country 2019 & 2032
- Table 19: U.S. DC Grid Connected Microgrid Market Revenue (Billion) Forecast, by Application 2019 & 2032
- Table 20: U.S. DC Grid Connected Microgrid Market Volume (K Tons) Forecast, by Application 2019 & 2032
- Table 21: Canada DC Grid Connected Microgrid Market Revenue (Billion) Forecast, by Application 2019 & 2032
- Table 22: Canada DC Grid Connected Microgrid Market Volume (K Tons) Forecast, by Application 2019 & 2032
- Table 23: Mexico DC Grid Connected Microgrid Market Revenue (Billion) Forecast, by Application 2019 & 2032
- Table 24: Mexico DC Grid Connected Microgrid Market Volume (K Tons) Forecast, by Application 2019 & 2032
- Table 25: Global DC Grid Connected Microgrid Market Revenue Billion Forecast, by Power Source 2019 & 2032
- Table 26: Global DC Grid Connected Microgrid Market Volume K Tons Forecast, by Power Source 2019 & 2032
- Table 27: Global DC Grid Connected Microgrid Market Revenue Billion Forecast, by Storage Device 2019 & 2032
- Table 28: Global DC Grid Connected Microgrid Market Volume K Tons Forecast, by Storage Device 2019 & 2032
- Table 29: Global DC Grid Connected Microgrid Market Revenue Billion Forecast, by Application 2019 & 2032
- Table 30: Global DC Grid Connected Microgrid Market Volume K Tons Forecast, by Application 2019 & 2032
- Table 31: Global DC Grid Connected Microgrid Market Revenue Billion Forecast, by Country 2019 & 2032
- Table 32: Global DC Grid Connected Microgrid Market Volume K Tons Forecast, by Country 2019 & 2032
- Table 33: Germany DC Grid Connected Microgrid Market Revenue (Billion) Forecast, by Application 2019 & 2032
- Table 34: Germany DC Grid Connected Microgrid Market Volume (K Tons) Forecast, by Application 2019 & 2032
- Table 35: France DC Grid Connected Microgrid Market Revenue (Billion) Forecast, by Application 2019 & 2032
- Table 36: France DC Grid Connected Microgrid Market Volume (K Tons) Forecast, by Application 2019 & 2032
- Table 37: UK DC Grid Connected Microgrid Market Revenue (Billion) Forecast, by Application 2019 & 2032
- Table 38: UK DC Grid Connected Microgrid Market Volume (K Tons) Forecast, by Application 2019 & 2032
- Table 39: Russia DC Grid Connected Microgrid Market Revenue (Billion) Forecast, by Application 2019 & 2032
- Table 40: Russia DC Grid Connected Microgrid Market Volume (K Tons) Forecast, by Application 2019 & 2032
- Table 41: Spain DC Grid Connected Microgrid Market Revenue (Billion) Forecast, by Application 2019 & 2032
- Table 42: Spain DC Grid Connected Microgrid Market Volume (K Tons) Forecast, by Application 2019 & 2032
- Table 43: Italy DC Grid Connected Microgrid Market Revenue (Billion) Forecast, by Application 2019 & 2032
- Table 44: Italy DC Grid Connected Microgrid Market Volume (K Tons) Forecast, by Application 2019 & 2032
- Table 45: Denmark DC Grid Connected Microgrid Market Revenue (Billion) Forecast, by Application 2019 & 2032
- Table 46: Denmark DC Grid Connected Microgrid Market Volume (K Tons) Forecast, by Application 2019 & 2032
- Table 47: Global DC Grid Connected Microgrid Market Revenue Billion Forecast, by Power Source 2019 & 2032
- Table 48: Global DC Grid Connected Microgrid Market Volume K Tons Forecast, by Power Source 2019 & 2032
- Table 49: Global DC Grid Connected Microgrid Market Revenue Billion Forecast, by Storage Device 2019 & 2032
- Table 50: Global DC Grid Connected Microgrid Market Volume K Tons Forecast, by Storage Device 2019 & 2032
- Table 51: Global DC Grid Connected Microgrid Market Revenue Billion Forecast, by Application 2019 & 2032
- Table 52: Global DC Grid Connected Microgrid Market Volume K Tons Forecast, by Application 2019 & 2032
- Table 53: Global DC Grid Connected Microgrid Market Revenue Billion Forecast, by Country 2019 & 2032
- Table 54: Global DC Grid Connected Microgrid Market Volume K Tons Forecast, by Country 2019 & 2032
- Table 55: China DC Grid Connected Microgrid Market Revenue (Billion) Forecast, by Application 2019 & 2032
- Table 56: China DC Grid Connected Microgrid Market Volume (K Tons) Forecast, by Application 2019 & 2032
- Table 57: Japan DC Grid Connected Microgrid Market Revenue (Billion) Forecast, by Application 2019 & 2032
- Table 58: Japan DC Grid Connected Microgrid Market Volume (K Tons) Forecast, by Application 2019 & 2032
- Table 59: South Korea DC Grid Connected Microgrid Market Revenue (Billion) Forecast, by Application 2019 & 2032
- Table 60: South Korea DC Grid Connected Microgrid Market Volume (K Tons) Forecast, by Application 2019 & 2032
- Table 61: India DC Grid Connected Microgrid Market Revenue (Billion) Forecast, by Application 2019 & 2032
- Table 62: India DC Grid Connected Microgrid Market Volume (K Tons) Forecast, by Application 2019 & 2032
- Table 63: Australia DC Grid Connected Microgrid Market Revenue (Billion) Forecast, by Application 2019 & 2032
- Table 64: Australia DC Grid Connected Microgrid Market Volume (K Tons) Forecast, by Application 2019 & 2032
- Table 65: Malaysia DC Grid Connected Microgrid Market Revenue (Billion) Forecast, by Application 2019 & 2032
- Table 66: Malaysia DC Grid Connected Microgrid Market Volume (K Tons) Forecast, by Application 2019 & 2032
- Table 67: Indonesia DC Grid Connected Microgrid Market Revenue (Billion) Forecast, by Application 2019 & 2032
- Table 68: Indonesia DC Grid Connected Microgrid Market Volume (K Tons) Forecast, by Application 2019 & 2032
- Table 69: Global DC Grid Connected Microgrid Market Revenue Billion Forecast, by Power Source 2019 & 2032
- Table 70: Global DC Grid Connected Microgrid Market Volume K Tons Forecast, by Power Source 2019 & 2032
- Table 71: Global DC Grid Connected Microgrid Market Revenue Billion Forecast, by Storage Device 2019 & 2032
- Table 72: Global DC Grid Connected Microgrid Market Volume K Tons Forecast, by Storage Device 2019 & 2032
- Table 73: Global DC Grid Connected Microgrid Market Revenue Billion Forecast, by Application 2019 & 2032
- Table 74: Global DC Grid Connected Microgrid Market Volume K Tons Forecast, by Application 2019 & 2032
- Table 75: Global DC Grid Connected Microgrid Market Revenue Billion Forecast, by Country 2019 & 2032
- Table 76: Global DC Grid Connected Microgrid Market Volume K Tons Forecast, by Country 2019 & 2032
- Table 77: Saudi Arabia DC Grid Connected Microgrid Market Revenue (Billion) Forecast, by Application 2019 & 2032
- Table 78: Saudi Arabia DC Grid Connected Microgrid Market Volume (K Tons) Forecast, by Application 2019 & 2032
- Table 79: UAE DC Grid Connected Microgrid Market Revenue (Billion) Forecast, by Application 2019 & 2032
- Table 80: UAE DC Grid Connected Microgrid Market Volume (K Tons) Forecast, by Application 2019 & 2032
- Table 81: South Africa DC Grid Connected Microgrid Market Revenue (Billion) Forecast, by Application 2019 & 2032
- Table 82: South Africa DC Grid Connected Microgrid Market Volume (K Tons) Forecast, by Application 2019 & 2032
- Table 83: Iran DC Grid Connected Microgrid Market Revenue (Billion) Forecast, by Application 2019 & 2032
- Table 84: Iran DC Grid Connected Microgrid Market Volume (K Tons) Forecast, by Application 2019 & 2032
- Table 85: Nigeria DC Grid Connected Microgrid Market Revenue (Billion) Forecast, by Application 2019 & 2032
- Table 86: Nigeria DC Grid Connected Microgrid Market Volume (K Tons) Forecast, by Application 2019 & 2032
- Table 87: Global DC Grid Connected Microgrid Market Revenue Billion Forecast, by Power Source 2019 & 2032
- Table 88: Global DC Grid Connected Microgrid Market Volume K Tons Forecast, by Power Source 2019 & 2032
- Table 89: Global DC Grid Connected Microgrid Market Revenue Billion Forecast, by Storage Device 2019 & 2032
- Table 90: Global DC Grid Connected Microgrid Market Volume K Tons Forecast, by Storage Device 2019 & 2032
- Table 91: Global DC Grid Connected Microgrid Market Revenue Billion Forecast, by Application 2019 & 2032
- Table 92: Global DC Grid Connected Microgrid Market Volume K Tons Forecast, by Application 2019 & 2032
- Table 93: Global DC Grid Connected Microgrid Market Revenue Billion Forecast, by Country 2019 & 2032
- Table 94: Global DC Grid Connected Microgrid Market Volume K Tons Forecast, by Country 2019 & 2032
- Table 95: Brazil DC Grid Connected Microgrid Market Revenue (Billion) Forecast, by Application 2019 & 2032
- Table 96: Brazil DC Grid Connected Microgrid Market Volume (K Tons) Forecast, by Application 2019 & 2032
- Table 97: Argentina DC Grid Connected Microgrid Market Revenue (Billion) Forecast, by Application 2019 & 2032
- Table 98: Argentina DC Grid Connected Microgrid Market Volume (K Tons) Forecast, by Application 2019 & 2032
- Table 99: Chile DC Grid Connected Microgrid Market Revenue (Billion) Forecast, by Application 2019 & 2032
- Table 100: Chile DC Grid Connected Microgrid Market Volume (K Tons) Forecast, by Application 2019 & 2032
STEP 1 - Identification of Relevant Samples Size from Population Database


STEP 2 - Approaches for Defining Global Market Size (Value, Volume* & Price*)

Note* : In applicable scenarios
STEP 3 - Data Sources
Primary Research
- Web Analytics
- Survey Reports
- Research Institute
- Latest Research Reports
- Opinion Leaders
Secondary Research
- Annual Reports
- White Paper
- Latest Press Release
- Industry Association
- Paid Database
- Investor Presentations

STEP 4 - Data Triangulation
Involves using different sources of information in order to increase the validity of a study
These sources are likely to be stakeholders in a program - participants, other researchers, program staff, other community members, and so on.
Then we put all data in single framework & apply various statistical tools to find out the dynamic on the market.
During the analysis stage, feedback from the stakeholder groups would be compared to determine areas of agreement as well as areas of divergence
Frequently Asked Questions
Related Reports
See the similar reports


About Market Insights Report
Market Insights Reports offers comprehensive market research reports and analysis, giving businesses important information about their clients, rivals, and sector to help them make well-informed decisions on operations, marketing, and business strategy. We offer a variety of services in addition to market research, data analysis, and strategy planning. In order to find opportunities and learn more about our competitors and the industry at large, we employ competitive analysis. To identify areas for development, we also evaluate our performance against that of our rivals. We can determine the places at which we can offer our clients the most value by performing value chain analysis.
Additionally, clients receive a thorough overview of their industry business environment. We can find trends that help us forecast future possibilities and threats by examining global macroeconomic dynamics and consumer behavior patterns. By analyzing their features and advantages, contrasting them with comparable items on the market, and evaluating both their quantitative and qualitative performance, we comprehensively evaluate our clients' products. This allows us to assist customers in determining how their goods compare to those of their rivals and in creating successful marketing plans. Our group has been successful in gaining a thorough grasp of our clients' requirements and offering them creative solutions. We currently provide services to more than 50 nations in Europe, the Middle East, Africa, Latin America, Asia Pacific, and North America. Because of our global reach, we have been able to establish trusting bonds with our partners and clients in various nations, improving customer service and forging a more cohesive worldwide presence.