
.jpg&w=3840&q=100)
Market
Insights
Reports delivered globally, covering a wide range of industries and sectors.
Clients who trust our expertise and rely on our insights for business decisions.
Managed Reports, ensuring seamless updates and premium service.
Satisfied Customers, committed to delivering exceptional value and quality.
Display Market Charting Growth Trajectories: Analysis and Forecasts 2025-2033
Display Market by Technology (LCD (Liquid Crystal Display), LED (Light Emitting Diode), OLED (Organic Light Emitting Diode), MicroLED, Quantum Dot, E-paper (Electronic Paper Display), Plasma Display Panels, Projection Displays), by Display Type (Flat Panel Display, Flexible Display, Transparent Display, 3D Display), by Resolution (HD (High Definition), Full HD, 4K UHD (Ultra High Definition), 8K UHD, Others), by Panel Size (Small (Below 10 inches), Medium (10–32 inches), Large (Above 32 inches)), by Application, 2021 - 2032 (Consumer Electronics, Automotive Displays, Healthcare Displays, Retail Displays, Industrial Displays, Others), by End-User (Commercial, Residential, Industrial, Healthcare, Automotive), by North America (U.S., Canada), by Europe (Germany, UK, France, Italy, Spain, Rest of Europe), by Asia Pacific (China, India, Japan, South Korea, ANZ, Rest of Asia Pacific), by Latin America (Brazil, Mexico, Rest of Latin America), by MEA (UAE, Saudi Arabia, South Africa, Rest of MEA) Forecast 2025-2033
Display Market Charting Growth Trajectories: Analysis and Forecasts 2025-2033
Key Insights
The size of the Display Market was valued at USD 130.5 Billion in 2024 and is projected to reach USD 183.63 Billion by 2033, with an expected CAGR of 5% during the forecast period. The Display Market is centered on the advancement and utilization of different display technologies, such as LED, OLED, LCD, and new innovations like MicroLED and quantum dot displays, in a diverse array of sectors. Displays are essential elements in consumer electronics like smartphones, TVs, tablets, and wearables, along with industrial uses, car dashboards, digital signage, and medical devices. The market is propelled by the rising need for improved resolution, enhanced color fidelity, and larger, more engaging displays in entertainment, advertising, and gaming. Furthermore, the move towards energy-saving, sleek, and adaptable displays is driving advancements in display technologies. Improvements in OLED and MicroLED, which provide enhanced contrast, vibrant colors, and greater energy efficiency than conventional LCD, are especially driving expansion in luxury markets such as high-end televisions and mobile gadgets. The growth of augmented reality (AR), virtual reality (VR), and intelligent displays significantly contributes to the market expansion. With the rising demand for immersive experiences, enhanced image quality, and new form factors, the Display Market is anticipated to expand considerably, as ongoing innovations make displays more interactive, efficient, and adaptable.

Display Market Concentration & Characteristics
The display market is concentrated, with a few major players dominating the industry. These players have a strong focus on research and development, investing heavily in advanced technologies and production capabilities. The market is characterized by innovation and intense competition, with players constantly pushing the boundaries of display technology. Regulations impact the display industry by setting safety and performance standards, influencing product development and manufacturing processes. Product substitutes, such as projectors and printed screens, exist but face challenges in terms of image quality and portability. End user concentration is high, with consumer electronics and automotive sectors being the major consumers of display panels. The acquisition and merger activities in the display industry are driven by technological advancements, consolidation, and strategic alliances to expand market share and enhance competitiveness.
Display Market Trends
The display market is witnessing several key trends, including the emergence of flexible and transparent displays, the adoption of high-resolution and curved panels, and the growing popularity of touchless and haptic feedback technologies. The increasing demand for immersive experiences in gaming, virtual and augmented reality is driving the development of cutting-edge display technologies. In addition, the integration of artificial intelligence and machine learning in displays is expected to enhance user experience and enable new applications.

Key Region or Country & Segment to Dominate the Market
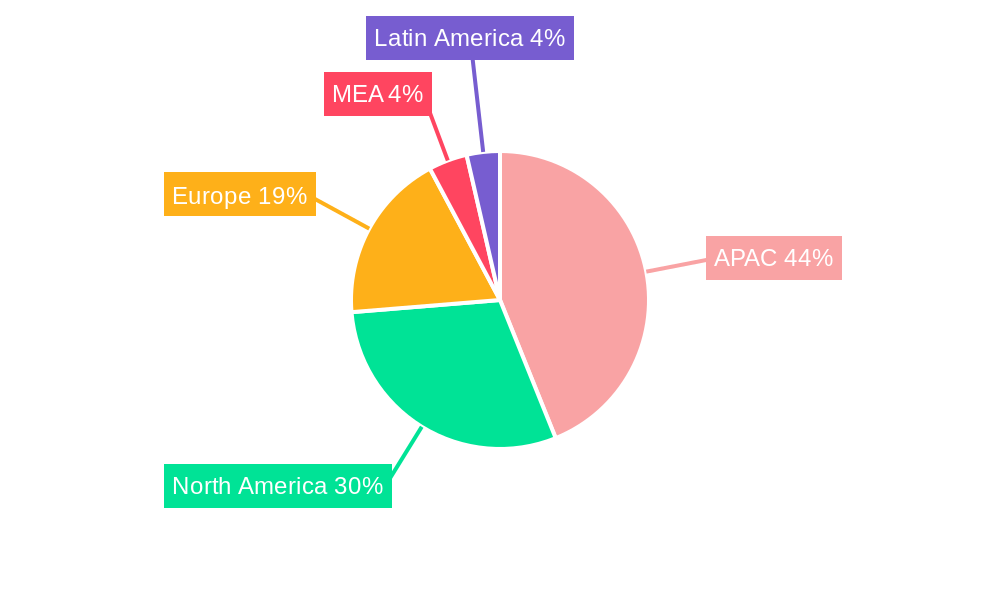
The Asia Pacific region is expected to dominate the display market due to the strong presence of major manufacturers, growing demand from consumer electronics and automotive sectors, and government initiatives supporting the development of the display industry. In terms of segment, the OLED technology segment is anticipated to witness the highest growth, driven by its superior image quality and flexibility.
Display Market Product Insights Report Coverage & Deliverables
This Display Market Product Insights Report Coverage & Deliverables will provide comprehensive information on the display market, including market size, share, growth, trends, key players, and industry analysis. The report will cover various segments, applications, regions, and industry developments to provide a comprehensive understanding of the market landscape.
Display Market Analysis
The display market has experienced significant growth in recent years. In terms of market size, the global display market reached USD 130.5 billion in 2022 and is projected to grow to USD 222.5 billion by 2032, exhibiting a CAGR of 5% during the forecast period. The market share of different segments, applications, and regions will be analyzed to provide insights into the competitive dynamics and growth potential of each segment.
Display Market Regional Insights
The display market is segmented into North America, Europe, Asia Pacific, Latin America, and MEA. Asia Pacific holds the largest market share due to the presence of major display manufacturers and the high demand from consumer electronics and automotive sectors. North America and Europe are also significant markets for displays, with a focus on advanced technologies and innovative applications. Latin America and MEA are emerging markets with growing demand for displays in various applications.
Driving Forces: What's Propelling the Display Market
The display market is driven by several factors, including:
- Increasing demand for high-quality and immersive display experiences
- Growing adoption of advanced technologies such as OLEDs and microLEDs
- Rising demand for flexible and transparent displays
- Expanding applications of display panels in consumer electronics, automotive, healthcare, and retail
- Government initiatives promoting digital transformation and innovation
Challenges and Restraints in Display Market
The display market faces certain challenges and restraints, such as:
- Fluctuating prices of raw materials and components
- Intense competition among market players
- Technical limitations and manufacturing complexities associated with advanced display technologies
- Concerns regarding environmental sustainability and e-waste management
Emerging Trends in Display Market
The display market is witnessing the emergence of several trends, including:
- Adoption of miniLED and microLED technologies for high-brightness and improved image quality
- Growing popularity of foldable and rollable displays
- Integration of AI and machine learning to enhance user experience and enable new applications
- Development of holographic and 3D displays for immersive experiences
Display Industry News
Key industry developments over the past year:
- June 2024: LG Display began mass production of the industry's first 13-inch Tandem OLED panel for laptops.
- May 2024: LG Display unveils cutting-edge OLED technologies, including OLEDoS for VR, at SID Display Week 2024.
- January 2024: BOE showcases smart automotive displays and innovative consumer electronics products at CES 2024.
- October 2023: Samsung Display acquires eMagin Corporation, a leader in OLED microdisplays for AR/VR.
Leading Players in the Display Market
The leading players in the display market include:
- Samsung Electronics Co., Ltd.
- LG Display Co., Ltd.
- BOE Technology Group Co., Ltd.
- AU Optronics Corp.
- Innolux Corporation
- Sharp Corporation
Display Market Segmentation
- 1. Technology
- 1.1. LCD (Liquid Crystal Display)
- 1.2. LED (Light Emitting Diode)
- 1.3. OLED (Organic Light Emitting Diode)
- 1.4. MicroLED
- 1.5. Quantum Dot
- 1.6. E-paper (Electronic Paper Display)
- 1.7. Plasma Display Panels
- 1.8. Projection Displays
- 2. Display Type
- 2.1. Flat Panel Display
- 2.2. Flexible Display
- 2.3. Transparent Display
- 2.4. 3D Display
- 3. Resolution
- 3.1. HD (High Definition)
- 3.2. Full HD
- 3.3. 4K UHD (Ultra High Definition)
- 3.4. 8K UHD
- 3.5. Others
- 4. Panel Size
- 4.1. Small (Below 10 inches)
- 4.2. Medium (10–32 inches)
- 4.3. Large (Above 32 inches)
- 5. Application, 2021 - 2032
- 5.1. Consumer Electronics
- 5.1.1. Smartphones
- 5.1.2. Tablets
- 5.1.3. Televisions
- 5.1.4. Laptops and Monitors
- 5.1.5. Wearable Devices
- 5.2. Automotive Displays
- 5.2.1. Infotainment Systems
- 5.2.2. Instrument Cluster Displays
- 5.2.3. Head-up Displays (HUD)
- 5.3. Healthcare Displays
- 5.3.1. Medical Imaging
- 5.3.2. Diagnostic Displays
- 5.4. Retail Displays
- 5.4.1. Digital Signage
- 5.4.2. Kiosks
- 5.5. Industrial Displays
- 5.5.1. Control Panels
- 5.5.2. HMI (Human-Machine Interface) Devices
- 5.6. Others
- 5.6.1. Gaming Displays
- 5.6.2. Military & Defense
- 5.1. Consumer Electronics
- 6. End-User
- 6.1. Commercial
- 6.2. Residential
- 6.3. Industrial
- 6.4. Healthcare
- 6.5. Automotive
Display Market Segmentation By Geography
- 1. North America
- 1.1. U.S.
- 1.2. Canada
- 2. Europe
- 2.1. Germany
- 2.2. UK
- 2.3. France
- 2.4. Italy
- 2.5. Spain
- 2.6. Rest of Europe
- 3. Asia Pacific
- 3.1. China
- 3.2. India
- 3.3. Japan
- 3.4. South Korea
- 3.5. ANZ
- 3.6. Rest of Asia Pacific
- 4. Latin America
- 4.1. Brazil
- 4.2. Mexico
- 4.3. Rest of Latin America
- 5. MEA
- 5.1. UAE
- 5.2. Saudi Arabia
- 5.3. South Africa
- 5.4. Rest of MEA
Display Market REPORT HIGHLIGHTS
| Aspects | Details |
|---|---|
| Study Period | 2019-2033 |
| Base Year | 2024 |
| Estimated Year | 2025 |
| Forecast Period | 2025-2033 |
| Historical Period | 2019-2024 |
| Growth Rate | CAGR of 5% from 2019-2033 |
| Segmentation |
|
- 1. Introduction
- 1.1. Research Scope
- 1.2. Market Segmentation
- 1.3. Research Methodology
- 1.4. Definitions and Assumptions
- 2. Executive Summary
- 2.1. Introduction
- 3. Market Dynamics
- 3.1. Introduction
- 3.2. Market Drivers
- 3.2.1 Rising demand for consumer electronics
- 3.2.2 Advancements in display technologies
- 3.2.3 Increasing adoption of digital signage
- 3.2.4 Growing automotive display industry
- 3.2.5 Expansion of the Gaming Industry
- 3.3. Market Restrains
- 3.3.1 High manufacturing costs
- 3.3.2 Supply chain disruptions
- 3.4. Market Trends
- 4. Market Factor Analysis
- 4.1. Porters Five Forces
- 4.2. Supply/Value Chain
- 4.3. PESTEL analysis
- 4.4. Market Entropy
- 4.5. Patent/Trademark Analysis
- 5. Global Display Market Analysis, Insights and Forecast, 2019-2031
- 5.1. Market Analysis, Insights and Forecast - by Technology
- 5.1.1. LCD (Liquid Crystal Display)
- 5.1.2. LED (Light Emitting Diode)
- 5.1.3. OLED (Organic Light Emitting Diode)
- 5.1.4. MicroLED
- 5.1.5. Quantum Dot
- 5.1.6. E-paper (Electronic Paper Display)
- 5.1.7. Plasma Display Panels
- 5.1.8. Projection Displays
- 5.2. Market Analysis, Insights and Forecast - by Display Type
- 5.2.1. Flat Panel Display
- 5.2.2. Flexible Display
- 5.2.3. Transparent Display
- 5.2.4. 3D Display
- 5.3. Market Analysis, Insights and Forecast - by Resolution
- 5.3.1. HD (High Definition)
- 5.3.2. Full HD
- 5.3.3. 4K UHD (Ultra High Definition)
- 5.3.4. 8K UHD
- 5.3.5. Others
- 5.4. Market Analysis, Insights and Forecast - by Panel Size
- 5.4.1. Small (Below 10 inches)
- 5.4.2. Medium (10–32 inches)
- 5.4.3. Large (Above 32 inches)
- 5.5. Market Analysis, Insights and Forecast - by Application, 2021 - 2032
- 5.5.1. Consumer Electronics
- 5.5.1.1. Smartphones
- 5.5.1.2. Tablets
- 5.5.1.3. Televisions
- 5.5.1.4. Laptops and Monitors
- 5.5.1.5. Wearable Devices
- 5.5.2. Automotive Displays
- 5.5.2.1. Infotainment Systems
- 5.5.2.2. Instrument Cluster Displays
- 5.5.2.3. Head-up Displays (HUD)
- 5.5.3. Healthcare Displays
- 5.5.3.1. Medical Imaging
- 5.5.3.2. Diagnostic Displays
- 5.5.4. Retail Displays
- 5.5.4.1. Digital Signage
- 5.5.4.2. Kiosks
- 5.5.5. Industrial Displays
- 5.5.5.1. Control Panels
- 5.5.5.2. HMI (Human-Machine Interface) Devices
- 5.5.6. Others
- 5.5.6.1. Gaming Displays
- 5.5.6.2. Military & Defense
- 5.5.1. Consumer Electronics
- 5.6. Market Analysis, Insights and Forecast - by End-User
- 5.6.1. Commercial
- 5.6.2. Residential
- 5.6.3. Industrial
- 5.6.4. Healthcare
- 5.6.5. Automotive
- 5.7. Market Analysis, Insights and Forecast - by Region
- 5.7.1. North America
- 5.7.2. Europe
- 5.7.3. Asia Pacific
- 5.7.4. Latin America
- 5.7.5. MEA
- 5.1. Market Analysis, Insights and Forecast - by Technology
- 6. North America Display Market Analysis, Insights and Forecast, 2019-2031
- 6.1. Market Analysis, Insights and Forecast - by Technology
- 6.1.1. LCD (Liquid Crystal Display)
- 6.1.2. LED (Light Emitting Diode)
- 6.1.3. OLED (Organic Light Emitting Diode)
- 6.1.4. MicroLED
- 6.1.5. Quantum Dot
- 6.1.6. E-paper (Electronic Paper Display)
- 6.1.7. Plasma Display Panels
- 6.1.8. Projection Displays
- 6.2. Market Analysis, Insights and Forecast - by Display Type
- 6.2.1. Flat Panel Display
- 6.2.2. Flexible Display
- 6.2.3. Transparent Display
- 6.2.4. 3D Display
- 6.3. Market Analysis, Insights and Forecast - by Resolution
- 6.3.1. HD (High Definition)
- 6.3.2. Full HD
- 6.3.3. 4K UHD (Ultra High Definition)
- 6.3.4. 8K UHD
- 6.3.5. Others
- 6.4. Market Analysis, Insights and Forecast - by Panel Size
- 6.4.1. Small (Below 10 inches)
- 6.4.2. Medium (10–32 inches)
- 6.4.3. Large (Above 32 inches)
- 6.5. Market Analysis, Insights and Forecast - by Application, 2021 - 2032
- 6.5.1. Consumer Electronics
- 6.5.1.1. Smartphones
- 6.5.1.2. Tablets
- 6.5.1.3. Televisions
- 6.5.1.4. Laptops and Monitors
- 6.5.1.5. Wearable Devices
- 6.5.2. Automotive Displays
- 6.5.2.1. Infotainment Systems
- 6.5.2.2. Instrument Cluster Displays
- 6.5.2.3. Head-up Displays (HUD)
- 6.5.3. Healthcare Displays
- 6.5.3.1. Medical Imaging
- 6.5.3.2. Diagnostic Displays
- 6.5.4. Retail Displays
- 6.5.4.1. Digital Signage
- 6.5.4.2. Kiosks
- 6.5.5. Industrial Displays
- 6.5.5.1. Control Panels
- 6.5.5.2. HMI (Human-Machine Interface) Devices
- 6.5.6. Others
- 6.5.6.1. Gaming Displays
- 6.5.6.2. Military & Defense
- 6.5.1. Consumer Electronics
- 6.6. Market Analysis, Insights and Forecast - by End-User
- 6.6.1. Commercial
- 6.6.2. Residential
- 6.6.3. Industrial
- 6.6.4. Healthcare
- 6.6.5. Automotive
- 6.1. Market Analysis, Insights and Forecast - by Technology
- 7. Europe Display Market Analysis, Insights and Forecast, 2019-2031
- 7.1. Market Analysis, Insights and Forecast - by Technology
- 7.1.1. LCD (Liquid Crystal Display)
- 7.1.2. LED (Light Emitting Diode)
- 7.1.3. OLED (Organic Light Emitting Diode)
- 7.1.4. MicroLED
- 7.1.5. Quantum Dot
- 7.1.6. E-paper (Electronic Paper Display)
- 7.1.7. Plasma Display Panels
- 7.1.8. Projection Displays
- 7.2. Market Analysis, Insights and Forecast - by Display Type
- 7.2.1. Flat Panel Display
- 7.2.2. Flexible Display
- 7.2.3. Transparent Display
- 7.2.4. 3D Display
- 7.3. Market Analysis, Insights and Forecast - by Resolution
- 7.3.1. HD (High Definition)
- 7.3.2. Full HD
- 7.3.3. 4K UHD (Ultra High Definition)
- 7.3.4. 8K UHD
- 7.3.5. Others
- 7.4. Market Analysis, Insights and Forecast - by Panel Size
- 7.4.1. Small (Below 10 inches)
- 7.4.2. Medium (10–32 inches)
- 7.4.3. Large (Above 32 inches)
- 7.5. Market Analysis, Insights and Forecast - by Application, 2021 - 2032
- 7.5.1. Consumer Electronics
- 7.5.1.1. Smartphones
- 7.5.1.2. Tablets
- 7.5.1.3. Televisions
- 7.5.1.4. Laptops and Monitors
- 7.5.1.5. Wearable Devices
- 7.5.2. Automotive Displays
- 7.5.2.1. Infotainment Systems
- 7.5.2.2. Instrument Cluster Displays
- 7.5.2.3. Head-up Displays (HUD)
- 7.5.3. Healthcare Displays
- 7.5.3.1. Medical Imaging
- 7.5.3.2. Diagnostic Displays
- 7.5.4. Retail Displays
- 7.5.4.1. Digital Signage
- 7.5.4.2. Kiosks
- 7.5.5. Industrial Displays
- 7.5.5.1. Control Panels
- 7.5.5.2. HMI (Human-Machine Interface) Devices
- 7.5.6. Others
- 7.5.6.1. Gaming Displays
- 7.5.6.2. Military & Defense
- 7.5.1. Consumer Electronics
- 7.6. Market Analysis, Insights and Forecast - by End-User
- 7.6.1. Commercial
- 7.6.2. Residential
- 7.6.3. Industrial
- 7.6.4. Healthcare
- 7.6.5. Automotive
- 7.1. Market Analysis, Insights and Forecast - by Technology
- 8. Asia Pacific Display Market Analysis, Insights and Forecast, 2019-2031
- 8.1. Market Analysis, Insights and Forecast - by Technology
- 8.1.1. LCD (Liquid Crystal Display)
- 8.1.2. LED (Light Emitting Diode)
- 8.1.3. OLED (Organic Light Emitting Diode)
- 8.1.4. MicroLED
- 8.1.5. Quantum Dot
- 8.1.6. E-paper (Electronic Paper Display)
- 8.1.7. Plasma Display Panels
- 8.1.8. Projection Displays
- 8.2. Market Analysis, Insights and Forecast - by Display Type
- 8.2.1. Flat Panel Display
- 8.2.2. Flexible Display
- 8.2.3. Transparent Display
- 8.2.4. 3D Display
- 8.3. Market Analysis, Insights and Forecast - by Resolution
- 8.3.1. HD (High Definition)
- 8.3.2. Full HD
- 8.3.3. 4K UHD (Ultra High Definition)
- 8.3.4. 8K UHD
- 8.3.5. Others
- 8.4. Market Analysis, Insights and Forecast - by Panel Size
- 8.4.1. Small (Below 10 inches)
- 8.4.2. Medium (10–32 inches)
- 8.4.3. Large (Above 32 inches)
- 8.5. Market Analysis, Insights and Forecast - by Application, 2021 - 2032
- 8.5.1. Consumer Electronics
- 8.5.1.1. Smartphones
- 8.5.1.2. Tablets
- 8.5.1.3. Televisions
- 8.5.1.4. Laptops and Monitors
- 8.5.1.5. Wearable Devices
- 8.5.2. Automotive Displays
- 8.5.2.1. Infotainment Systems
- 8.5.2.2. Instrument Cluster Displays
- 8.5.2.3. Head-up Displays (HUD)
- 8.5.3. Healthcare Displays
- 8.5.3.1. Medical Imaging
- 8.5.3.2. Diagnostic Displays
- 8.5.4. Retail Displays
- 8.5.4.1. Digital Signage
- 8.5.4.2. Kiosks
- 8.5.5. Industrial Displays
- 8.5.5.1. Control Panels
- 8.5.5.2. HMI (Human-Machine Interface) Devices
- 8.5.6. Others
- 8.5.6.1. Gaming Displays
- 8.5.6.2. Military & Defense
- 8.5.1. Consumer Electronics
- 8.6. Market Analysis, Insights and Forecast - by End-User
- 8.6.1. Commercial
- 8.6.2. Residential
- 8.6.3. Industrial
- 8.6.4. Healthcare
- 8.6.5. Automotive
- 8.1. Market Analysis, Insights and Forecast - by Technology
- 9. Latin America Display Market Analysis, Insights and Forecast, 2019-2031
- 9.1. Market Analysis, Insights and Forecast - by Technology
- 9.1.1. LCD (Liquid Crystal Display)
- 9.1.2. LED (Light Emitting Diode)
- 9.1.3. OLED (Organic Light Emitting Diode)
- 9.1.4. MicroLED
- 9.1.5. Quantum Dot
- 9.1.6. E-paper (Electronic Paper Display)
- 9.1.7. Plasma Display Panels
- 9.1.8. Projection Displays
- 9.2. Market Analysis, Insights and Forecast - by Display Type
- 9.2.1. Flat Panel Display
- 9.2.2. Flexible Display
- 9.2.3. Transparent Display
- 9.2.4. 3D Display
- 9.3. Market Analysis, Insights and Forecast - by Resolution
- 9.3.1. HD (High Definition)
- 9.3.2. Full HD
- 9.3.3. 4K UHD (Ultra High Definition)
- 9.3.4. 8K UHD
- 9.3.5. Others
- 9.4. Market Analysis, Insights and Forecast - by Panel Size
- 9.4.1. Small (Below 10 inches)
- 9.4.2. Medium (10–32 inches)
- 9.4.3. Large (Above 32 inches)
- 9.5. Market Analysis, Insights and Forecast - by Application, 2021 - 2032
- 9.5.1. Consumer Electronics
- 9.5.1.1. Smartphones
- 9.5.1.2. Tablets
- 9.5.1.3. Televisions
- 9.5.1.4. Laptops and Monitors
- 9.5.1.5. Wearable Devices
- 9.5.2. Automotive Displays
- 9.5.2.1. Infotainment Systems
- 9.5.2.2. Instrument Cluster Displays
- 9.5.2.3. Head-up Displays (HUD)
- 9.5.3. Healthcare Displays
- 9.5.3.1. Medical Imaging
- 9.5.3.2. Diagnostic Displays
- 9.5.4. Retail Displays
- 9.5.4.1. Digital Signage
- 9.5.4.2. Kiosks
- 9.5.5. Industrial Displays
- 9.5.5.1. Control Panels
- 9.5.5.2. HMI (Human-Machine Interface) Devices
- 9.5.6. Others
- 9.5.6.1. Gaming Displays
- 9.5.6.2. Military & Defense
- 9.5.1. Consumer Electronics
- 9.6. Market Analysis, Insights and Forecast - by End-User
- 9.6.1. Commercial
- 9.6.2. Residential
- 9.6.3. Industrial
- 9.6.4. Healthcare
- 9.6.5. Automotive
- 9.1. Market Analysis, Insights and Forecast - by Technology
- 10. MEA Display Market Analysis, Insights and Forecast, 2019-2031
- 10.1. Market Analysis, Insights and Forecast - by Technology
- 10.1.1. LCD (Liquid Crystal Display)
- 10.1.2. LED (Light Emitting Diode)
- 10.1.3. OLED (Organic Light Emitting Diode)
- 10.1.4. MicroLED
- 10.1.5. Quantum Dot
- 10.1.6. E-paper (Electronic Paper Display)
- 10.1.7. Plasma Display Panels
- 10.1.8. Projection Displays
- 10.2. Market Analysis, Insights and Forecast - by Display Type
- 10.2.1. Flat Panel Display
- 10.2.2. Flexible Display
- 10.2.3. Transparent Display
- 10.2.4. 3D Display
- 10.3. Market Analysis, Insights and Forecast - by Resolution
- 10.3.1. HD (High Definition)
- 10.3.2. Full HD
- 10.3.3. 4K UHD (Ultra High Definition)
- 10.3.4. 8K UHD
- 10.3.5. Others
- 10.4. Market Analysis, Insights and Forecast - by Panel Size
- 10.4.1. Small (Below 10 inches)
- 10.4.2. Medium (10–32 inches)
- 10.4.3. Large (Above 32 inches)
- 10.5. Market Analysis, Insights and Forecast - by Application, 2021 - 2032
- 10.5.1. Consumer Electronics
- 10.5.1.1. Smartphones
- 10.5.1.2. Tablets
- 10.5.1.3. Televisions
- 10.5.1.4. Laptops and Monitors
- 10.5.1.5. Wearable Devices
- 10.5.2. Automotive Displays
- 10.5.2.1. Infotainment Systems
- 10.5.2.2. Instrument Cluster Displays
- 10.5.2.3. Head-up Displays (HUD)
- 10.5.3. Healthcare Displays
- 10.5.3.1. Medical Imaging
- 10.5.3.2. Diagnostic Displays
- 10.5.4. Retail Displays
- 10.5.4.1. Digital Signage
- 10.5.4.2. Kiosks
- 10.5.5. Industrial Displays
- 10.5.5.1. Control Panels
- 10.5.5.2. HMI (Human-Machine Interface) Devices
- 10.5.6. Others
- 10.5.6.1. Gaming Displays
- 10.5.6.2. Military & Defense
- 10.5.1. Consumer Electronics
- 10.6. Market Analysis, Insights and Forecast - by End-User
- 10.6.1. Commercial
- 10.6.2. Residential
- 10.6.3. Industrial
- 10.6.4. Healthcare
- 10.6.5. Automotive
- 10.1. Market Analysis, Insights and Forecast - by Technology
- 11. Competitive Analysis
- 11.1. Global Market Share Analysis 2024
- 11.2. Company Profiles
- 11.2.1 Samsung Electronics Co. Ltd.
- 11.2.1.1. Overview
- 11.2.1.2. Products
- 11.2.1.3. SWOT Analysis
- 11.2.1.4. Recent Developments
- 11.2.1.5. Financials (Based on Availability)
- 11.2.2 LG Display Co. Ltd.
- 11.2.2.1. Overview
- 11.2.2.2. Products
- 11.2.2.3. SWOT Analysis
- 11.2.2.4. Recent Developments
- 11.2.2.5. Financials (Based on Availability)
- 11.2.3 BOE Technology Group Co. Ltd.
- 11.2.3.1. Overview
- 11.2.3.2. Products
- 11.2.3.3. SWOT Analysis
- 11.2.3.4. Recent Developments
- 11.2.3.5. Financials (Based on Availability)
- 11.2.4 AU Optronics Corp.
- 11.2.4.1. Overview
- 11.2.4.2. Products
- 11.2.4.3. SWOT Analysis
- 11.2.4.4. Recent Developments
- 11.2.4.5. Financials (Based on Availability)
- 11.2.5 Innolux Corporation
- 11.2.5.1. Overview
- 11.2.5.2. Products
- 11.2.5.3. SWOT Analysis
- 11.2.5.4. Recent Developments
- 11.2.5.5. Financials (Based on Availability)
- 11.2.6 Sharp Corporation
- 11.2.6.1. Overview
- 11.2.6.2. Products
- 11.2.6.3. SWOT Analysis
- 11.2.6.4. Recent Developments
- 11.2.6.5. Financials (Based on Availability)
- 11.2.1 Samsung Electronics Co. Ltd.
- Figure 1: Global Display Market Revenue Breakdown (Billion, %) by Region 2024 & 2032
- Figure 2: Global Display Market Volume Breakdown (K Tons, %) by Region 2024 & 2032
- Figure 3: North America Display Market Revenue (Billion), by Technology 2024 & 2032
- Figure 4: North America Display Market Volume (K Tons), by Technology 2024 & 2032
- Figure 5: North America Display Market Revenue Share (%), by Technology 2024 & 2032
- Figure 6: North America Display Market Volume Share (%), by Technology 2024 & 2032
- Figure 7: North America Display Market Revenue (Billion), by Display Type 2024 & 2032
- Figure 8: North America Display Market Volume (K Tons), by Display Type 2024 & 2032
- Figure 9: North America Display Market Revenue Share (%), by Display Type 2024 & 2032
- Figure 10: North America Display Market Volume Share (%), by Display Type 2024 & 2032
- Figure 11: North America Display Market Revenue (Billion), by Resolution 2024 & 2032
- Figure 12: North America Display Market Volume (K Tons), by Resolution 2024 & 2032
- Figure 13: North America Display Market Revenue Share (%), by Resolution 2024 & 2032
- Figure 14: North America Display Market Volume Share (%), by Resolution 2024 & 2032
- Figure 15: North America Display Market Revenue (Billion), by Panel Size 2024 & 2032
- Figure 16: North America Display Market Volume (K Tons), by Panel Size 2024 & 2032
- Figure 17: North America Display Market Revenue Share (%), by Panel Size 2024 & 2032
- Figure 18: North America Display Market Volume Share (%), by Panel Size 2024 & 2032
- Figure 19: North America Display Market Revenue (Billion), by Application, 2021 - 2032 2024 & 2032
- Figure 20: North America Display Market Volume (K Tons), by Application, 2021 - 2032 2024 & 2032
- Figure 21: North America Display Market Revenue Share (%), by Application, 2021 - 2032 2024 & 2032
- Figure 22: North America Display Market Volume Share (%), by Application, 2021 - 2032 2024 & 2032
- Figure 23: North America Display Market Revenue (Billion), by End-User 2024 & 2032
- Figure 24: North America Display Market Volume (K Tons), by End-User 2024 & 2032
- Figure 25: North America Display Market Revenue Share (%), by End-User 2024 & 2032
- Figure 26: North America Display Market Volume Share (%), by End-User 2024 & 2032
- Figure 27: North America Display Market Revenue (Billion), by Country 2024 & 2032
- Figure 28: North America Display Market Volume (K Tons), by Country 2024 & 2032
- Figure 29: North America Display Market Revenue Share (%), by Country 2024 & 2032
- Figure 30: North America Display Market Volume Share (%), by Country 2024 & 2032
- Figure 31: Europe Display Market Revenue (Billion), by Technology 2024 & 2032
- Figure 32: Europe Display Market Volume (K Tons), by Technology 2024 & 2032
- Figure 33: Europe Display Market Revenue Share (%), by Technology 2024 & 2032
- Figure 34: Europe Display Market Volume Share (%), by Technology 2024 & 2032
- Figure 35: Europe Display Market Revenue (Billion), by Display Type 2024 & 2032
- Figure 36: Europe Display Market Volume (K Tons), by Display Type 2024 & 2032
- Figure 37: Europe Display Market Revenue Share (%), by Display Type 2024 & 2032
- Figure 38: Europe Display Market Volume Share (%), by Display Type 2024 & 2032
- Figure 39: Europe Display Market Revenue (Billion), by Resolution 2024 & 2032
- Figure 40: Europe Display Market Volume (K Tons), by Resolution 2024 & 2032
- Figure 41: Europe Display Market Revenue Share (%), by Resolution 2024 & 2032
- Figure 42: Europe Display Market Volume Share (%), by Resolution 2024 & 2032
- Figure 43: Europe Display Market Revenue (Billion), by Panel Size 2024 & 2032
- Figure 44: Europe Display Market Volume (K Tons), by Panel Size 2024 & 2032
- Figure 45: Europe Display Market Revenue Share (%), by Panel Size 2024 & 2032
- Figure 46: Europe Display Market Volume Share (%), by Panel Size 2024 & 2032
- Figure 47: Europe Display Market Revenue (Billion), by Application, 2021 - 2032 2024 & 2032
- Figure 48: Europe Display Market Volume (K Tons), by Application, 2021 - 2032 2024 & 2032
- Figure 49: Europe Display Market Revenue Share (%), by Application, 2021 - 2032 2024 & 2032
- Figure 50: Europe Display Market Volume Share (%), by Application, 2021 - 2032 2024 & 2032
- Figure 51: Europe Display Market Revenue (Billion), by End-User 2024 & 2032
- Figure 52: Europe Display Market Volume (K Tons), by End-User 2024 & 2032
- Figure 53: Europe Display Market Revenue Share (%), by End-User 2024 & 2032
- Figure 54: Europe Display Market Volume Share (%), by End-User 2024 & 2032
- Figure 55: Europe Display Market Revenue (Billion), by Country 2024 & 2032
- Figure 56: Europe Display Market Volume (K Tons), by Country 2024 & 2032
- Figure 57: Europe Display Market Revenue Share (%), by Country 2024 & 2032
- Figure 58: Europe Display Market Volume Share (%), by Country 2024 & 2032
- Figure 59: Asia Pacific Display Market Revenue (Billion), by Technology 2024 & 2032
- Figure 60: Asia Pacific Display Market Volume (K Tons), by Technology 2024 & 2032
- Figure 61: Asia Pacific Display Market Revenue Share (%), by Technology 2024 & 2032
- Figure 62: Asia Pacific Display Market Volume Share (%), by Technology 2024 & 2032
- Figure 63: Asia Pacific Display Market Revenue (Billion), by Display Type 2024 & 2032
- Figure 64: Asia Pacific Display Market Volume (K Tons), by Display Type 2024 & 2032
- Figure 65: Asia Pacific Display Market Revenue Share (%), by Display Type 2024 & 2032
- Figure 66: Asia Pacific Display Market Volume Share (%), by Display Type 2024 & 2032
- Figure 67: Asia Pacific Display Market Revenue (Billion), by Resolution 2024 & 2032
- Figure 68: Asia Pacific Display Market Volume (K Tons), by Resolution 2024 & 2032
- Figure 69: Asia Pacific Display Market Revenue Share (%), by Resolution 2024 & 2032
- Figure 70: Asia Pacific Display Market Volume Share (%), by Resolution 2024 & 2032
- Figure 71: Asia Pacific Display Market Revenue (Billion), by Panel Size 2024 & 2032
- Figure 72: Asia Pacific Display Market Volume (K Tons), by Panel Size 2024 & 2032
- Figure 73: Asia Pacific Display Market Revenue Share (%), by Panel Size 2024 & 2032
- Figure 74: Asia Pacific Display Market Volume Share (%), by Panel Size 2024 & 2032
- Figure 75: Asia Pacific Display Market Revenue (Billion), by Application, 2021 - 2032 2024 & 2032
- Figure 76: Asia Pacific Display Market Volume (K Tons), by Application, 2021 - 2032 2024 & 2032
- Figure 77: Asia Pacific Display Market Revenue Share (%), by Application, 2021 - 2032 2024 & 2032
- Figure 78: Asia Pacific Display Market Volume Share (%), by Application, 2021 - 2032 2024 & 2032
- Figure 79: Asia Pacific Display Market Revenue (Billion), by End-User 2024 & 2032
- Figure 80: Asia Pacific Display Market Volume (K Tons), by End-User 2024 & 2032
- Figure 81: Asia Pacific Display Market Revenue Share (%), by End-User 2024 & 2032
- Figure 82: Asia Pacific Display Market Volume Share (%), by End-User 2024 & 2032
- Figure 83: Asia Pacific Display Market Revenue (Billion), by Country 2024 & 2032
- Figure 84: Asia Pacific Display Market Volume (K Tons), by Country 2024 & 2032
- Figure 85: Asia Pacific Display Market Revenue Share (%), by Country 2024 & 2032
- Figure 86: Asia Pacific Display Market Volume Share (%), by Country 2024 & 2032
- Figure 87: Latin America Display Market Revenue (Billion), by Technology 2024 & 2032
- Figure 88: Latin America Display Market Volume (K Tons), by Technology 2024 & 2032
- Figure 89: Latin America Display Market Revenue Share (%), by Technology 2024 & 2032
- Figure 90: Latin America Display Market Volume Share (%), by Technology 2024 & 2032
- Figure 91: Latin America Display Market Revenue (Billion), by Display Type 2024 & 2032
- Figure 92: Latin America Display Market Volume (K Tons), by Display Type 2024 & 2032
- Figure 93: Latin America Display Market Revenue Share (%), by Display Type 2024 & 2032
- Figure 94: Latin America Display Market Volume Share (%), by Display Type 2024 & 2032
- Figure 95: Latin America Display Market Revenue (Billion), by Resolution 2024 & 2032
- Figure 96: Latin America Display Market Volume (K Tons), by Resolution 2024 & 2032
- Figure 97: Latin America Display Market Revenue Share (%), by Resolution 2024 & 2032
- Figure 98: Latin America Display Market Volume Share (%), by Resolution 2024 & 2032
- Figure 99: Latin America Display Market Revenue (Billion), by Panel Size 2024 & 2032
- Figure 100: Latin America Display Market Volume (K Tons), by Panel Size 2024 & 2032
- Figure 101: Latin America Display Market Revenue Share (%), by Panel Size 2024 & 2032
- Figure 102: Latin America Display Market Volume Share (%), by Panel Size 2024 & 2032
- Figure 103: Latin America Display Market Revenue (Billion), by Application, 2021 - 2032 2024 & 2032
- Figure 104: Latin America Display Market Volume (K Tons), by Application, 2021 - 2032 2024 & 2032
- Figure 105: Latin America Display Market Revenue Share (%), by Application, 2021 - 2032 2024 & 2032
- Figure 106: Latin America Display Market Volume Share (%), by Application, 2021 - 2032 2024 & 2032
- Figure 107: Latin America Display Market Revenue (Billion), by End-User 2024 & 2032
- Figure 108: Latin America Display Market Volume (K Tons), by End-User 2024 & 2032
- Figure 109: Latin America Display Market Revenue Share (%), by End-User 2024 & 2032
- Figure 110: Latin America Display Market Volume Share (%), by End-User 2024 & 2032
- Figure 111: Latin America Display Market Revenue (Billion), by Country 2024 & 2032
- Figure 112: Latin America Display Market Volume (K Tons), by Country 2024 & 2032
- Figure 113: Latin America Display Market Revenue Share (%), by Country 2024 & 2032
- Figure 114: Latin America Display Market Volume Share (%), by Country 2024 & 2032
- Figure 115: MEA Display Market Revenue (Billion), by Technology 2024 & 2032
- Figure 116: MEA Display Market Volume (K Tons), by Technology 2024 & 2032
- Figure 117: MEA Display Market Revenue Share (%), by Technology 2024 & 2032
- Figure 118: MEA Display Market Volume Share (%), by Technology 2024 & 2032
- Figure 119: MEA Display Market Revenue (Billion), by Display Type 2024 & 2032
- Figure 120: MEA Display Market Volume (K Tons), by Display Type 2024 & 2032
- Figure 121: MEA Display Market Revenue Share (%), by Display Type 2024 & 2032
- Figure 122: MEA Display Market Volume Share (%), by Display Type 2024 & 2032
- Figure 123: MEA Display Market Revenue (Billion), by Resolution 2024 & 2032
- Figure 124: MEA Display Market Volume (K Tons), by Resolution 2024 & 2032
- Figure 125: MEA Display Market Revenue Share (%), by Resolution 2024 & 2032
- Figure 126: MEA Display Market Volume Share (%), by Resolution 2024 & 2032
- Figure 127: MEA Display Market Revenue (Billion), by Panel Size 2024 & 2032
- Figure 128: MEA Display Market Volume (K Tons), by Panel Size 2024 & 2032
- Figure 129: MEA Display Market Revenue Share (%), by Panel Size 2024 & 2032
- Figure 130: MEA Display Market Volume Share (%), by Panel Size 2024 & 2032
- Figure 131: MEA Display Market Revenue (Billion), by Application, 2021 - 2032 2024 & 2032
- Figure 132: MEA Display Market Volume (K Tons), by Application, 2021 - 2032 2024 & 2032
- Figure 133: MEA Display Market Revenue Share (%), by Application, 2021 - 2032 2024 & 2032
- Figure 134: MEA Display Market Volume Share (%), by Application, 2021 - 2032 2024 & 2032
- Figure 135: MEA Display Market Revenue (Billion), by End-User 2024 & 2032
- Figure 136: MEA Display Market Volume (K Tons), by End-User 2024 & 2032
- Figure 137: MEA Display Market Revenue Share (%), by End-User 2024 & 2032
- Figure 138: MEA Display Market Volume Share (%), by End-User 2024 & 2032
- Figure 139: MEA Display Market Revenue (Billion), by Country 2024 & 2032
- Figure 140: MEA Display Market Volume (K Tons), by Country 2024 & 2032
- Figure 141: MEA Display Market Revenue Share (%), by Country 2024 & 2032
- Figure 142: MEA Display Market Volume Share (%), by Country 2024 & 2032
- Table 1: Global Display Market Revenue Billion Forecast, by Region 2019 & 2032
- Table 2: Global Display Market Volume K Tons Forecast, by Region 2019 & 2032
- Table 3: Global Display Market Revenue Billion Forecast, by Technology 2019 & 2032
- Table 4: Global Display Market Volume K Tons Forecast, by Technology 2019 & 2032
- Table 5: Global Display Market Revenue Billion Forecast, by Display Type 2019 & 2032
- Table 6: Global Display Market Volume K Tons Forecast, by Display Type 2019 & 2032
- Table 7: Global Display Market Revenue Billion Forecast, by Resolution 2019 & 2032
- Table 8: Global Display Market Volume K Tons Forecast, by Resolution 2019 & 2032
- Table 9: Global Display Market Revenue Billion Forecast, by Panel Size 2019 & 2032
- Table 10: Global Display Market Volume K Tons Forecast, by Panel Size 2019 & 2032
- Table 11: Global Display Market Revenue Billion Forecast, by Application, 2021 - 2032 2019 & 2032
- Table 12: Global Display Market Volume K Tons Forecast, by Application, 2021 - 2032 2019 & 2032
- Table 13: Global Display Market Revenue Billion Forecast, by End-User 2019 & 2032
- Table 14: Global Display Market Volume K Tons Forecast, by End-User 2019 & 2032
- Table 15: Global Display Market Revenue Billion Forecast, by Region 2019 & 2032
- Table 16: Global Display Market Volume K Tons Forecast, by Region 2019 & 2032
- Table 17: Global Display Market Revenue Billion Forecast, by Technology 2019 & 2032
- Table 18: Global Display Market Volume K Tons Forecast, by Technology 2019 & 2032
- Table 19: Global Display Market Revenue Billion Forecast, by Display Type 2019 & 2032
- Table 20: Global Display Market Volume K Tons Forecast, by Display Type 2019 & 2032
- Table 21: Global Display Market Revenue Billion Forecast, by Resolution 2019 & 2032
- Table 22: Global Display Market Volume K Tons Forecast, by Resolution 2019 & 2032
- Table 23: Global Display Market Revenue Billion Forecast, by Panel Size 2019 & 2032
- Table 24: Global Display Market Volume K Tons Forecast, by Panel Size 2019 & 2032
- Table 25: Global Display Market Revenue Billion Forecast, by Application, 2021 - 2032 2019 & 2032
- Table 26: Global Display Market Volume K Tons Forecast, by Application, 2021 - 2032 2019 & 2032
- Table 27: Global Display Market Revenue Billion Forecast, by End-User 2019 & 2032
- Table 28: Global Display Market Volume K Tons Forecast, by End-User 2019 & 2032
- Table 29: Global Display Market Revenue Billion Forecast, by Country 2019 & 2032
- Table 30: Global Display Market Volume K Tons Forecast, by Country 2019 & 2032
- Table 31: U.S. Display Market Revenue (Billion) Forecast, by Application 2019 & 2032
- Table 32: U.S. Display Market Volume (K Tons) Forecast, by Application 2019 & 2032
- Table 33: Canada Display Market Revenue (Billion) Forecast, by Application 2019 & 2032
- Table 34: Canada Display Market Volume (K Tons) Forecast, by Application 2019 & 2032
- Table 35: Global Display Market Revenue Billion Forecast, by Technology 2019 & 2032
- Table 36: Global Display Market Volume K Tons Forecast, by Technology 2019 & 2032
- Table 37: Global Display Market Revenue Billion Forecast, by Display Type 2019 & 2032
- Table 38: Global Display Market Volume K Tons Forecast, by Display Type 2019 & 2032
- Table 39: Global Display Market Revenue Billion Forecast, by Resolution 2019 & 2032
- Table 40: Global Display Market Volume K Tons Forecast, by Resolution 2019 & 2032
- Table 41: Global Display Market Revenue Billion Forecast, by Panel Size 2019 & 2032
- Table 42: Global Display Market Volume K Tons Forecast, by Panel Size 2019 & 2032
- Table 43: Global Display Market Revenue Billion Forecast, by Application, 2021 - 2032 2019 & 2032
- Table 44: Global Display Market Volume K Tons Forecast, by Application, 2021 - 2032 2019 & 2032
- Table 45: Global Display Market Revenue Billion Forecast, by End-User 2019 & 2032
- Table 46: Global Display Market Volume K Tons Forecast, by End-User 2019 & 2032
- Table 47: Global Display Market Revenue Billion Forecast, by Country 2019 & 2032
- Table 48: Global Display Market Volume K Tons Forecast, by Country 2019 & 2032
- Table 49: Germany Display Market Revenue (Billion) Forecast, by Application 2019 & 2032
- Table 50: Germany Display Market Volume (K Tons) Forecast, by Application 2019 & 2032
- Table 51: UK Display Market Revenue (Billion) Forecast, by Application 2019 & 2032
- Table 52: UK Display Market Volume (K Tons) Forecast, by Application 2019 & 2032
- Table 53: France Display Market Revenue (Billion) Forecast, by Application 2019 & 2032
- Table 54: France Display Market Volume (K Tons) Forecast, by Application 2019 & 2032
- Table 55: Italy Display Market Revenue (Billion) Forecast, by Application 2019 & 2032
- Table 56: Italy Display Market Volume (K Tons) Forecast, by Application 2019 & 2032
- Table 57: Spain Display Market Revenue (Billion) Forecast, by Application 2019 & 2032
- Table 58: Spain Display Market Volume (K Tons) Forecast, by Application 2019 & 2032
- Table 59: Rest of Europe Display Market Revenue (Billion) Forecast, by Application 2019 & 2032
- Table 60: Rest of Europe Display Market Volume (K Tons) Forecast, by Application 2019 & 2032
- Table 61: Global Display Market Revenue Billion Forecast, by Technology 2019 & 2032
- Table 62: Global Display Market Volume K Tons Forecast, by Technology 2019 & 2032
- Table 63: Global Display Market Revenue Billion Forecast, by Display Type 2019 & 2032
- Table 64: Global Display Market Volume K Tons Forecast, by Display Type 2019 & 2032
- Table 65: Global Display Market Revenue Billion Forecast, by Resolution 2019 & 2032
- Table 66: Global Display Market Volume K Tons Forecast, by Resolution 2019 & 2032
- Table 67: Global Display Market Revenue Billion Forecast, by Panel Size 2019 & 2032
- Table 68: Global Display Market Volume K Tons Forecast, by Panel Size 2019 & 2032
- Table 69: Global Display Market Revenue Billion Forecast, by Application, 2021 - 2032 2019 & 2032
- Table 70: Global Display Market Volume K Tons Forecast, by Application, 2021 - 2032 2019 & 2032
- Table 71: Global Display Market Revenue Billion Forecast, by End-User 2019 & 2032
- Table 72: Global Display Market Volume K Tons Forecast, by End-User 2019 & 2032
- Table 73: Global Display Market Revenue Billion Forecast, by Country 2019 & 2032
- Table 74: Global Display Market Volume K Tons Forecast, by Country 2019 & 2032
- Table 75: China Display Market Revenue (Billion) Forecast, by Application 2019 & 2032
- Table 76: China Display Market Volume (K Tons) Forecast, by Application 2019 & 2032
- Table 77: India Display Market Revenue (Billion) Forecast, by Application 2019 & 2032
- Table 78: India Display Market Volume (K Tons) Forecast, by Application 2019 & 2032
- Table 79: Japan Display Market Revenue (Billion) Forecast, by Application 2019 & 2032
- Table 80: Japan Display Market Volume (K Tons) Forecast, by Application 2019 & 2032
- Table 81: South Korea Display Market Revenue (Billion) Forecast, by Application 2019 & 2032
- Table 82: South Korea Display Market Volume (K Tons) Forecast, by Application 2019 & 2032
- Table 83: ANZ Display Market Revenue (Billion) Forecast, by Application 2019 & 2032
- Table 84: ANZ Display Market Volume (K Tons) Forecast, by Application 2019 & 2032
- Table 85: Rest of Asia Pacific Display Market Revenue (Billion) Forecast, by Application 2019 & 2032
- Table 86: Rest of Asia Pacific Display Market Volume (K Tons) Forecast, by Application 2019 & 2032
- Table 87: Global Display Market Revenue Billion Forecast, by Technology 2019 & 2032
- Table 88: Global Display Market Volume K Tons Forecast, by Technology 2019 & 2032
- Table 89: Global Display Market Revenue Billion Forecast, by Display Type 2019 & 2032
- Table 90: Global Display Market Volume K Tons Forecast, by Display Type 2019 & 2032
- Table 91: Global Display Market Revenue Billion Forecast, by Resolution 2019 & 2032
- Table 92: Global Display Market Volume K Tons Forecast, by Resolution 2019 & 2032
- Table 93: Global Display Market Revenue Billion Forecast, by Panel Size 2019 & 2032
- Table 94: Global Display Market Volume K Tons Forecast, by Panel Size 2019 & 2032
- Table 95: Global Display Market Revenue Billion Forecast, by Application, 2021 - 2032 2019 & 2032
- Table 96: Global Display Market Volume K Tons Forecast, by Application, 2021 - 2032 2019 & 2032
- Table 97: Global Display Market Revenue Billion Forecast, by End-User 2019 & 2032
- Table 98: Global Display Market Volume K Tons Forecast, by End-User 2019 & 2032
- Table 99: Global Display Market Revenue Billion Forecast, by Country 2019 & 2032
- Table 100: Global Display Market Volume K Tons Forecast, by Country 2019 & 2032
- Table 101: Brazil Display Market Revenue (Billion) Forecast, by Application 2019 & 2032
- Table 102: Brazil Display Market Volume (K Tons) Forecast, by Application 2019 & 2032
- Table 103: Mexico Display Market Revenue (Billion) Forecast, by Application 2019 & 2032
- Table 104: Mexico Display Market Volume (K Tons) Forecast, by Application 2019 & 2032
- Table 105: Rest of Latin America Display Market Revenue (Billion) Forecast, by Application 2019 & 2032
- Table 106: Rest of Latin America Display Market Volume (K Tons) Forecast, by Application 2019 & 2032
- Table 107: Global Display Market Revenue Billion Forecast, by Technology 2019 & 2032
- Table 108: Global Display Market Volume K Tons Forecast, by Technology 2019 & 2032
- Table 109: Global Display Market Revenue Billion Forecast, by Display Type 2019 & 2032
- Table 110: Global Display Market Volume K Tons Forecast, by Display Type 2019 & 2032
- Table 111: Global Display Market Revenue Billion Forecast, by Resolution 2019 & 2032
- Table 112: Global Display Market Volume K Tons Forecast, by Resolution 2019 & 2032
- Table 113: Global Display Market Revenue Billion Forecast, by Panel Size 2019 & 2032
- Table 114: Global Display Market Volume K Tons Forecast, by Panel Size 2019 & 2032
- Table 115: Global Display Market Revenue Billion Forecast, by Application, 2021 - 2032 2019 & 2032
- Table 116: Global Display Market Volume K Tons Forecast, by Application, 2021 - 2032 2019 & 2032
- Table 117: Global Display Market Revenue Billion Forecast, by End-User 2019 & 2032
- Table 118: Global Display Market Volume K Tons Forecast, by End-User 2019 & 2032
- Table 119: Global Display Market Revenue Billion Forecast, by Country 2019 & 2032
- Table 120: Global Display Market Volume K Tons Forecast, by Country 2019 & 2032
- Table 121: UAE Display Market Revenue (Billion) Forecast, by Application 2019 & 2032
- Table 122: UAE Display Market Volume (K Tons) Forecast, by Application 2019 & 2032
- Table 123: Saudi Arabia Display Market Revenue (Billion) Forecast, by Application 2019 & 2032
- Table 124: Saudi Arabia Display Market Volume (K Tons) Forecast, by Application 2019 & 2032
- Table 125: South Africa Display Market Revenue (Billion) Forecast, by Application 2019 & 2032
- Table 126: South Africa Display Market Volume (K Tons) Forecast, by Application 2019 & 2032
- Table 127: Rest of MEA Display Market Revenue (Billion) Forecast, by Application 2019 & 2032
- Table 128: Rest of MEA Display Market Volume (K Tons) Forecast, by Application 2019 & 2032
STEP 1 - Identification of Relevant Samples Size from Population Database


STEP 2 - Approaches for Defining Global Market Size (Value, Volume* & Price*)

Note* : In applicable scenarios
STEP 3 - Data Sources
Primary Research
- Web Analytics
- Survey Reports
- Research Institute
- Latest Research Reports
- Opinion Leaders
Secondary Research
- Annual Reports
- White Paper
- Latest Press Release
- Industry Association
- Paid Database
- Investor Presentations

STEP 4 - Data Triangulation
Involves using different sources of information in order to increase the validity of a study
These sources are likely to be stakeholders in a program - participants, other researchers, program staff, other community members, and so on.
Then we put all data in single framework & apply various statistical tools to find out the dynamic on the market.
During the analysis stage, feedback from the stakeholder groups would be compared to determine areas of agreement as well as areas of divergence
Frequently Asked Questions
Related Reports
See the similar reports


About Market Insights Report
Market Insights Reports offers comprehensive market research reports and analysis, giving businesses important information about their clients, rivals, and sector to help them make well-informed decisions on operations, marketing, and business strategy. We offer a variety of services in addition to market research, data analysis, and strategy planning. In order to find opportunities and learn more about our competitors and the industry at large, we employ competitive analysis. To identify areas for development, we also evaluate our performance against that of our rivals. We can determine the places at which we can offer our clients the most value by performing value chain analysis.
Additionally, clients receive a thorough overview of their industry business environment. We can find trends that help us forecast future possibilities and threats by examining global macroeconomic dynamics and consumer behavior patterns. By analyzing their features and advantages, contrasting them with comparable items on the market, and evaluating both their quantitative and qualitative performance, we comprehensively evaluate our clients' products. This allows us to assist customers in determining how their goods compare to those of their rivals and in creating successful marketing plans. Our group has been successful in gaining a thorough grasp of our clients' requirements and offering them creative solutions. We currently provide services to more than 50 nations in Europe, the Middle East, Africa, Latin America, Asia Pacific, and North America. Because of our global reach, we have been able to establish trusting bonds with our partners and clients in various nations, improving customer service and forging a more cohesive worldwide presence.