
.jpg&w=3840&q=100)
Market
Insights
Reports delivered globally, covering a wide range of industries and sectors.
Clients who trust our expertise and rely on our insights for business decisions.
Managed Reports, ensuring seamless updates and premium service.
Satisfied Customers, committed to delivering exceptional value and quality.
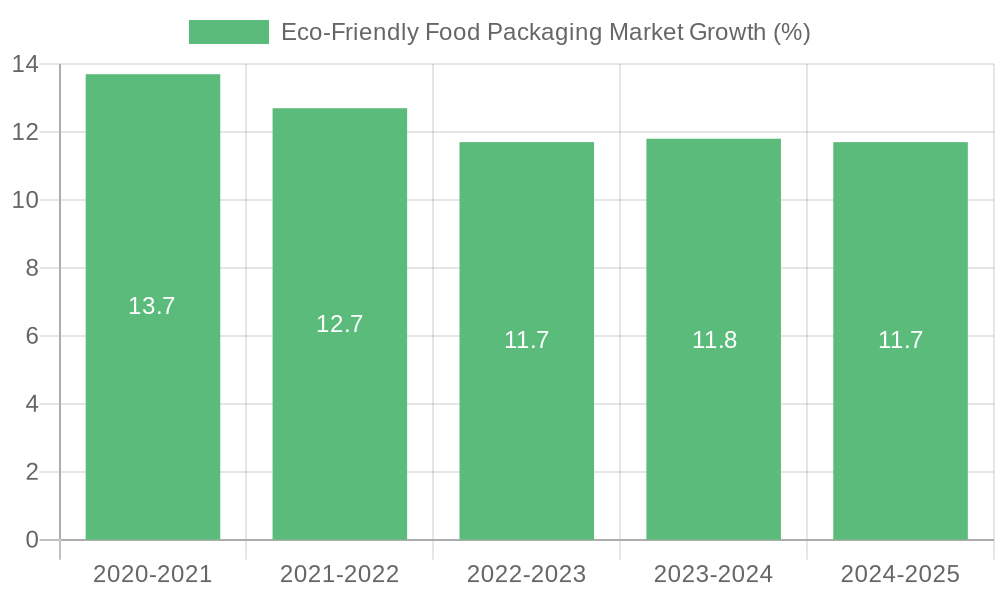
Eco-Friendly Food Packaging Market 2025 to Grow at 6.5 CAGR with 170 Billion Market Size: Analysis and Forecasts 2033
Eco-Friendly Food Packaging Market by Eco-Friendly Food Packaging Material (Biodegradable, Recyclable, Compostable), by Eco-Friendly Food Packaging Product Type (Bags, Containers, Boxes and cartons, Bottles and Jars, Others), by Eco-Friendly Food Packaging End-User Industry (Foodservice, Retail, Food Processing), by North America (U.S., Canada), by Europe (Germany, UK, France, Italy, Spain, Rest of Europe), by Asia Pacific (China, Japan, India, South Korea, ANZ, Rest of Asia Pacific), by Latin America (Brazil, Mexico, Rest of Latin America), by MEA (UAE, Saudi Arabia, South Africa, Rest of MEA) Forecast 2025-2033
Eco-Friendly Food Packaging Market 2025 to Grow at 6.5 CAGR with 170 Billion Market Size: Analysis and Forecasts 2033
Key Insights
The size of the Eco-Friendly Food Packaging Market was valued at USD 170 Billion in 2024 and is projected to reach USD 264.18 Billion by 2033, with an expected CAGR of 6.5% during the forecast period. The Eco-Conscious Food Packaging Market emphasizes the creation and use of sustainable packaging options aimed at minimizing environmental harm while maintaining the safety and freshness of food items. This market comprises packaging materials created from biodegradable, recyclable, or compostable substances, including plant-based plastics, paper, edible films, and recycled items. The expansion of this market is propelled by rising consumer demand for eco-friendly packaging and more stringent regulations regarding single-use plastics and packaging waste. Both consumers and businesses are progressively focusing on sustainability, with numerous food producers aiming to minimize their carbon emissions and align with environmentally aware trends. Sustainable food packaging aids in waste reduction, decreases energy use in manufacturing, and lessens pollution, supporting a circular economy. The market gains from advancements in packaging design and material technologies, allowing for the creation of packaging that is functional as well as eco-friendly. With sustainability being emphasized across various sectors, the Eco-Friendly Food Packaging Market is projected to grow, propelled by ongoing innovations in materials and packaging options.

Eco-Friendly Food Packaging Market Concentration & Characteristics
The Eco-Friendly Food Packaging Market is fragmented with numerous players operating in different segments. Key players in the market include Be Green Packaging, Inc., Biopak Pty Ltd, Biomass Packaging, Eco-Products, Inc., Daio Paper construction, Gascogne Papier, Glatfelter Corporation, Genpak LLC, Green Pack, Nordic Paper AB, PacknWood, Stora Enso Oyj, Sulapac Ltd, and Vegware Ltd. The market is characterized by innovation, with companies investing in research and development to enhance the sustainability and functionality of their products. Regulations, such as the ban on single-use plastics, have also played a significant role in shaping the market landscape. Product substitutes, such as reusable containers and wraps, are becoming increasingly popular in the Foodservice end-user industry. The market also exhibits a high level of M&A activity, as companies seek to expand their product offerings and geographical reach.
Eco-Friendly Food Packaging Market Trends
Key market insights include the growing adoption of biodegradable materials, such as plant-based plastics and compostable films, in food packaging. Reusable packaging is gaining traction, especially in the retail sector, as consumers seek sustainable alternatives to single-use packaging. Technological advancements, such as smart packaging, are also expected to drive market growth. The increasing demand for convenience food products, such as ready-to-eat meals and on-the-go snacks, is further fueling the adoption of eco-friendly food packaging solutions.
Key Region or Country & Segment to Dominate the Market
- Region: Asia Pacific is projected to be the fastest-growing region in the Eco-Friendly Food Packaging Market, due to increasing consumer awareness, government regulations, and rising food consumption.
- Country: China is the largest market for eco-friendly food packaging in the world, driven by strict government regulations and a large consumer base.
- Segment: Biodegradable materials are expected to dominate the Eco-Friendly Food Packaging Market, driven by their environmental benefits and increasing consumer preference for sustainable products.
Eco-Friendly Food Packaging Market Product Insights Report Coverage & Deliverables
The Eco-Friendly Food Packaging Market report provides comprehensive insights on the market size, market share, growth rate, and key trends. It also includes an analysis of the market by material type, product type, end-user industry, and region. The report offers a competitive landscape, including company profiles, market positioning, and strategies. This report is a valuable resource for industry stakeholders, including manufacturers, suppliers, distributors, retailers, and end-user industries.
Eco-Friendly Food Packaging Market Analysis
The Eco-Friendly Food Packaging Market is expected to grow steadily over the forecast period, driven by increasing consumer demand for sustainable products and government regulations. The market is characterized by intense competition and ongoing innovation. Key players are focusing on developing innovative and sustainable packaging solutions to meet the changing needs of consumers and regulatory requirements.
Eco-Friendly Food Packaging Market Regional Insights
- North America: The U.S. dominates the North American Eco-Friendly Food Packaging Market, driven by high consumer awareness and stringent environmental regulations.
- Europe: The European Union is a significant market for eco-friendly food packaging, with regulations promoting the use of sustainable materials.
- Asia Pacific: Asia Pacific is the fastest-growing region in the Eco-Friendly Food Packaging Market, with China, India, and Japan being major contributors.
- Latin America: Latin America is a growing market for eco-friendly food packaging, with countries such as Brazil and Mexico implementing regulations to reduce plastic consumption.
- MEA: The MEA region is expected to witness significant growth in the Eco-Friendly Food Packaging Market, driven by increasing urbanization and changing consumer lifestyles.
Driving Forces: What's Propelling the Eco-Friendly Food Packaging Market
- Increasing consumer awareness about environmental sustainability
- Government regulations promoting eco-friendly packaging
- Rising food security concerns
- Technological advancements in packaging materials and designs
- Increasing demand for convenience food products
Challenges and Restraints in Eco-Friendly Food Packaging Market
- Higher cost of eco-friendly packaging materials
- Lack of infrastructure for composting and recycling
- Consumer resistance to change
- Limited availability of sustainable alternatives for all packaging applications
Emerging Trends in Eco-Friendly Food Packaging Market
- Growing adoption of biodegradable materials
- Reusable packaging solutions gaining traction
- Technological advancements in smart packaging
- Increasing demand for sustainable food packaging in e-commerce
Eco-Friendly Food Packaging Industry News
- In 2022, ProAmpac, a US-based company engaged in offering creative and sustainable packaging products, acquired Ultimate Packaging Ltd., a UK-based company involved in offering creative solutions, for an undisclosed amount. Through this acquisition, ProAmpac widens its sustainable product portfolio, expands its reach across the U.K., and improves its position in creative food packaging. The company gives its support all over the supply chain with numerous innovative Eco-Friendly packaging products.
Leading Players in the Eco-Friendly Food Packaging Market
- Be Green Packaging, Inc.
- Biopak Pty Ltd
- Biomass Packaging
- Eco-Products, Inc.
- Daio Paper construction
- Gascogne Papier
- Glatfelter Corporation
- Genpak LLC
- Green Pack
- Nordic Paper AB
- PacknWood
- Stora Enso Oyj
- Sulapac Ltd
- Vegware Ltd
Eco-Friendly Food Packaging Market Segmentation
- 1. Eco-Friendly Food Packaging Material
- 1.1. Biodegradable
- 1.2. Recyclable
- 1.3. Compostable
- 2. Eco-Friendly Food Packaging Product Type
- 2.1. Bags
- 2.2. Containers
- 2.3. Boxes and cartons
- 2.4. Bottles and Jars
- 2.5. Others
- 3. Eco-Friendly Food Packaging End-User Industry
- 3.1. Foodservice
- 3.2. Retail
- 3.3. Food Processing
Eco-Friendly Food Packaging Market Segmentation By Geography
- 1. North America
- 1.1. U.S.
- 1.2. Canada
- 2. Europe
- 2.1. Germany
- 2.2. UK
- 2.3. France
- 2.4. Italy
- 2.5. Spain
- 2.6. Rest of Europe
- 3. Asia Pacific
- 3.1. China
- 3.2. Japan
- 3.3. India
- 3.4. South Korea
- 3.5. ANZ
- 3.6. Rest of Asia Pacific
- 4. Latin America
- 4.1. Brazil
- 4.2. Mexico
- 4.3. Rest of Latin America
- 5. MEA
- 5.1. UAE
- 5.2. Saudi Arabia
- 5.3. South Africa
- 5.4. Rest of MEA

Eco-Friendly Food Packaging Market REPORT HIGHLIGHTS
| Aspects | Details |
|---|---|
| Study Period | 2019-2033 |
| Base Year | 2024 |
| Estimated Year | 2025 |
| Forecast Period | 2025-2033 |
| Historical Period | 2019-2024 |
| Growth Rate | CAGR of 6.5% from 2019-2033 |
| Segmentation |
|
- 1. Introduction
- 1.1. Research Scope
- 1.2. Market Segmentation
- 1.3. Research Methodology
- 1.4. Definitions and Assumptions
- 2. Executive Summary
- 2.1. Introduction
- 3. Market Dynamics
- 3.1. Introduction
- 3.2. Market Drivers
- 3.2.1 Increasing environmental concerns
- 3.2.2 Rising regulatory initiatives
- 3.2.3 Growing consumer demand
- 3.2.4 Increasing corporate sustainability goals
- 3.2.5 Rising brand image and reputation focus
- 3.3. Market Restrains
- 3.3.1 High production costs
- 3.3.2 Limited availability of Eco-Friendly materials
- 3.4. Market Trends
- 4. Market Factor Analysis
- 4.1. Porters Five Forces
- 4.2. Supply/Value Chain
- 4.3. PESTEL analysis
- 4.4. Market Entropy
- 4.5. Patent/Trademark Analysis
- 5. Global Eco-Friendly Food Packaging Market Analysis, Insights and Forecast, 2019-2031
- 5.1. Market Analysis, Insights and Forecast - by Eco-Friendly Food Packaging Material
- 5.1.1. Biodegradable
- 5.1.2. Recyclable
- 5.1.3. Compostable
- 5.2. Market Analysis, Insights and Forecast - by Eco-Friendly Food Packaging Product Type
- 5.2.1. Bags
- 5.2.2. Containers
- 5.2.3. Boxes and cartons
- 5.2.4. Bottles and Jars
- 5.2.5. Others
- 5.3. Market Analysis, Insights and Forecast - by Eco-Friendly Food Packaging End-User Industry
- 5.3.1. Foodservice
- 5.3.2. Retail
- 5.3.3. Food Processing
- 5.4. Market Analysis, Insights and Forecast - by Region
- 5.4.1. North America
- 5.4.2. Europe
- 5.4.3. Asia Pacific
- 5.4.4. Latin America
- 5.4.5. MEA
- 5.1. Market Analysis, Insights and Forecast - by Eco-Friendly Food Packaging Material
- 6. North America Eco-Friendly Food Packaging Market Analysis, Insights and Forecast, 2019-2031
- 6.1. Market Analysis, Insights and Forecast - by Eco-Friendly Food Packaging Material
- 6.1.1. Biodegradable
- 6.1.2. Recyclable
- 6.1.3. Compostable
- 6.2. Market Analysis, Insights and Forecast - by Eco-Friendly Food Packaging Product Type
- 6.2.1. Bags
- 6.2.2. Containers
- 6.2.3. Boxes and cartons
- 6.2.4. Bottles and Jars
- 6.2.5. Others
- 6.3. Market Analysis, Insights and Forecast - by Eco-Friendly Food Packaging End-User Industry
- 6.3.1. Foodservice
- 6.3.2. Retail
- 6.3.3. Food Processing
- 6.1. Market Analysis, Insights and Forecast - by Eco-Friendly Food Packaging Material
- 7. Europe Eco-Friendly Food Packaging Market Analysis, Insights and Forecast, 2019-2031
- 7.1. Market Analysis, Insights and Forecast - by Eco-Friendly Food Packaging Material
- 7.1.1. Biodegradable
- 7.1.2. Recyclable
- 7.1.3. Compostable
- 7.2. Market Analysis, Insights and Forecast - by Eco-Friendly Food Packaging Product Type
- 7.2.1. Bags
- 7.2.2. Containers
- 7.2.3. Boxes and cartons
- 7.2.4. Bottles and Jars
- 7.2.5. Others
- 7.3. Market Analysis, Insights and Forecast - by Eco-Friendly Food Packaging End-User Industry
- 7.3.1. Foodservice
- 7.3.2. Retail
- 7.3.3. Food Processing
- 7.1. Market Analysis, Insights and Forecast - by Eco-Friendly Food Packaging Material
- 8. Asia Pacific Eco-Friendly Food Packaging Market Analysis, Insights and Forecast, 2019-2031
- 8.1. Market Analysis, Insights and Forecast - by Eco-Friendly Food Packaging Material
- 8.1.1. Biodegradable
- 8.1.2. Recyclable
- 8.1.3. Compostable
- 8.2. Market Analysis, Insights and Forecast - by Eco-Friendly Food Packaging Product Type
- 8.2.1. Bags
- 8.2.2. Containers
- 8.2.3. Boxes and cartons
- 8.2.4. Bottles and Jars
- 8.2.5. Others
- 8.3. Market Analysis, Insights and Forecast - by Eco-Friendly Food Packaging End-User Industry
- 8.3.1. Foodservice
- 8.3.2. Retail
- 8.3.3. Food Processing
- 8.1. Market Analysis, Insights and Forecast - by Eco-Friendly Food Packaging Material
- 9. Latin America Eco-Friendly Food Packaging Market Analysis, Insights and Forecast, 2019-2031
- 9.1. Market Analysis, Insights and Forecast - by Eco-Friendly Food Packaging Material
- 9.1.1. Biodegradable
- 9.1.2. Recyclable
- 9.1.3. Compostable
- 9.2. Market Analysis, Insights and Forecast - by Eco-Friendly Food Packaging Product Type
- 9.2.1. Bags
- 9.2.2. Containers
- 9.2.3. Boxes and cartons
- 9.2.4. Bottles and Jars
- 9.2.5. Others
- 9.3. Market Analysis, Insights and Forecast - by Eco-Friendly Food Packaging End-User Industry
- 9.3.1. Foodservice
- 9.3.2. Retail
- 9.3.3. Food Processing
- 9.1. Market Analysis, Insights and Forecast - by Eco-Friendly Food Packaging Material
- 10. MEA Eco-Friendly Food Packaging Market Analysis, Insights and Forecast, 2019-2031
- 10.1. Market Analysis, Insights and Forecast - by Eco-Friendly Food Packaging Material
- 10.1.1. Biodegradable
- 10.1.2. Recyclable
- 10.1.3. Compostable
- 10.2. Market Analysis, Insights and Forecast - by Eco-Friendly Food Packaging Product Type
- 10.2.1. Bags
- 10.2.2. Containers
- 10.2.3. Boxes and cartons
- 10.2.4. Bottles and Jars
- 10.2.5. Others
- 10.3. Market Analysis, Insights and Forecast - by Eco-Friendly Food Packaging End-User Industry
- 10.3.1. Foodservice
- 10.3.2. Retail
- 10.3.3. Food Processing
- 10.1. Market Analysis, Insights and Forecast - by Eco-Friendly Food Packaging Material
- 11. Competitive Analysis
- 11.1. Global Market Share Analysis 2024
- 11.2. Company Profiles
- 11.2.1 Be Green Packaging Inc.
- 11.2.1.1. Overview
- 11.2.1.2. Products
- 11.2.1.3. SWOT Analysis
- 11.2.1.4. Recent Developments
- 11.2.1.5. Financials (Based on Availability)
- 11.2.2 Biopak Pty Ltd
- 11.2.2.1. Overview
- 11.2.2.2. Products
- 11.2.2.3. SWOT Analysis
- 11.2.2.4. Recent Developments
- 11.2.2.5. Financials (Based on Availability)
- 11.2.3 Biomass Packaging
- 11.2.3.1. Overview
- 11.2.3.2. Products
- 11.2.3.3. SWOT Analysis
- 11.2.3.4. Recent Developments
- 11.2.3.5. Financials (Based on Availability)
- 11.2.4 Eco-Products Inc.
- 11.2.4.1. Overview
- 11.2.4.2. Products
- 11.2.4.3. SWOT Analysis
- 11.2.4.4. Recent Developments
- 11.2.4.5. Financials (Based on Availability)
- 11.2.5 Daio Paper construction
- 11.2.5.1. Overview
- 11.2.5.2. Products
- 11.2.5.3. SWOT Analysis
- 11.2.5.4. Recent Developments
- 11.2.5.5. Financials (Based on Availability)
- 11.2.6 Gascogne Papier
- 11.2.6.1. Overview
- 11.2.6.2. Products
- 11.2.6.3. SWOT Analysis
- 11.2.6.4. Recent Developments
- 11.2.6.5. Financials (Based on Availability)
- 11.2.7 Glatfelter Corporation
- 11.2.7.1. Overview
- 11.2.7.2. Products
- 11.2.7.3. SWOT Analysis
- 11.2.7.4. Recent Developments
- 11.2.7.5. Financials (Based on Availability)
- 11.2.8 Genpak LLC
- 11.2.8.1. Overview
- 11.2.8.2. Products
- 11.2.8.3. SWOT Analysis
- 11.2.8.4. Recent Developments
- 11.2.8.5. Financials (Based on Availability)
- 11.2.9 Green Pack
- 11.2.9.1. Overview
- 11.2.9.2. Products
- 11.2.9.3. SWOT Analysis
- 11.2.9.4. Recent Developments
- 11.2.9.5. Financials (Based on Availability)
- 11.2.10 Nordic Paper AB
- 11.2.10.1. Overview
- 11.2.10.2. Products
- 11.2.10.3. SWOT Analysis
- 11.2.10.4. Recent Developments
- 11.2.10.5. Financials (Based on Availability)
- 11.2.11 PacknWood
- 11.2.11.1. Overview
- 11.2.11.2. Products
- 11.2.11.3. SWOT Analysis
- 11.2.11.4. Recent Developments
- 11.2.11.5. Financials (Based on Availability)
- 11.2.12 Stora Enso Oyj
- 11.2.12.1. Overview
- 11.2.12.2. Products
- 11.2.12.3. SWOT Analysis
- 11.2.12.4. Recent Developments
- 11.2.12.5. Financials (Based on Availability)
- 11.2.13 Sulapac Ltd
- 11.2.13.1. Overview
- 11.2.13.2. Products
- 11.2.13.3. SWOT Analysis
- 11.2.13.4. Recent Developments
- 11.2.13.5. Financials (Based on Availability)
- 11.2.14 Vegware Ltd
- 11.2.14.1. Overview
- 11.2.14.2. Products
- 11.2.14.3. SWOT Analysis
- 11.2.14.4. Recent Developments
- 11.2.14.5. Financials (Based on Availability)
- 11.2.1 Be Green Packaging Inc.
- Figure 1: Global Eco-Friendly Food Packaging Market Revenue Breakdown (Billion, %) by Region 2024 & 2032
- Figure 2: Global Eco-Friendly Food Packaging Market Volume Breakdown (K Tons, %) by Region 2024 & 2032
- Figure 3: North America Eco-Friendly Food Packaging Market Revenue (Billion), by Eco-Friendly Food Packaging Material 2024 & 2032
- Figure 4: North America Eco-Friendly Food Packaging Market Volume (K Tons), by Eco-Friendly Food Packaging Material 2024 & 2032
- Figure 5: North America Eco-Friendly Food Packaging Market Revenue Share (%), by Eco-Friendly Food Packaging Material 2024 & 2032
- Figure 6: North America Eco-Friendly Food Packaging Market Volume Share (%), by Eco-Friendly Food Packaging Material 2024 & 2032
- Figure 7: North America Eco-Friendly Food Packaging Market Revenue (Billion), by Eco-Friendly Food Packaging Product Type 2024 & 2032
- Figure 8: North America Eco-Friendly Food Packaging Market Volume (K Tons), by Eco-Friendly Food Packaging Product Type 2024 & 2032
- Figure 9: North America Eco-Friendly Food Packaging Market Revenue Share (%), by Eco-Friendly Food Packaging Product Type 2024 & 2032
- Figure 10: North America Eco-Friendly Food Packaging Market Volume Share (%), by Eco-Friendly Food Packaging Product Type 2024 & 2032
- Figure 11: North America Eco-Friendly Food Packaging Market Revenue (Billion), by Eco-Friendly Food Packaging End-User Industry 2024 & 2032
- Figure 12: North America Eco-Friendly Food Packaging Market Volume (K Tons), by Eco-Friendly Food Packaging End-User Industry 2024 & 2032
- Figure 13: North America Eco-Friendly Food Packaging Market Revenue Share (%), by Eco-Friendly Food Packaging End-User Industry 2024 & 2032
- Figure 14: North America Eco-Friendly Food Packaging Market Volume Share (%), by Eco-Friendly Food Packaging End-User Industry 2024 & 2032
- Figure 15: North America Eco-Friendly Food Packaging Market Revenue (Billion), by Country 2024 & 2032
- Figure 16: North America Eco-Friendly Food Packaging Market Volume (K Tons), by Country 2024 & 2032
- Figure 17: North America Eco-Friendly Food Packaging Market Revenue Share (%), by Country 2024 & 2032
- Figure 18: North America Eco-Friendly Food Packaging Market Volume Share (%), by Country 2024 & 2032
- Figure 19: Europe Eco-Friendly Food Packaging Market Revenue (Billion), by Eco-Friendly Food Packaging Material 2024 & 2032
- Figure 20: Europe Eco-Friendly Food Packaging Market Volume (K Tons), by Eco-Friendly Food Packaging Material 2024 & 2032
- Figure 21: Europe Eco-Friendly Food Packaging Market Revenue Share (%), by Eco-Friendly Food Packaging Material 2024 & 2032
- Figure 22: Europe Eco-Friendly Food Packaging Market Volume Share (%), by Eco-Friendly Food Packaging Material 2024 & 2032
- Figure 23: Europe Eco-Friendly Food Packaging Market Revenue (Billion), by Eco-Friendly Food Packaging Product Type 2024 & 2032
- Figure 24: Europe Eco-Friendly Food Packaging Market Volume (K Tons), by Eco-Friendly Food Packaging Product Type 2024 & 2032
- Figure 25: Europe Eco-Friendly Food Packaging Market Revenue Share (%), by Eco-Friendly Food Packaging Product Type 2024 & 2032
- Figure 26: Europe Eco-Friendly Food Packaging Market Volume Share (%), by Eco-Friendly Food Packaging Product Type 2024 & 2032
- Figure 27: Europe Eco-Friendly Food Packaging Market Revenue (Billion), by Eco-Friendly Food Packaging End-User Industry 2024 & 2032
- Figure 28: Europe Eco-Friendly Food Packaging Market Volume (K Tons), by Eco-Friendly Food Packaging End-User Industry 2024 & 2032
- Figure 29: Europe Eco-Friendly Food Packaging Market Revenue Share (%), by Eco-Friendly Food Packaging End-User Industry 2024 & 2032
- Figure 30: Europe Eco-Friendly Food Packaging Market Volume Share (%), by Eco-Friendly Food Packaging End-User Industry 2024 & 2032
- Figure 31: Europe Eco-Friendly Food Packaging Market Revenue (Billion), by Country 2024 & 2032
- Figure 32: Europe Eco-Friendly Food Packaging Market Volume (K Tons), by Country 2024 & 2032
- Figure 33: Europe Eco-Friendly Food Packaging Market Revenue Share (%), by Country 2024 & 2032
- Figure 34: Europe Eco-Friendly Food Packaging Market Volume Share (%), by Country 2024 & 2032
- Figure 35: Asia Pacific Eco-Friendly Food Packaging Market Revenue (Billion), by Eco-Friendly Food Packaging Material 2024 & 2032
- Figure 36: Asia Pacific Eco-Friendly Food Packaging Market Volume (K Tons), by Eco-Friendly Food Packaging Material 2024 & 2032
- Figure 37: Asia Pacific Eco-Friendly Food Packaging Market Revenue Share (%), by Eco-Friendly Food Packaging Material 2024 & 2032
- Figure 38: Asia Pacific Eco-Friendly Food Packaging Market Volume Share (%), by Eco-Friendly Food Packaging Material 2024 & 2032
- Figure 39: Asia Pacific Eco-Friendly Food Packaging Market Revenue (Billion), by Eco-Friendly Food Packaging Product Type 2024 & 2032
- Figure 40: Asia Pacific Eco-Friendly Food Packaging Market Volume (K Tons), by Eco-Friendly Food Packaging Product Type 2024 & 2032
- Figure 41: Asia Pacific Eco-Friendly Food Packaging Market Revenue Share (%), by Eco-Friendly Food Packaging Product Type 2024 & 2032
- Figure 42: Asia Pacific Eco-Friendly Food Packaging Market Volume Share (%), by Eco-Friendly Food Packaging Product Type 2024 & 2032
- Figure 43: Asia Pacific Eco-Friendly Food Packaging Market Revenue (Billion), by Eco-Friendly Food Packaging End-User Industry 2024 & 2032
- Figure 44: Asia Pacific Eco-Friendly Food Packaging Market Volume (K Tons), by Eco-Friendly Food Packaging End-User Industry 2024 & 2032
- Figure 45: Asia Pacific Eco-Friendly Food Packaging Market Revenue Share (%), by Eco-Friendly Food Packaging End-User Industry 2024 & 2032
- Figure 46: Asia Pacific Eco-Friendly Food Packaging Market Volume Share (%), by Eco-Friendly Food Packaging End-User Industry 2024 & 2032
- Figure 47: Asia Pacific Eco-Friendly Food Packaging Market Revenue (Billion), by Country 2024 & 2032
- Figure 48: Asia Pacific Eco-Friendly Food Packaging Market Volume (K Tons), by Country 2024 & 2032
- Figure 49: Asia Pacific Eco-Friendly Food Packaging Market Revenue Share (%), by Country 2024 & 2032
- Figure 50: Asia Pacific Eco-Friendly Food Packaging Market Volume Share (%), by Country 2024 & 2032
- Figure 51: Latin America Eco-Friendly Food Packaging Market Revenue (Billion), by Eco-Friendly Food Packaging Material 2024 & 2032
- Figure 52: Latin America Eco-Friendly Food Packaging Market Volume (K Tons), by Eco-Friendly Food Packaging Material 2024 & 2032
- Figure 53: Latin America Eco-Friendly Food Packaging Market Revenue Share (%), by Eco-Friendly Food Packaging Material 2024 & 2032
- Figure 54: Latin America Eco-Friendly Food Packaging Market Volume Share (%), by Eco-Friendly Food Packaging Material 2024 & 2032
- Figure 55: Latin America Eco-Friendly Food Packaging Market Revenue (Billion), by Eco-Friendly Food Packaging Product Type 2024 & 2032
- Figure 56: Latin America Eco-Friendly Food Packaging Market Volume (K Tons), by Eco-Friendly Food Packaging Product Type 2024 & 2032
- Figure 57: Latin America Eco-Friendly Food Packaging Market Revenue Share (%), by Eco-Friendly Food Packaging Product Type 2024 & 2032
- Figure 58: Latin America Eco-Friendly Food Packaging Market Volume Share (%), by Eco-Friendly Food Packaging Product Type 2024 & 2032
- Figure 59: Latin America Eco-Friendly Food Packaging Market Revenue (Billion), by Eco-Friendly Food Packaging End-User Industry 2024 & 2032
- Figure 60: Latin America Eco-Friendly Food Packaging Market Volume (K Tons), by Eco-Friendly Food Packaging End-User Industry 2024 & 2032
- Figure 61: Latin America Eco-Friendly Food Packaging Market Revenue Share (%), by Eco-Friendly Food Packaging End-User Industry 2024 & 2032
- Figure 62: Latin America Eco-Friendly Food Packaging Market Volume Share (%), by Eco-Friendly Food Packaging End-User Industry 2024 & 2032
- Figure 63: Latin America Eco-Friendly Food Packaging Market Revenue (Billion), by Country 2024 & 2032
- Figure 64: Latin America Eco-Friendly Food Packaging Market Volume (K Tons), by Country 2024 & 2032
- Figure 65: Latin America Eco-Friendly Food Packaging Market Revenue Share (%), by Country 2024 & 2032
- Figure 66: Latin America Eco-Friendly Food Packaging Market Volume Share (%), by Country 2024 & 2032
- Figure 67: MEA Eco-Friendly Food Packaging Market Revenue (Billion), by Eco-Friendly Food Packaging Material 2024 & 2032
- Figure 68: MEA Eco-Friendly Food Packaging Market Volume (K Tons), by Eco-Friendly Food Packaging Material 2024 & 2032
- Figure 69: MEA Eco-Friendly Food Packaging Market Revenue Share (%), by Eco-Friendly Food Packaging Material 2024 & 2032
- Figure 70: MEA Eco-Friendly Food Packaging Market Volume Share (%), by Eco-Friendly Food Packaging Material 2024 & 2032
- Figure 71: MEA Eco-Friendly Food Packaging Market Revenue (Billion), by Eco-Friendly Food Packaging Product Type 2024 & 2032
- Figure 72: MEA Eco-Friendly Food Packaging Market Volume (K Tons), by Eco-Friendly Food Packaging Product Type 2024 & 2032
- Figure 73: MEA Eco-Friendly Food Packaging Market Revenue Share (%), by Eco-Friendly Food Packaging Product Type 2024 & 2032
- Figure 74: MEA Eco-Friendly Food Packaging Market Volume Share (%), by Eco-Friendly Food Packaging Product Type 2024 & 2032
- Figure 75: MEA Eco-Friendly Food Packaging Market Revenue (Billion), by Eco-Friendly Food Packaging End-User Industry 2024 & 2032
- Figure 76: MEA Eco-Friendly Food Packaging Market Volume (K Tons), by Eco-Friendly Food Packaging End-User Industry 2024 & 2032
- Figure 77: MEA Eco-Friendly Food Packaging Market Revenue Share (%), by Eco-Friendly Food Packaging End-User Industry 2024 & 2032
- Figure 78: MEA Eco-Friendly Food Packaging Market Volume Share (%), by Eco-Friendly Food Packaging End-User Industry 2024 & 2032
- Figure 79: MEA Eco-Friendly Food Packaging Market Revenue (Billion), by Country 2024 & 2032
- Figure 80: MEA Eco-Friendly Food Packaging Market Volume (K Tons), by Country 2024 & 2032
- Figure 81: MEA Eco-Friendly Food Packaging Market Revenue Share (%), by Country 2024 & 2032
- Figure 82: MEA Eco-Friendly Food Packaging Market Volume Share (%), by Country 2024 & 2032
- Table 1: Global Eco-Friendly Food Packaging Market Revenue Billion Forecast, by Region 2019 & 2032
- Table 2: Global Eco-Friendly Food Packaging Market Volume K Tons Forecast, by Region 2019 & 2032
- Table 3: Global Eco-Friendly Food Packaging Market Revenue Billion Forecast, by Eco-Friendly Food Packaging Material 2019 & 2032
- Table 4: Global Eco-Friendly Food Packaging Market Volume K Tons Forecast, by Eco-Friendly Food Packaging Material 2019 & 2032
- Table 5: Global Eco-Friendly Food Packaging Market Revenue Billion Forecast, by Eco-Friendly Food Packaging Product Type 2019 & 2032
- Table 6: Global Eco-Friendly Food Packaging Market Volume K Tons Forecast, by Eco-Friendly Food Packaging Product Type 2019 & 2032
- Table 7: Global Eco-Friendly Food Packaging Market Revenue Billion Forecast, by Eco-Friendly Food Packaging End-User Industry 2019 & 2032
- Table 8: Global Eco-Friendly Food Packaging Market Volume K Tons Forecast, by Eco-Friendly Food Packaging End-User Industry 2019 & 2032
- Table 9: Global Eco-Friendly Food Packaging Market Revenue Billion Forecast, by Region 2019 & 2032
- Table 10: Global Eco-Friendly Food Packaging Market Volume K Tons Forecast, by Region 2019 & 2032
- Table 11: Global Eco-Friendly Food Packaging Market Revenue Billion Forecast, by Eco-Friendly Food Packaging Material 2019 & 2032
- Table 12: Global Eco-Friendly Food Packaging Market Volume K Tons Forecast, by Eco-Friendly Food Packaging Material 2019 & 2032
- Table 13: Global Eco-Friendly Food Packaging Market Revenue Billion Forecast, by Eco-Friendly Food Packaging Product Type 2019 & 2032
- Table 14: Global Eco-Friendly Food Packaging Market Volume K Tons Forecast, by Eco-Friendly Food Packaging Product Type 2019 & 2032
- Table 15: Global Eco-Friendly Food Packaging Market Revenue Billion Forecast, by Eco-Friendly Food Packaging End-User Industry 2019 & 2032
- Table 16: Global Eco-Friendly Food Packaging Market Volume K Tons Forecast, by Eco-Friendly Food Packaging End-User Industry 2019 & 2032
- Table 17: Global Eco-Friendly Food Packaging Market Revenue Billion Forecast, by Country 2019 & 2032
- Table 18: Global Eco-Friendly Food Packaging Market Volume K Tons Forecast, by Country 2019 & 2032
- Table 19: U.S. Eco-Friendly Food Packaging Market Revenue (Billion) Forecast, by Application 2019 & 2032
- Table 20: U.S. Eco-Friendly Food Packaging Market Volume (K Tons) Forecast, by Application 2019 & 2032
- Table 21: Canada Eco-Friendly Food Packaging Market Revenue (Billion) Forecast, by Application 2019 & 2032
- Table 22: Canada Eco-Friendly Food Packaging Market Volume (K Tons) Forecast, by Application 2019 & 2032
- Table 23: Global Eco-Friendly Food Packaging Market Revenue Billion Forecast, by Eco-Friendly Food Packaging Material 2019 & 2032
- Table 24: Global Eco-Friendly Food Packaging Market Volume K Tons Forecast, by Eco-Friendly Food Packaging Material 2019 & 2032
- Table 25: Global Eco-Friendly Food Packaging Market Revenue Billion Forecast, by Eco-Friendly Food Packaging Product Type 2019 & 2032
- Table 26: Global Eco-Friendly Food Packaging Market Volume K Tons Forecast, by Eco-Friendly Food Packaging Product Type 2019 & 2032
- Table 27: Global Eco-Friendly Food Packaging Market Revenue Billion Forecast, by Eco-Friendly Food Packaging End-User Industry 2019 & 2032
- Table 28: Global Eco-Friendly Food Packaging Market Volume K Tons Forecast, by Eco-Friendly Food Packaging End-User Industry 2019 & 2032
- Table 29: Global Eco-Friendly Food Packaging Market Revenue Billion Forecast, by Country 2019 & 2032
- Table 30: Global Eco-Friendly Food Packaging Market Volume K Tons Forecast, by Country 2019 & 2032
- Table 31: Germany Eco-Friendly Food Packaging Market Revenue (Billion) Forecast, by Application 2019 & 2032
- Table 32: Germany Eco-Friendly Food Packaging Market Volume (K Tons) Forecast, by Application 2019 & 2032
- Table 33: UK Eco-Friendly Food Packaging Market Revenue (Billion) Forecast, by Application 2019 & 2032
- Table 34: UK Eco-Friendly Food Packaging Market Volume (K Tons) Forecast, by Application 2019 & 2032
- Table 35: France Eco-Friendly Food Packaging Market Revenue (Billion) Forecast, by Application 2019 & 2032
- Table 36: France Eco-Friendly Food Packaging Market Volume (K Tons) Forecast, by Application 2019 & 2032
- Table 37: Italy Eco-Friendly Food Packaging Market Revenue (Billion) Forecast, by Application 2019 & 2032
- Table 38: Italy Eco-Friendly Food Packaging Market Volume (K Tons) Forecast, by Application 2019 & 2032
- Table 39: Spain Eco-Friendly Food Packaging Market Revenue (Billion) Forecast, by Application 2019 & 2032
- Table 40: Spain Eco-Friendly Food Packaging Market Volume (K Tons) Forecast, by Application 2019 & 2032
- Table 41: Rest of Europe Eco-Friendly Food Packaging Market Revenue (Billion) Forecast, by Application 2019 & 2032
- Table 42: Rest of Europe Eco-Friendly Food Packaging Market Volume (K Tons) Forecast, by Application 2019 & 2032
- Table 43: Global Eco-Friendly Food Packaging Market Revenue Billion Forecast, by Eco-Friendly Food Packaging Material 2019 & 2032
- Table 44: Global Eco-Friendly Food Packaging Market Volume K Tons Forecast, by Eco-Friendly Food Packaging Material 2019 & 2032
- Table 45: Global Eco-Friendly Food Packaging Market Revenue Billion Forecast, by Eco-Friendly Food Packaging Product Type 2019 & 2032
- Table 46: Global Eco-Friendly Food Packaging Market Volume K Tons Forecast, by Eco-Friendly Food Packaging Product Type 2019 & 2032
- Table 47: Global Eco-Friendly Food Packaging Market Revenue Billion Forecast, by Eco-Friendly Food Packaging End-User Industry 2019 & 2032
- Table 48: Global Eco-Friendly Food Packaging Market Volume K Tons Forecast, by Eco-Friendly Food Packaging End-User Industry 2019 & 2032
- Table 49: Global Eco-Friendly Food Packaging Market Revenue Billion Forecast, by Country 2019 & 2032
- Table 50: Global Eco-Friendly Food Packaging Market Volume K Tons Forecast, by Country 2019 & 2032
- Table 51: China Eco-Friendly Food Packaging Market Revenue (Billion) Forecast, by Application 2019 & 2032
- Table 52: China Eco-Friendly Food Packaging Market Volume (K Tons) Forecast, by Application 2019 & 2032
- Table 53: Japan Eco-Friendly Food Packaging Market Revenue (Billion) Forecast, by Application 2019 & 2032
- Table 54: Japan Eco-Friendly Food Packaging Market Volume (K Tons) Forecast, by Application 2019 & 2032
- Table 55: India Eco-Friendly Food Packaging Market Revenue (Billion) Forecast, by Application 2019 & 2032
- Table 56: India Eco-Friendly Food Packaging Market Volume (K Tons) Forecast, by Application 2019 & 2032
- Table 57: South Korea Eco-Friendly Food Packaging Market Revenue (Billion) Forecast, by Application 2019 & 2032
- Table 58: South Korea Eco-Friendly Food Packaging Market Volume (K Tons) Forecast, by Application 2019 & 2032
- Table 59: ANZ Eco-Friendly Food Packaging Market Revenue (Billion) Forecast, by Application 2019 & 2032
- Table 60: ANZ Eco-Friendly Food Packaging Market Volume (K Tons) Forecast, by Application 2019 & 2032
- Table 61: Rest of Asia Pacific Eco-Friendly Food Packaging Market Revenue (Billion) Forecast, by Application 2019 & 2032
- Table 62: Rest of Asia Pacific Eco-Friendly Food Packaging Market Volume (K Tons) Forecast, by Application 2019 & 2032
- Table 63: Global Eco-Friendly Food Packaging Market Revenue Billion Forecast, by Eco-Friendly Food Packaging Material 2019 & 2032
- Table 64: Global Eco-Friendly Food Packaging Market Volume K Tons Forecast, by Eco-Friendly Food Packaging Material 2019 & 2032
- Table 65: Global Eco-Friendly Food Packaging Market Revenue Billion Forecast, by Eco-Friendly Food Packaging Product Type 2019 & 2032
- Table 66: Global Eco-Friendly Food Packaging Market Volume K Tons Forecast, by Eco-Friendly Food Packaging Product Type 2019 & 2032
- Table 67: Global Eco-Friendly Food Packaging Market Revenue Billion Forecast, by Eco-Friendly Food Packaging End-User Industry 2019 & 2032
- Table 68: Global Eco-Friendly Food Packaging Market Volume K Tons Forecast, by Eco-Friendly Food Packaging End-User Industry 2019 & 2032
- Table 69: Global Eco-Friendly Food Packaging Market Revenue Billion Forecast, by Country 2019 & 2032
- Table 70: Global Eco-Friendly Food Packaging Market Volume K Tons Forecast, by Country 2019 & 2032
- Table 71: Brazil Eco-Friendly Food Packaging Market Revenue (Billion) Forecast, by Application 2019 & 2032
- Table 72: Brazil Eco-Friendly Food Packaging Market Volume (K Tons) Forecast, by Application 2019 & 2032
- Table 73: Mexico Eco-Friendly Food Packaging Market Revenue (Billion) Forecast, by Application 2019 & 2032
- Table 74: Mexico Eco-Friendly Food Packaging Market Volume (K Tons) Forecast, by Application 2019 & 2032
- Table 75: Rest of Latin America Eco-Friendly Food Packaging Market Revenue (Billion) Forecast, by Application 2019 & 2032
- Table 76: Rest of Latin America Eco-Friendly Food Packaging Market Volume (K Tons) Forecast, by Application 2019 & 2032
- Table 77: Global Eco-Friendly Food Packaging Market Revenue Billion Forecast, by Eco-Friendly Food Packaging Material 2019 & 2032
- Table 78: Global Eco-Friendly Food Packaging Market Volume K Tons Forecast, by Eco-Friendly Food Packaging Material 2019 & 2032
- Table 79: Global Eco-Friendly Food Packaging Market Revenue Billion Forecast, by Eco-Friendly Food Packaging Product Type 2019 & 2032
- Table 80: Global Eco-Friendly Food Packaging Market Volume K Tons Forecast, by Eco-Friendly Food Packaging Product Type 2019 & 2032
- Table 81: Global Eco-Friendly Food Packaging Market Revenue Billion Forecast, by Eco-Friendly Food Packaging End-User Industry 2019 & 2032
- Table 82: Global Eco-Friendly Food Packaging Market Volume K Tons Forecast, by Eco-Friendly Food Packaging End-User Industry 2019 & 2032
- Table 83: Global Eco-Friendly Food Packaging Market Revenue Billion Forecast, by Country 2019 & 2032
- Table 84: Global Eco-Friendly Food Packaging Market Volume K Tons Forecast, by Country 2019 & 2032
- Table 85: UAE Eco-Friendly Food Packaging Market Revenue (Billion) Forecast, by Application 2019 & 2032
- Table 86: UAE Eco-Friendly Food Packaging Market Volume (K Tons) Forecast, by Application 2019 & 2032
- Table 87: Saudi Arabia Eco-Friendly Food Packaging Market Revenue (Billion) Forecast, by Application 2019 & 2032
- Table 88: Saudi Arabia Eco-Friendly Food Packaging Market Volume (K Tons) Forecast, by Application 2019 & 2032
- Table 89: South Africa Eco-Friendly Food Packaging Market Revenue (Billion) Forecast, by Application 2019 & 2032
- Table 90: South Africa Eco-Friendly Food Packaging Market Volume (K Tons) Forecast, by Application 2019 & 2032
- Table 91: Rest of MEA Eco-Friendly Food Packaging Market Revenue (Billion) Forecast, by Application 2019 & 2032
- Table 92: Rest of MEA Eco-Friendly Food Packaging Market Volume (K Tons) Forecast, by Application 2019 & 2032
STEP 1 - Identification of Relevant Samples Size from Population Database


STEP 2 - Approaches for Defining Global Market Size (Value, Volume* & Price*)

Note* : In applicable scenarios
STEP 3 - Data Sources
Primary Research
- Web Analytics
- Survey Reports
- Research Institute
- Latest Research Reports
- Opinion Leaders
Secondary Research
- Annual Reports
- White Paper
- Latest Press Release
- Industry Association
- Paid Database
- Investor Presentations

STEP 4 - Data Triangulation
Involves using different sources of information in order to increase the validity of a study
These sources are likely to be stakeholders in a program - participants, other researchers, program staff, other community members, and so on.
Then we put all data in single framework & apply various statistical tools to find out the dynamic on the market.
During the analysis stage, feedback from the stakeholder groups would be compared to determine areas of agreement as well as areas of divergence
Frequently Asked Questions
Related Reports
See the similar reports


About Market Insights Report
Market Insights Reports offers comprehensive market research reports and analysis, giving businesses important information about their clients, rivals, and sector to help them make well-informed decisions on operations, marketing, and business strategy. We offer a variety of services in addition to market research, data analysis, and strategy planning. In order to find opportunities and learn more about our competitors and the industry at large, we employ competitive analysis. To identify areas for development, we also evaluate our performance against that of our rivals. We can determine the places at which we can offer our clients the most value by performing value chain analysis.
Additionally, clients receive a thorough overview of their industry business environment. We can find trends that help us forecast future possibilities and threats by examining global macroeconomic dynamics and consumer behavior patterns. By analyzing their features and advantages, contrasting them with comparable items on the market, and evaluating both their quantitative and qualitative performance, we comprehensively evaluate our clients' products. This allows us to assist customers in determining how their goods compare to those of their rivals and in creating successful marketing plans. Our group has been successful in gaining a thorough grasp of our clients' requirements and offering them creative solutions. We currently provide services to more than 50 nations in Europe, the Middle East, Africa, Latin America, Asia Pacific, and North America. Because of our global reach, we have been able to establish trusting bonds with our partners and clients in various nations, improving customer service and forging a more cohesive worldwide presence.