
.jpg&w=3840&q=100)
Market
Insights
Reports delivered globally, covering a wide range of industries and sectors.
Clients who trust our expertise and rely on our insights for business decisions.
Managed Reports, ensuring seamless updates and premium service.
Satisfied Customers, committed to delivering exceptional value and quality.
Electric Vehicle On-Board Charger Market Size, Share, and Growth Report: In-Depth Analysis and Forecast to 2033"
Electric Vehicle On-Board Charger Market by Rating (< 11 kW, > 11 kW to 22 kW, > 22 kW), by Propulsion (Battery Electric Vehicle (BEV), Plug-in Hybrid Electric Vehicle (PHEV), Others), by North America (U.S., Canada, Mexico), by Europe (Norway, Germany, France, Netherlands, UK, Sweden), by Asia Pacific (China, Japan, India, South Korea, Singapore), by Middle East & Africa (Saudi Arabia, UAE, Qatar, South Africa), by Latin America (Brazil, Argentina) Forecast 2025-2033
Electric Vehicle On-Board Charger Market Size, Share, and Growth Report: In-Depth Analysis and Forecast to 2033"
Key Insights
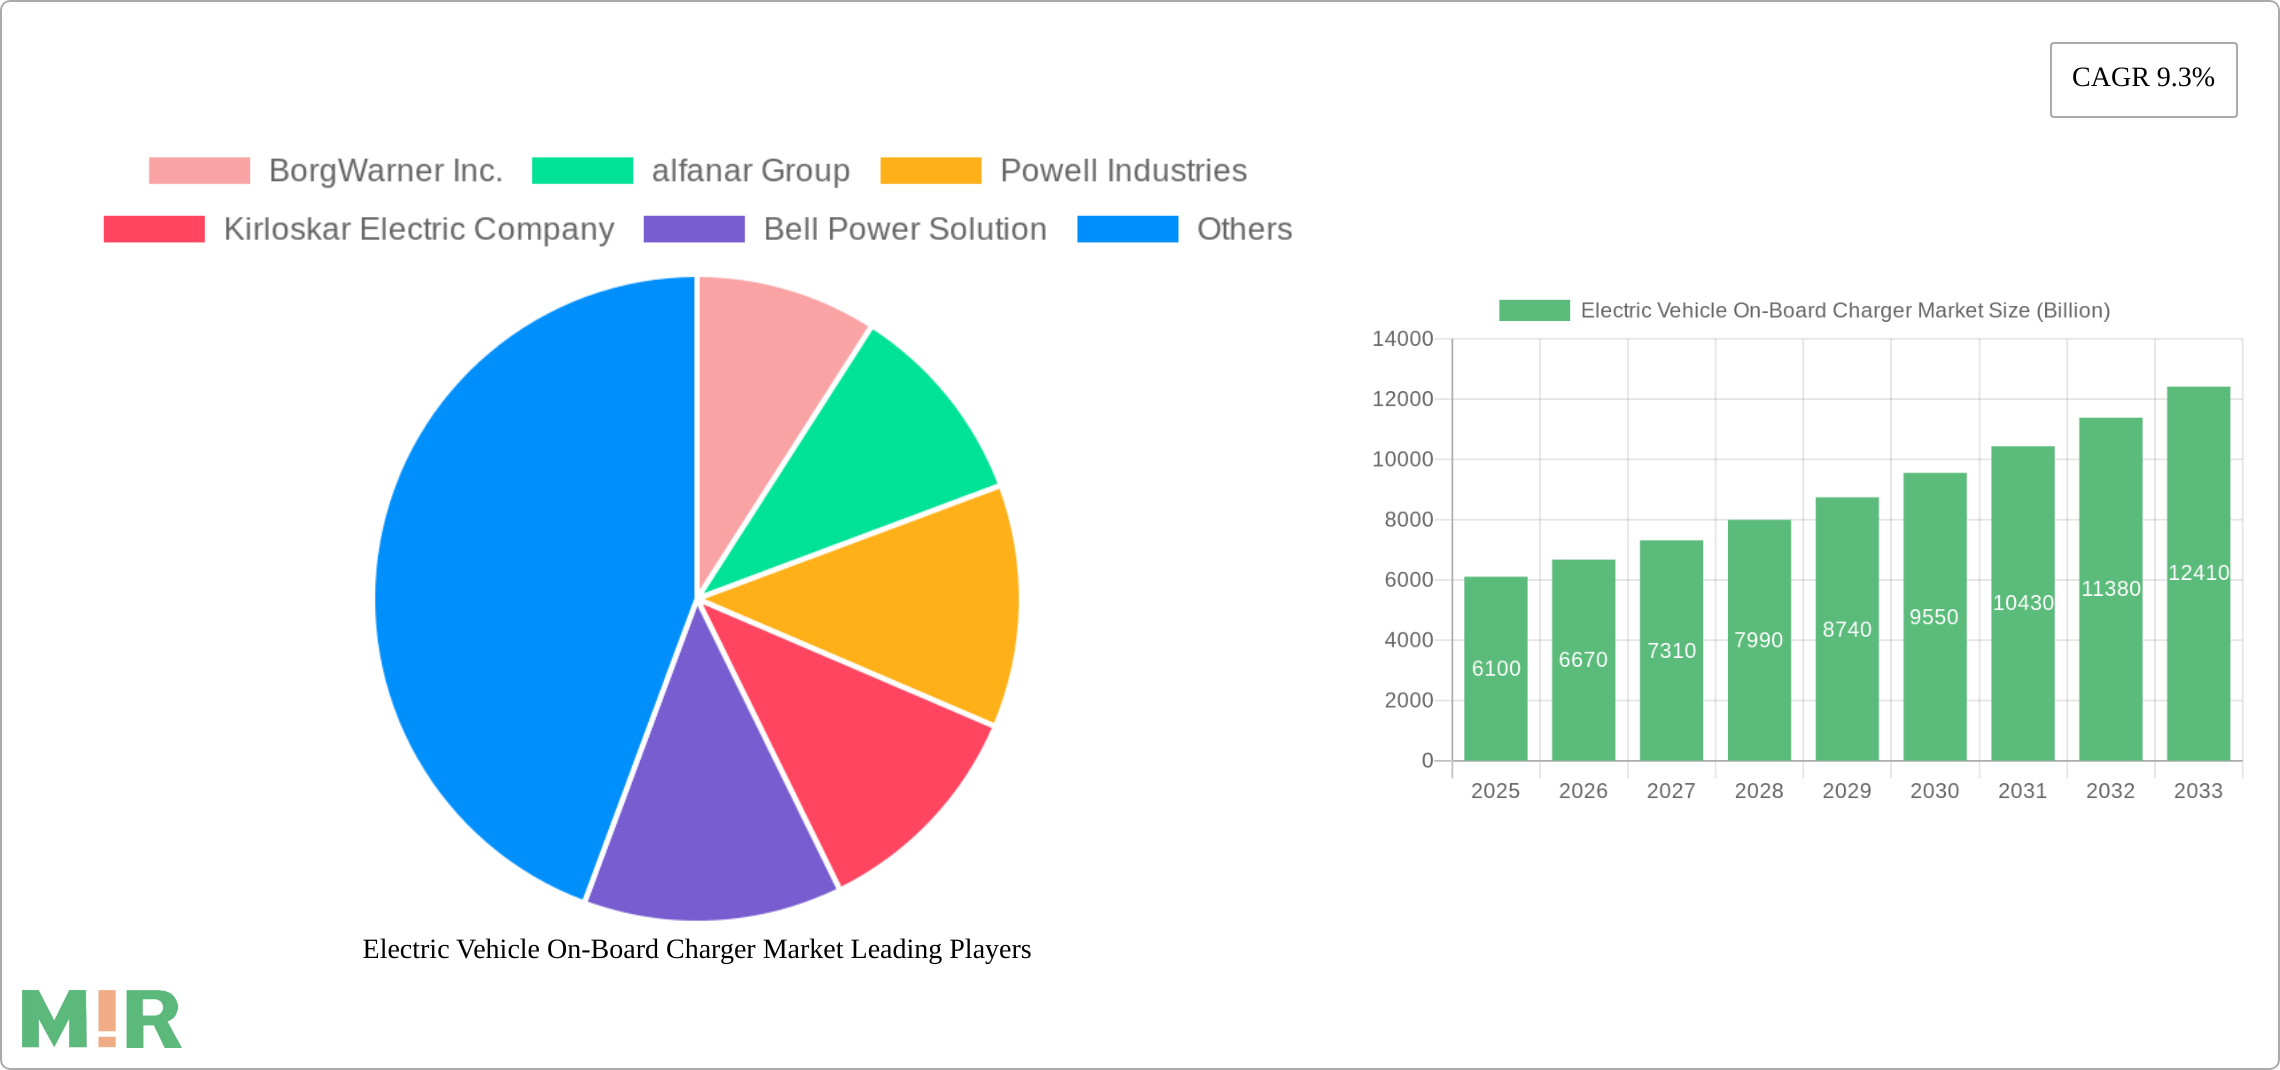
The Electric Vehicle On-Board Charger (OBC) market is experiencing robust growth, driven by the escalating adoption of electric vehicles (EVs) globally. The market, valued at $6.1 billion in 2025, is projected to exhibit a Compound Annual Growth Rate (CAGR) of 9.3% from 2025 to 2033. This growth is fueled by several key factors. Firstly, stringent government regulations aimed at reducing carbon emissions are incentivizing EV adoption, creating a substantial demand for OBCs. Secondly, advancements in battery technology, leading to increased EV range and performance, further contribute to market expansion. The rising consumer preference for electric vehicles due to their environmental benefits and cost savings in the long run also plays a significant role. Market segmentation reveals strong growth potential in both higher-power OBCs (above 22 kW) and Battery Electric Vehicle (BEV) applications, reflecting the trend toward faster charging capabilities and the dominance of BEVs in the EV market. Geographic analysis indicates that North America, Europe, and Asia Pacific are the key regional markets, driven by strong EV infrastructure development and government support in these regions. Leading players like BorgWarner, Eaton, and Delphi Technologies are actively investing in research and development to enhance OBC technology, improving efficiency, reducing charging times, and enhancing overall performance, contributing to the market's continued expansion.
Competitive intensity within the OBC market is moderate, with several established players and emerging companies vying for market share. Key competitive strategies include technological innovation, strategic partnerships, and geographic expansion. The market faces some restraints, including the high initial cost of EVs and the limited availability of charging infrastructure in certain regions. However, these challenges are being addressed through government subsidies, private investments in charging infrastructure, and continuous improvements in OBC technology, ultimately supporting the market’s long-term growth trajectory. The continued development of advanced charging technologies, such as bidirectional charging and wireless charging, presents significant opportunities for future growth within this dynamic sector. The market's future prospects remain positive, with continued growth anticipated throughout the forecast period, fueled by the ongoing global transition towards electric mobility.
Electric Vehicle On-Board Charger Market Concentration & Characteristics
The Electric Vehicle (EV) On-Board Charger (OBC) market is characterized by a moderately concentrated landscape, with a few major players holding significant market share. However, the market also exhibits a high level of innovation, driven by the need for higher efficiency, faster charging speeds, and smaller form factors. This leads to a dynamic competitive environment with continuous product improvements and technological advancements.
- Concentration Areas: The market is concentrated among established automotive component suppliers and emerging specialized EV technology companies. Geographic concentration is notable in regions with strong EV adoption rates, such as North America, Europe, and Asia-Pacific.
- Characteristics of Innovation: Key areas of innovation include silicon carbide (SiC) technology for improved efficiency and power density, gallium nitride (GaN) based chargers for faster charging, and advanced thermal management systems to enhance reliability and longevity. The integration of smart charging functionalities and communication protocols (e.g., V2G) also constitutes significant innovation.
- Impact of Regulations: Stringent government regulations promoting EV adoption (like emission standards and incentives) directly impact market growth. Regulations also influence OBC design requirements, particularly concerning safety and charging standards.
- Product Substitutes: While direct substitutes are limited, improvements in battery technology impacting charging speeds and efficiency can indirectly reduce the importance of high-performance OBCs.
- End-User Concentration: The market is heavily reliant on the automotive industry, with significant concentration among major Original Equipment Manufacturers (OEMs) and Tier-1 suppliers.
- Level of M&A: The level of mergers and acquisitions (M&A) activity is expected to remain moderate to high, driven by the need for strategic alliances, technology acquisition, and market expansion by established and emerging players.
Electric Vehicle On-Board Charger Market Trends
The EV OBC market is experiencing robust growth fueled by the global surge in EV adoption. This growth is driven by several key trends:
- Increasing EV Sales: The global shift towards electric mobility is the primary driver, pushing demand for OBCs in tandem with EV production. Governments worldwide are incentivizing EV purchases through subsidies and tax breaks, further accelerating market expansion. The rising concerns regarding climate change and air pollution also contribute significantly.
- Technological Advancements: Continuous innovation in semiconductor technology (SiC and GaN) is leading to more efficient, powerful, and compact OBCs. This trend allows for faster charging times and improved range for EVs, enhancing the overall consumer experience. Furthermore, the integration of smart charging capabilities and bi-directional charging (V2G) technology enhances the functionality and value proposition of OBCs.
- Rising Demand for Higher-Power Charging: The market is witnessing a strong shift towards higher-power OBCs (>22 kW) to enable faster charging. This is driven by consumer preference for quicker charging times and increased range anxiety. Rapid charging infrastructure development further fuels this trend, creating synergy between OBC and charging station capabilities.
- Stringent Emission Regulations: Governments worldwide are imposing increasingly strict emission norms, pushing automakers to accelerate their EV production and consequently, increase OBC demand. These regulations create a favorable environment for the market's sustained growth.
- Focus on Cost Reduction: While performance improvements are crucial, there is a simultaneous focus on cost reduction to enhance the affordability of EVs and expand their market reach. This drives manufacturers to explore cost-effective materials and manufacturing processes without compromising quality and reliability.
- Regional Variations: Growth is geographically diverse. China and Europe are leading markets, showcasing rapid EV adoption. However, North America and other regions are also experiencing accelerated growth, albeit at varying paces. The maturity of charging infrastructure also plays a pivotal role in regional growth patterns.
- Supply Chain Optimization: The automotive industry faces global supply chain disruptions. OBC manufacturers are focusing on strengthening their supply chains and diversifying sourcing to mitigate potential delays and disruptions. This involves forging stronger relationships with component suppliers and exploring alternative sourcing strategies.

Key Region or Country & Segment to Dominate the Market
The Battery Electric Vehicle (BEV) segment is poised to dominate the market due to its significantly higher growth compared to Plug-in Hybrid Electric Vehicles (PHEVs). BEVs are projected to capture a larger market share as consumer preference shifts toward fully electric vehicles. This dominance is amplified by government policies focusing on phasing out combustion engine vehicles and substantial investments in charging infrastructure.
- Key Regions:
- China: Holds the largest market share driven by massive EV production and substantial government support for the electric vehicle industry. The country's huge domestic market and well-developed manufacturing base provide a strong foundation for this leadership.
- Europe: Europe is another key region witnessing significant growth, driven by supportive policies, rising environmental awareness and the availability of charging infrastructure. Stringent emission standards in several European countries are accelerating the transition to electric vehicles.
- North America: While currently exhibiting lower adoption rates compared to China and Europe, the North American market is expected to show significant growth driven by increasing consumer demand, supportive government policies and technological advancements in EV manufacturing.
The >22kW segment is anticipated to witness robust growth, primarily due to an increase in consumer preference for faster charging times. Higher power OBCs are becoming more prevalent as charging infrastructure develops to support them, creating a positive feedback loop between the OBC market and charging infrastructure development.
Electric Vehicle On-Board Charger Market Product Insights Report Coverage & Deliverables
This report provides a comprehensive analysis of the EV OBC market, covering market size, growth projections, regional dynamics, key players, and technological trends. It includes detailed segmentation by power rating (11 kW to 22 kW, >22 kW), vehicle type (BEV, PHEV, Others), and region. Furthermore, the report offers insights into market drivers, challenges, opportunities, and future outlook, providing valuable data for strategic decision-making for stakeholders across the EV ecosystem.
Electric Vehicle On-Board Charger Market Analysis
The global EV OBC market is estimated to be valued at $5.5 billion in 2023 and is projected to reach $18 billion by 2030, exhibiting a Compound Annual Growth Rate (CAGR) exceeding 18%. This significant growth is directly correlated with the escalating global demand for electric vehicles. The market share is currently distributed among various players, with established automotive component suppliers and emerging technology companies competing for dominance. The market share dynamics are constantly evolving as technology advances and new players enter the market. Pricing strategies vary based on OBC specifications, power ratings, and technological features. The market is characterized by moderate price competition, with price points influenced by manufacturing costs, technology integration, and brand recognition.
Electric Vehicle On-Board Charger Market Regional Insights
- North America
- U.S.: High growth potential, driven by increasing EV adoption and government initiatives.
- Canada: Growing market driven by supportive government policies and expanding charging infrastructure.
- Mexico: Emerging market with significant potential, supported by recent investments in charging infrastructure.
- Europe
- Norway: Leading market in EV adoption, with high demand for OBCs.
- Germany: Large market with substantial growth potential, fueled by government incentives and strong automotive industry.
- France: Growing market with supportive government policies.
- Netherlands: High EV adoption rate, resulting in increased OBC demand.
- UK: Significant market growth driven by the government’s push towards electric vehicles.
- Sweden: High adoption rate driving demand for OBCs.
- Asia Pacific
- China: Largest market globally, characterized by high production volumes and government support.
- Japan: Growing market with significant technological advancements in the automotive sector.
- India: Emerging market with high growth potential, driven by government initiatives and increasing consumer demand.
- South Korea: Significant market growth propelled by strong domestic EV production and exports.
- Singapore: High EV adoption rate, driving demand for OBCs.
- Middle East & Africa
- Saudi Arabia: Emerging market with increasing government investment in renewable energy and electric vehicles.
- UAE: Growing market with investments in charging infrastructure and supportive government policies.
- Qatar: Emerging market with potential for growth.
- South Africa: Developing market with increasing interest in electric vehicles.
- Latin America
- Brazil: Growing market with potential for significant expansion.
- Argentina: Emerging market with potential for growth.
Driving Forces: What's Propelling the Electric Vehicle On-Board Charger Market
The EV OBC market is primarily propelled by the rising global adoption of electric vehicles, stringent government regulations on emissions, and continuous technological advancements leading to more efficient and powerful OBCs. Further driving forces include increased consumer preference for faster charging and growing investments in charging infrastructure.
Challenges and Restraints in Electric Vehicle On-Board Charger Market
Challenges include high initial costs of OBCs, the need for robust thermal management systems to handle high power levels, and the complexity of integrating OBCs with vehicle architectures. Supply chain disruptions and competition from alternative charging technologies also present significant challenges.
Emerging Trends in Electric Vehicle On-Board Charger Market
Emerging trends include the adoption of SiC and GaN based technologies for improved efficiency and power density, the increasing integration of smart charging features and V2G capabilities, and the focus on developing smaller and lighter OBCs to reduce vehicle weight and enhance overall vehicle performance.
Electric Vehicle On-Board Charger Industry News
- April 2022: As per Indian Brand Equity Foundation, India plans to invest USD 1.84 billion in EV charger infrastructure over the next 3-4 years under the FAME scheme.
- [Unspecified Year]: BMW Group and Evergo announced a USD 200 million investment to install over 4,000 EV chargers in Mexico over five years.
Leading Players in the Electric Vehicle On-Board Charger Market
- BorgWarner Inc.
- alfanar Group
- Powell Industries
- Kirloskar Electric Company
- Bell Power Solution
- BRUSA Elektronik AG
- Current Ways Inc.
- Delphi Technologies
- Eaton Corporation
- Stercom Power Solutions GmbH
- Delta Energy Systems
- STMicroelectronics
- innolectric AG
- AVID Technology Limited
- Ficosa International SA
- Toyota Industries Corporation
- Xepics Italia SRL
- Infineon Technologies AG
Electric Vehicle On-Board Charger Market Segmentation
-
1. Rating
- 1.1. < 11 kW
- 1.2. > 11 kW to 22 kW
- 1.3. > 22 kW
-
2. Propulsion
- 2.1. Battery Electric Vehicle (BEV)
- 2.2. Plug-in Hybrid Electric Vehicle (PHEV)
- 2.3. Others
Electric Vehicle On-Board Charger Market Segmentation By Geography
-
1. North America
- 1.1. U.S.
- 1.2. Canada
- 1.3. Mexico
-
2. Europe
- 2.1. Norway
- 2.2. Germany
- 2.3. France
- 2.4. Netherlands
- 2.5. UK
- 2.6. Sweden
-
3. Asia Pacific
- 3.1. China
- 3.2. Japan
- 3.3. India
- 3.4. South Korea
- 3.5. Singapore
-
4. Middle East & Africa
- 4.1. Saudi Arabia
- 4.2. UAE
- 4.3. Qatar
- 4.4. South Africa
-
5. Latin America
- 5.1. Brazil
- 5.2. Argentina

Electric Vehicle On-Board Charger Market REPORT HIGHLIGHTS
| Aspects | Details |
|---|---|
| Study Period | 2019-2033 |
| Base Year | 2024 |
| Estimated Year | 2025 |
| Forecast Period | 2025-2033 |
| Historical Period | 2019-2024 |
| Growth Rate | CAGR of 9.3% from 2019-2033 |
| Segmentation |
|
- 1. Introduction
- 1.1. Research Scope
- 1.2. Market Segmentation
- 1.3. Research Methodology
- 1.4. Definitions and Assumptions
- 2. Executive Summary
- 2.1. Introduction
- 3. Market Dynamics
- 3.1. Introduction
- 3.2. Market Drivers
- 3.2.1 Increasing EV adoption
- 3.2.2 Government initiative & investments
- 3.3. Market Restrains
- 3.3.1. Economic factors
- 3.4. Market Trends
- 4. Market Factor Analysis
- 4.1. Porters Five Forces
- 4.2. Supply/Value Chain
- 4.3. PESTEL analysis
- 4.4. Market Entropy
- 4.5. Patent/Trademark Analysis
- 5. Global Electric Vehicle On-Board Charger Market Analysis, Insights and Forecast, 2019-2031
- 5.1. Market Analysis, Insights and Forecast - by Rating
- 5.1.1. < 11 kW
- 5.1.2. > 11 kW to 22 kW
- 5.1.3. > 22 kW
- 5.2. Market Analysis, Insights and Forecast - by Propulsion
- 5.2.1. Battery Electric Vehicle (BEV)
- 5.2.2. Plug-in Hybrid Electric Vehicle (PHEV)
- 5.2.3. Others
- 5.3. Market Analysis, Insights and Forecast - by Region
- 5.3.1. North America
- 5.3.2. Europe
- 5.3.3. Asia Pacific
- 5.3.4. Middle East & Africa
- 5.3.5. Latin America
- 5.1. Market Analysis, Insights and Forecast - by Rating
- 6. North America Electric Vehicle On-Board Charger Market Analysis, Insights and Forecast, 2019-2031
- 6.1. Market Analysis, Insights and Forecast - by Rating
- 6.1.1. < 11 kW
- 6.1.2. > 11 kW to 22 kW
- 6.1.3. > 22 kW
- 6.2. Market Analysis, Insights and Forecast - by Propulsion
- 6.2.1. Battery Electric Vehicle (BEV)
- 6.2.2. Plug-in Hybrid Electric Vehicle (PHEV)
- 6.2.3. Others
- 6.1. Market Analysis, Insights and Forecast - by Rating
- 7. Europe Electric Vehicle On-Board Charger Market Analysis, Insights and Forecast, 2019-2031
- 7.1. Market Analysis, Insights and Forecast - by Rating
- 7.1.1. < 11 kW
- 7.1.2. > 11 kW to 22 kW
- 7.1.3. > 22 kW
- 7.2. Market Analysis, Insights and Forecast - by Propulsion
- 7.2.1. Battery Electric Vehicle (BEV)
- 7.2.2. Plug-in Hybrid Electric Vehicle (PHEV)
- 7.2.3. Others
- 7.1. Market Analysis, Insights and Forecast - by Rating
- 8. Asia Pacific Electric Vehicle On-Board Charger Market Analysis, Insights and Forecast, 2019-2031
- 8.1. Market Analysis, Insights and Forecast - by Rating
- 8.1.1. < 11 kW
- 8.1.2. > 11 kW to 22 kW
- 8.1.3. > 22 kW
- 8.2. Market Analysis, Insights and Forecast - by Propulsion
- 8.2.1. Battery Electric Vehicle (BEV)
- 8.2.2. Plug-in Hybrid Electric Vehicle (PHEV)
- 8.2.3. Others
- 8.1. Market Analysis, Insights and Forecast - by Rating
- 9. Middle East & Africa Electric Vehicle On-Board Charger Market Analysis, Insights and Forecast, 2019-2031
- 9.1. Market Analysis, Insights and Forecast - by Rating
- 9.1.1. < 11 kW
- 9.1.2. > 11 kW to 22 kW
- 9.1.3. > 22 kW
- 9.2. Market Analysis, Insights and Forecast - by Propulsion
- 9.2.1. Battery Electric Vehicle (BEV)
- 9.2.2. Plug-in Hybrid Electric Vehicle (PHEV)
- 9.2.3. Others
- 9.1. Market Analysis, Insights and Forecast - by Rating
- 10. Latin America Electric Vehicle On-Board Charger Market Analysis, Insights and Forecast, 2019-2031
- 10.1. Market Analysis, Insights and Forecast - by Rating
- 10.1.1. < 11 kW
- 10.1.2. > 11 kW to 22 kW
- 10.1.3. > 22 kW
- 10.2. Market Analysis, Insights and Forecast - by Propulsion
- 10.2.1. Battery Electric Vehicle (BEV)
- 10.2.2. Plug-in Hybrid Electric Vehicle (PHEV)
- 10.2.3. Others
- 10.1. Market Analysis, Insights and Forecast - by Rating
- 11. Competitive Analysis
- 11.1. Global Market Share Analysis 2024
- 11.2. Company Profiles
- 11.2.1 BorgWarner Inc.
- 11.2.1.1. Overview
- 11.2.1.2. Products
- 11.2.1.3. SWOT Analysis
- 11.2.1.4. Recent Developments
- 11.2.1.5. Financials (Based on Availability)
- 11.2.2 alfanar Group
- 11.2.2.1. Overview
- 11.2.2.2. Products
- 11.2.2.3. SWOT Analysis
- 11.2.2.4. Recent Developments
- 11.2.2.5. Financials (Based on Availability)
- 11.2.3 Powell Industries
- 11.2.3.1. Overview
- 11.2.3.2. Products
- 11.2.3.3. SWOT Analysis
- 11.2.3.4. Recent Developments
- 11.2.3.5. Financials (Based on Availability)
- 11.2.4 Kirloskar Electric Company
- 11.2.4.1. Overview
- 11.2.4.2. Products
- 11.2.4.3. SWOT Analysis
- 11.2.4.4. Recent Developments
- 11.2.4.5. Financials (Based on Availability)
- 11.2.5 Bell Power Solution
- 11.2.5.1. Overview
- 11.2.5.2. Products
- 11.2.5.3. SWOT Analysis
- 11.2.5.4. Recent Developments
- 11.2.5.5. Financials (Based on Availability)
- 11.2.6 BRUSA Elektronik AG
- 11.2.6.1. Overview
- 11.2.6.2. Products
- 11.2.6.3. SWOT Analysis
- 11.2.6.4. Recent Developments
- 11.2.6.5. Financials (Based on Availability)
- 11.2.7 Current Ways Inc.
- 11.2.7.1. Overview
- 11.2.7.2. Products
- 11.2.7.3. SWOT Analysis
- 11.2.7.4. Recent Developments
- 11.2.7.5. Financials (Based on Availability)
- 11.2.8 Delphi Technologies
- 11.2.8.1. Overview
- 11.2.8.2. Products
- 11.2.8.3. SWOT Analysis
- 11.2.8.4. Recent Developments
- 11.2.8.5. Financials (Based on Availability)
- 11.2.9 Eaton Corporation
- 11.2.9.1. Overview
- 11.2.9.2. Products
- 11.2.9.3. SWOT Analysis
- 11.2.9.4. Recent Developments
- 11.2.9.5. Financials (Based on Availability)
- 11.2.10 Stercom Power Solutions GmbH
- 11.2.10.1. Overview
- 11.2.10.2. Products
- 11.2.10.3. SWOT Analysis
- 11.2.10.4. Recent Developments
- 11.2.10.5. Financials (Based on Availability)
- 11.2.11 Delta Energy Systems
- 11.2.11.1. Overview
- 11.2.11.2. Products
- 11.2.11.3. SWOT Analysis
- 11.2.11.4. Recent Developments
- 11.2.11.5. Financials (Based on Availability)
- 11.2.12 STMicroelectronics
- 11.2.12.1. Overview
- 11.2.12.2. Products
- 11.2.12.3. SWOT Analysis
- 11.2.12.4. Recent Developments
- 11.2.12.5. Financials (Based on Availability)
- 11.2.13 innolectric AG
- 11.2.13.1. Overview
- 11.2.13.2. Products
- 11.2.13.3. SWOT Analysis
- 11.2.13.4. Recent Developments
- 11.2.13.5. Financials (Based on Availability)
- 11.2.14 AVID Technology Limited
- 11.2.14.1. Overview
- 11.2.14.2. Products
- 11.2.14.3. SWOT Analysis
- 11.2.14.4. Recent Developments
- 11.2.14.5. Financials (Based on Availability)
- 11.2.15 Ficosa International SA
- 11.2.15.1. Overview
- 11.2.15.2. Products
- 11.2.15.3. SWOT Analysis
- 11.2.15.4. Recent Developments
- 11.2.15.5. Financials (Based on Availability)
- 11.2.16 Toyota Industries Corporation
- 11.2.16.1. Overview
- 11.2.16.2. Products
- 11.2.16.3. SWOT Analysis
- 11.2.16.4. Recent Developments
- 11.2.16.5. Financials (Based on Availability)
- 11.2.17 Xepics Italia SRL
- 11.2.17.1. Overview
- 11.2.17.2. Products
- 11.2.17.3. SWOT Analysis
- 11.2.17.4. Recent Developments
- 11.2.17.5. Financials (Based on Availability)
- 11.2.18 Infineon Technologies AG
- 11.2.18.1. Overview
- 11.2.18.2. Products
- 11.2.18.3. SWOT Analysis
- 11.2.18.4. Recent Developments
- 11.2.18.5. Financials (Based on Availability)
- 11.2.1 BorgWarner Inc.
- Figure 1: Global Electric Vehicle On-Board Charger Market Revenue Breakdown (Billion, %) by Region 2024 & 2032
- Figure 2: North America Electric Vehicle On-Board Charger Market Revenue (Billion), by Rating 2024 & 2032
- Figure 3: North America Electric Vehicle On-Board Charger Market Revenue Share (%), by Rating 2024 & 2032
- Figure 4: North America Electric Vehicle On-Board Charger Market Revenue (Billion), by Propulsion 2024 & 2032
- Figure 5: North America Electric Vehicle On-Board Charger Market Revenue Share (%), by Propulsion 2024 & 2032
- Figure 6: North America Electric Vehicle On-Board Charger Market Revenue (Billion), by Country 2024 & 2032
- Figure 7: North America Electric Vehicle On-Board Charger Market Revenue Share (%), by Country 2024 & 2032
- Figure 8: Europe Electric Vehicle On-Board Charger Market Revenue (Billion), by Rating 2024 & 2032
- Figure 9: Europe Electric Vehicle On-Board Charger Market Revenue Share (%), by Rating 2024 & 2032
- Figure 10: Europe Electric Vehicle On-Board Charger Market Revenue (Billion), by Propulsion 2024 & 2032
- Figure 11: Europe Electric Vehicle On-Board Charger Market Revenue Share (%), by Propulsion 2024 & 2032
- Figure 12: Europe Electric Vehicle On-Board Charger Market Revenue (Billion), by Country 2024 & 2032
- Figure 13: Europe Electric Vehicle On-Board Charger Market Revenue Share (%), by Country 2024 & 2032
- Figure 14: Asia Pacific Electric Vehicle On-Board Charger Market Revenue (Billion), by Rating 2024 & 2032
- Figure 15: Asia Pacific Electric Vehicle On-Board Charger Market Revenue Share (%), by Rating 2024 & 2032
- Figure 16: Asia Pacific Electric Vehicle On-Board Charger Market Revenue (Billion), by Propulsion 2024 & 2032
- Figure 17: Asia Pacific Electric Vehicle On-Board Charger Market Revenue Share (%), by Propulsion 2024 & 2032
- Figure 18: Asia Pacific Electric Vehicle On-Board Charger Market Revenue (Billion), by Country 2024 & 2032
- Figure 19: Asia Pacific Electric Vehicle On-Board Charger Market Revenue Share (%), by Country 2024 & 2032
- Figure 20: Middle East & Africa Electric Vehicle On-Board Charger Market Revenue (Billion), by Rating 2024 & 2032
- Figure 21: Middle East & Africa Electric Vehicle On-Board Charger Market Revenue Share (%), by Rating 2024 & 2032
- Figure 22: Middle East & Africa Electric Vehicle On-Board Charger Market Revenue (Billion), by Propulsion 2024 & 2032
- Figure 23: Middle East & Africa Electric Vehicle On-Board Charger Market Revenue Share (%), by Propulsion 2024 & 2032
- Figure 24: Middle East & Africa Electric Vehicle On-Board Charger Market Revenue (Billion), by Country 2024 & 2032
- Figure 25: Middle East & Africa Electric Vehicle On-Board Charger Market Revenue Share (%), by Country 2024 & 2032
- Figure 26: Latin America Electric Vehicle On-Board Charger Market Revenue (Billion), by Rating 2024 & 2032
- Figure 27: Latin America Electric Vehicle On-Board Charger Market Revenue Share (%), by Rating 2024 & 2032
- Figure 28: Latin America Electric Vehicle On-Board Charger Market Revenue (Billion), by Propulsion 2024 & 2032
- Figure 29: Latin America Electric Vehicle On-Board Charger Market Revenue Share (%), by Propulsion 2024 & 2032
- Figure 30: Latin America Electric Vehicle On-Board Charger Market Revenue (Billion), by Country 2024 & 2032
- Figure 31: Latin America Electric Vehicle On-Board Charger Market Revenue Share (%), by Country 2024 & 2032
- Table 1: Global Electric Vehicle On-Board Charger Market Revenue Billion Forecast, by Region 2019 & 2032
- Table 2: Global Electric Vehicle On-Board Charger Market Revenue Billion Forecast, by Rating 2019 & 2032
- Table 3: Global Electric Vehicle On-Board Charger Market Revenue Billion Forecast, by Propulsion 2019 & 2032
- Table 4: Global Electric Vehicle On-Board Charger Market Revenue Billion Forecast, by Region 2019 & 2032
- Table 5: Global Electric Vehicle On-Board Charger Market Revenue Billion Forecast, by Rating 2019 & 2032
- Table 6: Global Electric Vehicle On-Board Charger Market Revenue Billion Forecast, by Propulsion 2019 & 2032
- Table 7: Global Electric Vehicle On-Board Charger Market Revenue Billion Forecast, by Country 2019 & 2032
- Table 8: U.S. Electric Vehicle On-Board Charger Market Revenue (Billion) Forecast, by Application 2019 & 2032
- Table 9: Canada Electric Vehicle On-Board Charger Market Revenue (Billion) Forecast, by Application 2019 & 2032
- Table 10: Mexico Electric Vehicle On-Board Charger Market Revenue (Billion) Forecast, by Application 2019 & 2032
- Table 11: Global Electric Vehicle On-Board Charger Market Revenue Billion Forecast, by Rating 2019 & 2032
- Table 12: Global Electric Vehicle On-Board Charger Market Revenue Billion Forecast, by Propulsion 2019 & 2032
- Table 13: Global Electric Vehicle On-Board Charger Market Revenue Billion Forecast, by Country 2019 & 2032
- Table 14: Norway Electric Vehicle On-Board Charger Market Revenue (Billion) Forecast, by Application 2019 & 2032
- Table 15: Germany Electric Vehicle On-Board Charger Market Revenue (Billion) Forecast, by Application 2019 & 2032
- Table 16: France Electric Vehicle On-Board Charger Market Revenue (Billion) Forecast, by Application 2019 & 2032
- Table 17: Netherlands Electric Vehicle On-Board Charger Market Revenue (Billion) Forecast, by Application 2019 & 2032
- Table 18: UK Electric Vehicle On-Board Charger Market Revenue (Billion) Forecast, by Application 2019 & 2032
- Table 19: Sweden Electric Vehicle On-Board Charger Market Revenue (Billion) Forecast, by Application 2019 & 2032
- Table 20: Global Electric Vehicle On-Board Charger Market Revenue Billion Forecast, by Rating 2019 & 2032
- Table 21: Global Electric Vehicle On-Board Charger Market Revenue Billion Forecast, by Propulsion 2019 & 2032
- Table 22: Global Electric Vehicle On-Board Charger Market Revenue Billion Forecast, by Country 2019 & 2032
- Table 23: China Electric Vehicle On-Board Charger Market Revenue (Billion) Forecast, by Application 2019 & 2032
- Table 24: Japan Electric Vehicle On-Board Charger Market Revenue (Billion) Forecast, by Application 2019 & 2032
- Table 25: India Electric Vehicle On-Board Charger Market Revenue (Billion) Forecast, by Application 2019 & 2032
- Table 26: South Korea Electric Vehicle On-Board Charger Market Revenue (Billion) Forecast, by Application 2019 & 2032
- Table 27: Singapore Electric Vehicle On-Board Charger Market Revenue (Billion) Forecast, by Application 2019 & 2032
- Table 28: Global Electric Vehicle On-Board Charger Market Revenue Billion Forecast, by Rating 2019 & 2032
- Table 29: Global Electric Vehicle On-Board Charger Market Revenue Billion Forecast, by Propulsion 2019 & 2032
- Table 30: Global Electric Vehicle On-Board Charger Market Revenue Billion Forecast, by Country 2019 & 2032
- Table 31: Saudi Arabia Electric Vehicle On-Board Charger Market Revenue (Billion) Forecast, by Application 2019 & 2032
- Table 32: UAE Electric Vehicle On-Board Charger Market Revenue (Billion) Forecast, by Application 2019 & 2032
- Table 33: Qatar Electric Vehicle On-Board Charger Market Revenue (Billion) Forecast, by Application 2019 & 2032
- Table 34: South Africa Electric Vehicle On-Board Charger Market Revenue (Billion) Forecast, by Application 2019 & 2032
- Table 35: Global Electric Vehicle On-Board Charger Market Revenue Billion Forecast, by Rating 2019 & 2032
- Table 36: Global Electric Vehicle On-Board Charger Market Revenue Billion Forecast, by Propulsion 2019 & 2032
- Table 37: Global Electric Vehicle On-Board Charger Market Revenue Billion Forecast, by Country 2019 & 2032
- Table 38: Brazil Electric Vehicle On-Board Charger Market Revenue (Billion) Forecast, by Application 2019 & 2032
- Table 39: Argentina Electric Vehicle On-Board Charger Market Revenue (Billion) Forecast, by Application 2019 & 2032
STEP 1 - Identification of Relevant Samples Size from Population Database


STEP 2 - Approaches for Defining Global Market Size (Value, Volume* & Price*)

Note* : In applicable scenarios
STEP 3 - Data Sources
Primary Research
- Web Analytics
- Survey Reports
- Research Institute
- Latest Research Reports
- Opinion Leaders
Secondary Research
- Annual Reports
- White Paper
- Latest Press Release
- Industry Association
- Paid Database
- Investor Presentations

STEP 4 - Data Triangulation
Involves using different sources of information in order to increase the validity of a study
These sources are likely to be stakeholders in a program - participants, other researchers, program staff, other community members, and so on.
Then we put all data in single framework & apply various statistical tools to find out the dynamic on the market.
During the analysis stage, feedback from the stakeholder groups would be compared to determine areas of agreement as well as areas of divergence
Frequently Asked Questions
Related Reports
See the similar reports


About Market Insights Report
Market Insights Reports offers comprehensive market research reports and analysis, giving businesses important information about their clients, rivals, and sector to help them make well-informed decisions on operations, marketing, and business strategy. We offer a variety of services in addition to market research, data analysis, and strategy planning. In order to find opportunities and learn more about our competitors and the industry at large, we employ competitive analysis. To identify areas for development, we also evaluate our performance against that of our rivals. We can determine the places at which we can offer our clients the most value by performing value chain analysis.
Additionally, clients receive a thorough overview of their industry business environment. We can find trends that help us forecast future possibilities and threats by examining global macroeconomic dynamics and consumer behavior patterns. By analyzing their features and advantages, contrasting them with comparable items on the market, and evaluating both their quantitative and qualitative performance, we comprehensively evaluate our clients' products. This allows us to assist customers in determining how their goods compare to those of their rivals and in creating successful marketing plans. Our group has been successful in gaining a thorough grasp of our clients' requirements and offering them creative solutions. We currently provide services to more than 50 nations in Europe, the Middle East, Africa, Latin America, Asia Pacific, and North America. Because of our global reach, we have been able to establish trusting bonds with our partners and clients in various nations, improving customer service and forging a more cohesive worldwide presence.