
.jpg&w=3840&q=100)
Market
Insights
Reports delivered globally, covering a wide range of industries and sectors.
Clients who trust our expertise and rely on our insights for business decisions.
Managed Reports, ensuring seamless updates and premium service.
Satisfied Customers, committed to delivering exceptional value and quality.
Fiber Optics Market 2025-2033 Trends: Unveiling Growth Opportunities and Competitor Dynamics
Fiber Optics Market by Fiber Type (Glass fibers, Plastic optical fibers), by Cable Type (Single-mode, Multi-mode), by Deployment (Underground, Aerial, Underwater), by End User (Telecommunication, Power utilities, Aerospace & defense, Data center, Others), by North America (U.S., Canada), by Europe (Germany, UK, France, Italy, Spain, Rest of Europe), by Asia Pacific (China, Japan, India, South Korea, ANZ, Rest of Asia Pacific), by Latin America (Brazil, Mexico, Rest of Latin America), by MEA (UAE, Saudi Arabia, South Africa, Rest of MEA) Forecast 2025-2033
Fiber Optics Market 2025-2033 Trends: Unveiling Growth Opportunities and Competitor Dynamics
Fiber Optics Market
The size of the Fiber Optics Market was valued at USD 8.1 Billion in 2024 and is projected to reach USD 15.29 Billion by 2033, with an expected CAGR of 9.5% during the forecast period. This growth is primarily driven by the increasing demand for high-speed internet, the expansion of data centers, and the growing adoption of fiber optics across various industries. As digital transformation accelerates, fiber optics is becoming the preferred choice for telecommunications, cloud computing, and industrial applications due to its superior bandwidth, lower latency, and greater flexibility compared to traditional copper cables.The rapid deployment of 5G networks and advancements in smart infrastructure further fuel market expansion. Additionally, fiber optics is gaining traction in healthcare, defense, and aerospace for secure and high-speed data transmission. Key players shaping the market include STL Tech, TE Connectivity, Corning Incorporated, Newport Corporation, Broadcom, CommScope, and Fiberoptics Technology Incorporated. With ongoing innovations, the fiber optics market is poised for sustained growth.
Fiber Optics Market Concentration & Characteristics
The fiber optics market is characterized by a high degree of concentration, with a few major players accounting for a majority of the market share. These players have strong financial resources and well-established distribution networks, which give them a competitive advantage over smaller companies.
The fiber optics market is also characterized by a high level of innovation, as companies are constantly developing new technologies to improve the performance and cost-effectiveness of their products. This innovation is driven by the increasing demand for faster and more reliable data transmission.
The fiber optics market is also subject to a number of regulations, which vary from country to country. These regulations impact the development, deployment, and maintenance of fiber optic networks.
Fiber Optics Market Trends
The fiber optics market is experiencing a number of key trends, including:
- The increasing demand for high-speed internet connectivity is driving the growth of the fiber optics market. This demand is being fueled by the proliferation of data-intensive applications, such as video streaming, cloud computing, and online gaming.
- The proliferation of data centers is also driving the growth of the fiber optics market. Data centers require high-capacity fiber optic networks to connect to each other and to the internet.
- The growing adoption of fiber optics in various end-use industries is also driving the growth of the fiber optics market. Fiber optics is increasingly being used in telecommunications, data centers, cloud computing, and other industries that require fast and reliable data transmission.

Key Region or Country & Segment to Dominate the Market
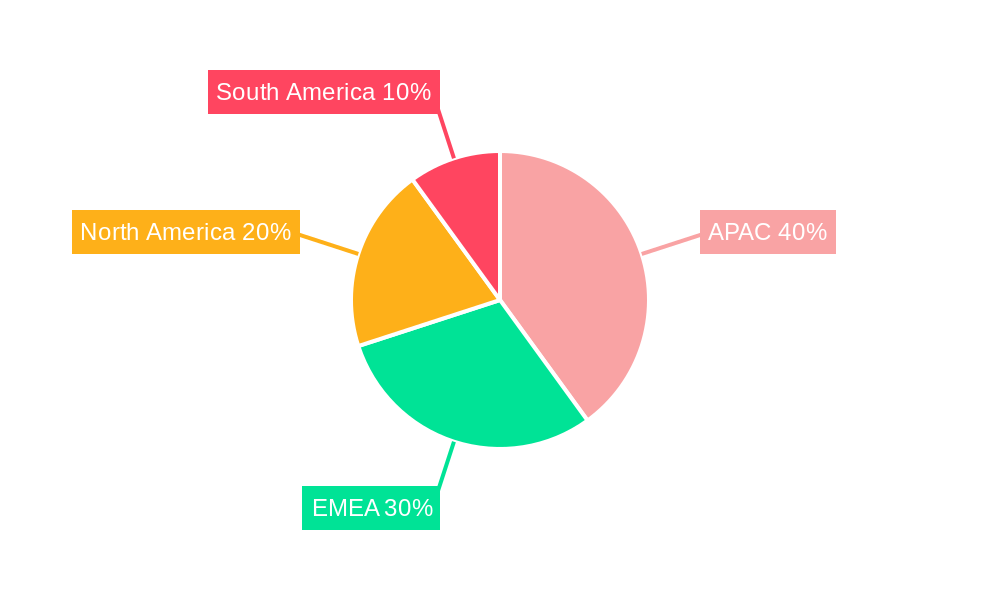
North America and Europe are the largest markets for fiber optics, accounting for a majority of the global market share. These regions have a well-developed telecommunications infrastructure and a high demand for high-speed internet connectivity.
Asia Pacific is the fastest-growing market for fiber optics, due to the rapid growth of the telecommunications and data center markets in this region.
The telecommunications segment is the largest end-use segment for fiber optics, accounting for a majority of the global market share. This segment is driven by the increasing demand for high-speed internet connectivity.
The data center segment is the fastest-growing end-use segment for fiber optics, due to the rapid growth of the cloud computing market.
Fiber Optics Market Product Insights Report Coverage & Deliverables
The Fiber Optics Market Product Insights Report Coverage & Deliverables include:
- Executive Summary
- Market Overview
- Market Segmentation
- Market Dynamics
- Competitive Landscape
- Key Trends and Strategies
- Forecasts
- Conclusions and Recommendations
Fiber Optics Market Analysis
The fiber optics market is a mature market with a high degree of competition. The market is expected to continue to grow at a steady pace over the next few years, driven by the increasing demand for high-speed internet connectivity, the proliferation of data centers, and the growing adoption of fiber optics in various end-use industries.
The key challenges facing the fiber optics market include the high cost of deployment, the lack of skilled labor, and the regulatory barriers. However, these challenges are expected to be gradually overcome as the market continues to grow.
Fiber Optics Market Regional Insights
The fiber optics market is segmented into five regions: North America, Europe, Asia Pacific, Latin America, and the Middle East and Africa. North America and Europe are the largest markets for fiber optics, accounting for a majority of the global market share. These regions have a well-developed telecommunications infrastructure and a high demand for high-speed internet connectivity.
Asia Pacific is the fastest-growing market for fiber optics, due to the rapid growth of the telecommunications and data center markets in this region. Latin America and the Middle East and Africa are also emerging markets for fiber optics, with a growing demand for high-speed internet connectivity.
Driving Forces: What's Propelling the Fiber Optics Market
The key factors driving the growth of the fiber optics market include:
- The increasing demand for high-speed internet connectivity
- The proliferation of data centers
- The growing adoption of fiber optics in various end-use industries
- Government initiatives to promote the deployment of fiber optic networks
Challenges and Restraints in Fiber Optics Market
The key challenges and restraints in the fiber optics market include:
- The high cost of deployment
- The lack of skilled labor
- The regulatory barriers
Emerging Trends in Fiber Optics Market
The key emerging trends in the fiber optics market include:
- The development of new fiber optic technologies
- The increasing adoption of fiber optics in new applications
- The growing demand for fiber optic networks in rural areas
Fiber Optics Industry News
October 2023: Sterlite Technologies Ltd (STL) developed a 160-micron optical fiber, the world's slimmest fiber for telecommunication. STL's 160-micron fiber can offer three times more capacity than traditional 250-micron fiber. It is expected to revolutionize deployment, bandwidth capacity, and green quotient of the networks.
January 2023: SICK AG launched its next-generation intelligent and powerful WLL80 Fiber Optic Sensors, designed for easy configuration and highly versatile integration into machinery and conveyor systems wherever rapid, high-accuracy detection is required in confined spaces. The SICK WLL80 fiber optic amplifiers can be combined with SICK's new LLX portfolio of state-of-the-art fibers. Any length of flexible LLX fibers up to 20m can be specified alongside a versatile range of sensor heads.
Fiber Optics Market Segmentation
- 1. Fiber Type
- 1.1. Glass fibers
- 1.2. Plastic optical fibers
- 2. Cable Type
- 2.1. Single-mode
- 2.2. Multi-mode
- 3. Deployment
- 3.1. Underground
- 3.2. Aerial
- 3.3. Underwater
- 4. End User
- 4.1. Telecommunication
- 4.2. Power utilities
- 4.3. Aerospace & defense
- 4.4. Data center
- 4.5. Others
Fiber Optics Market Segmentation By Geography
- 1. North America
- 1.1. U.S.
- 1.2. Canada
- 2. Europe
- 2.1. Germany
- 2.2. UK
- 2.3. France
- 2.4. Italy
- 2.5. Spain
- 2.6. Rest of Europe
- 3. Asia Pacific
- 3.1. China
- 3.2. Japan
- 3.3. India
- 3.4. South Korea
- 3.5. ANZ
- 3.6. Rest of Asia Pacific
- 4. Latin America
- 4.1. Brazil
- 4.2. Mexico
- 4.3. Rest of Latin America
- 5. MEA
- 5.1. UAE
- 5.2. Saudi Arabia
- 5.3. South Africa
- 5.4. Rest of MEA
Fiber Optics Market REPORT HIGHLIGHTS
| Aspects | Details |
|---|---|
| Study Period | 2019-2033 |
| Base Year | 2024 |
| Estimated Year | 2025 |
| Forecast Period | 2025-2033 |
| Historical Period | 2019-2024 |
| Growth Rate | CAGR of 9.5% from 2019-2033 |
| Segmentation |
|
- 1. Introduction
- 1.1. Research Scope
- 1.2. Market Segmentation
- 1.3. Research Methodology
- 1.4. Definitions and Assumptions
- 2. Executive Summary
- 2.1. Introduction
- 3. Market Dynamics
- 3.1. Introduction
- 3.2. Market Drivers
- 3.2.1 Increase in adoption of FTTH connectivity
- 3.2.2 Wide implementation of 5G
- 3.2.3 Rising demand for the internet and fast connectivity
- 3.2.4 Expansion of telecommunications infrastructure
- 3.2.5 Rising adoption of fiber optic sensors
- 3.3. Market Restrains
- 3.3.1 Issues in the installation of fiber optics in critical terrain
- 3.3.2 High associated costs
- 3.4. Market Trends
- 3.4.1 The increasing demand for high-speed internet connectivity is driving the growth of the fiber optics market. This demand is being fueled by the proliferation of data-intensive applications
- 3.4.2 such as video streaming
- 3.4.3 cloud computing
- 3.4.4 and online gaming.
- 4. Market Factor Analysis
- 4.1. Porters Five Forces
- 4.2. Supply/Value Chain
- 4.3. PESTEL analysis
- 4.4. Market Entropy
- 4.5. Patent/Trademark Analysis
- 5. Global Fiber Optics Market Analysis, Insights and Forecast, 2019-2031
- 5.1. Market Analysis, Insights and Forecast - by Fiber Type
- 5.1.1. Glass fibers
- 5.1.2. Plastic optical fibers
- 5.2. Market Analysis, Insights and Forecast - by Cable Type
- 5.2.1. Single-mode
- 5.2.2. Multi-mode
- 5.3. Market Analysis, Insights and Forecast - by Deployment
- 5.3.1. Underground
- 5.3.2. Aerial
- 5.3.3. Underwater
- 5.4. Market Analysis, Insights and Forecast - by End User
- 5.4.1. Telecommunication
- 5.4.2. Power utilities
- 5.4.3. Aerospace & defense
- 5.4.4. Data center
- 5.4.5. Others
- 5.5. Market Analysis, Insights and Forecast - by Region
- 5.5.1. North America
- 5.5.2. Europe
- 5.5.3. Asia Pacific
- 5.5.4. Latin America
- 5.5.5. MEA
- 5.1. Market Analysis, Insights and Forecast - by Fiber Type
- 6. North America Fiber Optics Market Analysis, Insights and Forecast, 2019-2031
- 6.1. Market Analysis, Insights and Forecast - by Fiber Type
- 6.1.1. Glass fibers
- 6.1.2. Plastic optical fibers
- 6.2. Market Analysis, Insights and Forecast - by Cable Type
- 6.2.1. Single-mode
- 6.2.2. Multi-mode
- 6.3. Market Analysis, Insights and Forecast - by Deployment
- 6.3.1. Underground
- 6.3.2. Aerial
- 6.3.3. Underwater
- 6.4. Market Analysis, Insights and Forecast - by End User
- 6.4.1. Telecommunication
- 6.4.2. Power utilities
- 6.4.3. Aerospace & defense
- 6.4.4. Data center
- 6.4.5. Others
- 6.1. Market Analysis, Insights and Forecast - by Fiber Type
- 7. Europe Fiber Optics Market Analysis, Insights and Forecast, 2019-2031
- 7.1. Market Analysis, Insights and Forecast - by Fiber Type
- 7.1.1. Glass fibers
- 7.1.2. Plastic optical fibers
- 7.2. Market Analysis, Insights and Forecast - by Cable Type
- 7.2.1. Single-mode
- 7.2.2. Multi-mode
- 7.3. Market Analysis, Insights and Forecast - by Deployment
- 7.3.1. Underground
- 7.3.2. Aerial
- 7.3.3. Underwater
- 7.4. Market Analysis, Insights and Forecast - by End User
- 7.4.1. Telecommunication
- 7.4.2. Power utilities
- 7.4.3. Aerospace & defense
- 7.4.4. Data center
- 7.4.5. Others
- 7.1. Market Analysis, Insights and Forecast - by Fiber Type
- 8. Asia Pacific Fiber Optics Market Analysis, Insights and Forecast, 2019-2031
- 8.1. Market Analysis, Insights and Forecast - by Fiber Type
- 8.1.1. Glass fibers
- 8.1.2. Plastic optical fibers
- 8.2. Market Analysis, Insights and Forecast - by Cable Type
- 8.2.1. Single-mode
- 8.2.2. Multi-mode
- 8.3. Market Analysis, Insights and Forecast - by Deployment
- 8.3.1. Underground
- 8.3.2. Aerial
- 8.3.3. Underwater
- 8.4. Market Analysis, Insights and Forecast - by End User
- 8.4.1. Telecommunication
- 8.4.2. Power utilities
- 8.4.3. Aerospace & defense
- 8.4.4. Data center
- 8.4.5. Others
- 8.1. Market Analysis, Insights and Forecast - by Fiber Type
- 9. Latin America Fiber Optics Market Analysis, Insights and Forecast, 2019-2031
- 9.1. Market Analysis, Insights and Forecast - by Fiber Type
- 9.1.1. Glass fibers
- 9.1.2. Plastic optical fibers
- 9.2. Market Analysis, Insights and Forecast - by Cable Type
- 9.2.1. Single-mode
- 9.2.2. Multi-mode
- 9.3. Market Analysis, Insights and Forecast - by Deployment
- 9.3.1. Underground
- 9.3.2. Aerial
- 9.3.3. Underwater
- 9.4. Market Analysis, Insights and Forecast - by End User
- 9.4.1. Telecommunication
- 9.4.2. Power utilities
- 9.4.3. Aerospace & defense
- 9.4.4. Data center
- 9.4.5. Others
- 9.1. Market Analysis, Insights and Forecast - by Fiber Type
- 10. MEA Fiber Optics Market Analysis, Insights and Forecast, 2019-2031
- 10.1. Market Analysis, Insights and Forecast - by Fiber Type
- 10.1.1. Glass fibers
- 10.1.2. Plastic optical fibers
- 10.2. Market Analysis, Insights and Forecast - by Cable Type
- 10.2.1. Single-mode
- 10.2.2. Multi-mode
- 10.3. Market Analysis, Insights and Forecast - by Deployment
- 10.3.1. Underground
- 10.3.2. Aerial
- 10.3.3. Underwater
- 10.4. Market Analysis, Insights and Forecast - by End User
- 10.4.1. Telecommunication
- 10.4.2. Power utilities
- 10.4.3. Aerospace & defense
- 10.4.4. Data center
- 10.4.5. Others
- 10.1. Market Analysis, Insights and Forecast - by Fiber Type
- 11. Competitive Analysis
- 11.1. Global Market Share Analysis 2024
- 11.2. Company Profiles
- 11.2.1 STL Tech
- 11.2.1.1. Overview
- 11.2.1.2. Products
- 11.2.1.3. SWOT Analysis
- 11.2.1.4. Recent Developments
- 11.2.1.5. Financials (Based on Availability)
- 11.2.2 TE Connectivity
- 11.2.2.1. Overview
- 11.2.2.2. Products
- 11.2.2.3. SWOT Analysis
- 11.2.2.4. Recent Developments
- 11.2.2.5. Financials (Based on Availability)
- 11.2.3 Corning Incorporated
- 11.2.3.1. Overview
- 11.2.3.2. Products
- 11.2.3.3. SWOT Analysis
- 11.2.3.4. Recent Developments
- 11.2.3.5. Financials (Based on Availability)
- 11.2.4 Newport Corporation
- 11.2.4.1. Overview
- 11.2.4.2. Products
- 11.2.4.3. SWOT Analysis
- 11.2.4.4. Recent Developments
- 11.2.4.5. Financials (Based on Availability)
- 11.2.5 Broadcom
- 11.2.5.1. Overview
- 11.2.5.2. Products
- 11.2.5.3. SWOT Analysis
- 11.2.5.4. Recent Developments
- 11.2.5.5. Financials (Based on Availability)
- 11.2.6 Commscope
- 11.2.6.1. Overview
- 11.2.6.2. Products
- 11.2.6.3. SWOT Analysis
- 11.2.6.4. Recent Developments
- 11.2.6.5. Financials (Based on Availability)
- 11.2.7 Fiberoptics Technology Incorporated
- 11.2.7.1. Overview
- 11.2.7.2. Products
- 11.2.7.3. SWOT Analysis
- 11.2.7.4. Recent Developments
- 11.2.7.5. Financials (Based on Availability)
- 11.2.1 STL Tech
- Figure 1: Global Fiber Optics Market Revenue Breakdown (Billion, %) by Region 2024 & 2032
- Figure 2: Global Fiber Optics Market Volume Breakdown (units, %) by Region 2024 & 2032
- Figure 3: North America Fiber Optics Market Revenue (Billion), by Fiber Type 2024 & 2032
- Figure 4: North America Fiber Optics Market Volume (units), by Fiber Type 2024 & 2032
- Figure 5: North America Fiber Optics Market Revenue Share (%), by Fiber Type 2024 & 2032
- Figure 6: North America Fiber Optics Market Volume Share (%), by Fiber Type 2024 & 2032
- Figure 7: North America Fiber Optics Market Revenue (Billion), by Cable Type 2024 & 2032
- Figure 8: North America Fiber Optics Market Volume (units), by Cable Type 2024 & 2032
- Figure 9: North America Fiber Optics Market Revenue Share (%), by Cable Type 2024 & 2032
- Figure 10: North America Fiber Optics Market Volume Share (%), by Cable Type 2024 & 2032
- Figure 11: North America Fiber Optics Market Revenue (Billion), by Deployment 2024 & 2032
- Figure 12: North America Fiber Optics Market Volume (units), by Deployment 2024 & 2032
- Figure 13: North America Fiber Optics Market Revenue Share (%), by Deployment 2024 & 2032
- Figure 14: North America Fiber Optics Market Volume Share (%), by Deployment 2024 & 2032
- Figure 15: North America Fiber Optics Market Revenue (Billion), by End User 2024 & 2032
- Figure 16: North America Fiber Optics Market Volume (units), by End User 2024 & 2032
- Figure 17: North America Fiber Optics Market Revenue Share (%), by End User 2024 & 2032
- Figure 18: North America Fiber Optics Market Volume Share (%), by End User 2024 & 2032
- Figure 19: North America Fiber Optics Market Revenue (Billion), by Country 2024 & 2032
- Figure 20: North America Fiber Optics Market Volume (units), by Country 2024 & 2032
- Figure 21: North America Fiber Optics Market Revenue Share (%), by Country 2024 & 2032
- Figure 22: North America Fiber Optics Market Volume Share (%), by Country 2024 & 2032
- Figure 23: Europe Fiber Optics Market Revenue (Billion), by Fiber Type 2024 & 2032
- Figure 24: Europe Fiber Optics Market Volume (units), by Fiber Type 2024 & 2032
- Figure 25: Europe Fiber Optics Market Revenue Share (%), by Fiber Type 2024 & 2032
- Figure 26: Europe Fiber Optics Market Volume Share (%), by Fiber Type 2024 & 2032
- Figure 27: Europe Fiber Optics Market Revenue (Billion), by Cable Type 2024 & 2032
- Figure 28: Europe Fiber Optics Market Volume (units), by Cable Type 2024 & 2032
- Figure 29: Europe Fiber Optics Market Revenue Share (%), by Cable Type 2024 & 2032
- Figure 30: Europe Fiber Optics Market Volume Share (%), by Cable Type 2024 & 2032
- Figure 31: Europe Fiber Optics Market Revenue (Billion), by Deployment 2024 & 2032
- Figure 32: Europe Fiber Optics Market Volume (units), by Deployment 2024 & 2032
- Figure 33: Europe Fiber Optics Market Revenue Share (%), by Deployment 2024 & 2032
- Figure 34: Europe Fiber Optics Market Volume Share (%), by Deployment 2024 & 2032
- Figure 35: Europe Fiber Optics Market Revenue (Billion), by End User 2024 & 2032
- Figure 36: Europe Fiber Optics Market Volume (units), by End User 2024 & 2032
- Figure 37: Europe Fiber Optics Market Revenue Share (%), by End User 2024 & 2032
- Figure 38: Europe Fiber Optics Market Volume Share (%), by End User 2024 & 2032
- Figure 39: Europe Fiber Optics Market Revenue (Billion), by Country 2024 & 2032
- Figure 40: Europe Fiber Optics Market Volume (units), by Country 2024 & 2032
- Figure 41: Europe Fiber Optics Market Revenue Share (%), by Country 2024 & 2032
- Figure 42: Europe Fiber Optics Market Volume Share (%), by Country 2024 & 2032
- Figure 43: Asia Pacific Fiber Optics Market Revenue (Billion), by Fiber Type 2024 & 2032
- Figure 44: Asia Pacific Fiber Optics Market Volume (units), by Fiber Type 2024 & 2032
- Figure 45: Asia Pacific Fiber Optics Market Revenue Share (%), by Fiber Type 2024 & 2032
- Figure 46: Asia Pacific Fiber Optics Market Volume Share (%), by Fiber Type 2024 & 2032
- Figure 47: Asia Pacific Fiber Optics Market Revenue (Billion), by Cable Type 2024 & 2032
- Figure 48: Asia Pacific Fiber Optics Market Volume (units), by Cable Type 2024 & 2032
- Figure 49: Asia Pacific Fiber Optics Market Revenue Share (%), by Cable Type 2024 & 2032
- Figure 50: Asia Pacific Fiber Optics Market Volume Share (%), by Cable Type 2024 & 2032
- Figure 51: Asia Pacific Fiber Optics Market Revenue (Billion), by Deployment 2024 & 2032
- Figure 52: Asia Pacific Fiber Optics Market Volume (units), by Deployment 2024 & 2032
- Figure 53: Asia Pacific Fiber Optics Market Revenue Share (%), by Deployment 2024 & 2032
- Figure 54: Asia Pacific Fiber Optics Market Volume Share (%), by Deployment 2024 & 2032
- Figure 55: Asia Pacific Fiber Optics Market Revenue (Billion), by End User 2024 & 2032
- Figure 56: Asia Pacific Fiber Optics Market Volume (units), by End User 2024 & 2032
- Figure 57: Asia Pacific Fiber Optics Market Revenue Share (%), by End User 2024 & 2032
- Figure 58: Asia Pacific Fiber Optics Market Volume Share (%), by End User 2024 & 2032
- Figure 59: Asia Pacific Fiber Optics Market Revenue (Billion), by Country 2024 & 2032
- Figure 60: Asia Pacific Fiber Optics Market Volume (units), by Country 2024 & 2032
- Figure 61: Asia Pacific Fiber Optics Market Revenue Share (%), by Country 2024 & 2032
- Figure 62: Asia Pacific Fiber Optics Market Volume Share (%), by Country 2024 & 2032
- Figure 63: Latin America Fiber Optics Market Revenue (Billion), by Fiber Type 2024 & 2032
- Figure 64: Latin America Fiber Optics Market Volume (units), by Fiber Type 2024 & 2032
- Figure 65: Latin America Fiber Optics Market Revenue Share (%), by Fiber Type 2024 & 2032
- Figure 66: Latin America Fiber Optics Market Volume Share (%), by Fiber Type 2024 & 2032
- Figure 67: Latin America Fiber Optics Market Revenue (Billion), by Cable Type 2024 & 2032
- Figure 68: Latin America Fiber Optics Market Volume (units), by Cable Type 2024 & 2032
- Figure 69: Latin America Fiber Optics Market Revenue Share (%), by Cable Type 2024 & 2032
- Figure 70: Latin America Fiber Optics Market Volume Share (%), by Cable Type 2024 & 2032
- Figure 71: Latin America Fiber Optics Market Revenue (Billion), by Deployment 2024 & 2032
- Figure 72: Latin America Fiber Optics Market Volume (units), by Deployment 2024 & 2032
- Figure 73: Latin America Fiber Optics Market Revenue Share (%), by Deployment 2024 & 2032
- Figure 74: Latin America Fiber Optics Market Volume Share (%), by Deployment 2024 & 2032
- Figure 75: Latin America Fiber Optics Market Revenue (Billion), by End User 2024 & 2032
- Figure 76: Latin America Fiber Optics Market Volume (units), by End User 2024 & 2032
- Figure 77: Latin America Fiber Optics Market Revenue Share (%), by End User 2024 & 2032
- Figure 78: Latin America Fiber Optics Market Volume Share (%), by End User 2024 & 2032
- Figure 79: Latin America Fiber Optics Market Revenue (Billion), by Country 2024 & 2032
- Figure 80: Latin America Fiber Optics Market Volume (units), by Country 2024 & 2032
- Figure 81: Latin America Fiber Optics Market Revenue Share (%), by Country 2024 & 2032
- Figure 82: Latin America Fiber Optics Market Volume Share (%), by Country 2024 & 2032
- Figure 83: MEA Fiber Optics Market Revenue (Billion), by Fiber Type 2024 & 2032
- Figure 84: MEA Fiber Optics Market Volume (units), by Fiber Type 2024 & 2032
- Figure 85: MEA Fiber Optics Market Revenue Share (%), by Fiber Type 2024 & 2032
- Figure 86: MEA Fiber Optics Market Volume Share (%), by Fiber Type 2024 & 2032
- Figure 87: MEA Fiber Optics Market Revenue (Billion), by Cable Type 2024 & 2032
- Figure 88: MEA Fiber Optics Market Volume (units), by Cable Type 2024 & 2032
- Figure 89: MEA Fiber Optics Market Revenue Share (%), by Cable Type 2024 & 2032
- Figure 90: MEA Fiber Optics Market Volume Share (%), by Cable Type 2024 & 2032
- Figure 91: MEA Fiber Optics Market Revenue (Billion), by Deployment 2024 & 2032
- Figure 92: MEA Fiber Optics Market Volume (units), by Deployment 2024 & 2032
- Figure 93: MEA Fiber Optics Market Revenue Share (%), by Deployment 2024 & 2032
- Figure 94: MEA Fiber Optics Market Volume Share (%), by Deployment 2024 & 2032
- Figure 95: MEA Fiber Optics Market Revenue (Billion), by End User 2024 & 2032
- Figure 96: MEA Fiber Optics Market Volume (units), by End User 2024 & 2032
- Figure 97: MEA Fiber Optics Market Revenue Share (%), by End User 2024 & 2032
- Figure 98: MEA Fiber Optics Market Volume Share (%), by End User 2024 & 2032
- Figure 99: MEA Fiber Optics Market Revenue (Billion), by Country 2024 & 2032
- Figure 100: MEA Fiber Optics Market Volume (units), by Country 2024 & 2032
- Figure 101: MEA Fiber Optics Market Revenue Share (%), by Country 2024 & 2032
- Figure 102: MEA Fiber Optics Market Volume Share (%), by Country 2024 & 2032
- Table 1: Global Fiber Optics Market Revenue Billion Forecast, by Region 2019 & 2032
- Table 2: Global Fiber Optics Market Volume units Forecast, by Region 2019 & 2032
- Table 3: Global Fiber Optics Market Revenue Billion Forecast, by Fiber Type 2019 & 2032
- Table 4: Global Fiber Optics Market Volume units Forecast, by Fiber Type 2019 & 2032
- Table 5: Global Fiber Optics Market Revenue Billion Forecast, by Cable Type 2019 & 2032
- Table 6: Global Fiber Optics Market Volume units Forecast, by Cable Type 2019 & 2032
- Table 7: Global Fiber Optics Market Revenue Billion Forecast, by Deployment 2019 & 2032
- Table 8: Global Fiber Optics Market Volume units Forecast, by Deployment 2019 & 2032
- Table 9: Global Fiber Optics Market Revenue Billion Forecast, by End User 2019 & 2032
- Table 10: Global Fiber Optics Market Volume units Forecast, by End User 2019 & 2032
- Table 11: Global Fiber Optics Market Revenue Billion Forecast, by Region 2019 & 2032
- Table 12: Global Fiber Optics Market Volume units Forecast, by Region 2019 & 2032
- Table 13: Global Fiber Optics Market Revenue Billion Forecast, by Fiber Type 2019 & 2032
- Table 14: Global Fiber Optics Market Volume units Forecast, by Fiber Type 2019 & 2032
- Table 15: Global Fiber Optics Market Revenue Billion Forecast, by Cable Type 2019 & 2032
- Table 16: Global Fiber Optics Market Volume units Forecast, by Cable Type 2019 & 2032
- Table 17: Global Fiber Optics Market Revenue Billion Forecast, by Deployment 2019 & 2032
- Table 18: Global Fiber Optics Market Volume units Forecast, by Deployment 2019 & 2032
- Table 19: Global Fiber Optics Market Revenue Billion Forecast, by End User 2019 & 2032
- Table 20: Global Fiber Optics Market Volume units Forecast, by End User 2019 & 2032
- Table 21: Global Fiber Optics Market Revenue Billion Forecast, by Country 2019 & 2032
- Table 22: Global Fiber Optics Market Volume units Forecast, by Country 2019 & 2032
- Table 23: U.S. Fiber Optics Market Revenue (Billion) Forecast, by Application 2019 & 2032
- Table 24: U.S. Fiber Optics Market Volume (units) Forecast, by Application 2019 & 2032
- Table 25: Canada Fiber Optics Market Revenue (Billion) Forecast, by Application 2019 & 2032
- Table 26: Canada Fiber Optics Market Volume (units) Forecast, by Application 2019 & 2032
- Table 27: Global Fiber Optics Market Revenue Billion Forecast, by Fiber Type 2019 & 2032
- Table 28: Global Fiber Optics Market Volume units Forecast, by Fiber Type 2019 & 2032
- Table 29: Global Fiber Optics Market Revenue Billion Forecast, by Cable Type 2019 & 2032
- Table 30: Global Fiber Optics Market Volume units Forecast, by Cable Type 2019 & 2032
- Table 31: Global Fiber Optics Market Revenue Billion Forecast, by Deployment 2019 & 2032
- Table 32: Global Fiber Optics Market Volume units Forecast, by Deployment 2019 & 2032
- Table 33: Global Fiber Optics Market Revenue Billion Forecast, by End User 2019 & 2032
- Table 34: Global Fiber Optics Market Volume units Forecast, by End User 2019 & 2032
- Table 35: Global Fiber Optics Market Revenue Billion Forecast, by Country 2019 & 2032
- Table 36: Global Fiber Optics Market Volume units Forecast, by Country 2019 & 2032
- Table 37: Germany Fiber Optics Market Revenue (Billion) Forecast, by Application 2019 & 2032
- Table 38: Germany Fiber Optics Market Volume (units) Forecast, by Application 2019 & 2032
- Table 39: UK Fiber Optics Market Revenue (Billion) Forecast, by Application 2019 & 2032
- Table 40: UK Fiber Optics Market Volume (units) Forecast, by Application 2019 & 2032
- Table 41: France Fiber Optics Market Revenue (Billion) Forecast, by Application 2019 & 2032
- Table 42: France Fiber Optics Market Volume (units) Forecast, by Application 2019 & 2032
- Table 43: Italy Fiber Optics Market Revenue (Billion) Forecast, by Application 2019 & 2032
- Table 44: Italy Fiber Optics Market Volume (units) Forecast, by Application 2019 & 2032
- Table 45: Spain Fiber Optics Market Revenue (Billion) Forecast, by Application 2019 & 2032
- Table 46: Spain Fiber Optics Market Volume (units) Forecast, by Application 2019 & 2032
- Table 47: Rest of Europe Fiber Optics Market Revenue (Billion) Forecast, by Application 2019 & 2032
- Table 48: Rest of Europe Fiber Optics Market Volume (units) Forecast, by Application 2019 & 2032
- Table 49: Global Fiber Optics Market Revenue Billion Forecast, by Fiber Type 2019 & 2032
- Table 50: Global Fiber Optics Market Volume units Forecast, by Fiber Type 2019 & 2032
- Table 51: Global Fiber Optics Market Revenue Billion Forecast, by Cable Type 2019 & 2032
- Table 52: Global Fiber Optics Market Volume units Forecast, by Cable Type 2019 & 2032
- Table 53: Global Fiber Optics Market Revenue Billion Forecast, by Deployment 2019 & 2032
- Table 54: Global Fiber Optics Market Volume units Forecast, by Deployment 2019 & 2032
- Table 55: Global Fiber Optics Market Revenue Billion Forecast, by End User 2019 & 2032
- Table 56: Global Fiber Optics Market Volume units Forecast, by End User 2019 & 2032
- Table 57: Global Fiber Optics Market Revenue Billion Forecast, by Country 2019 & 2032
- Table 58: Global Fiber Optics Market Volume units Forecast, by Country 2019 & 2032
- Table 59: China Fiber Optics Market Revenue (Billion) Forecast, by Application 2019 & 2032
- Table 60: China Fiber Optics Market Volume (units) Forecast, by Application 2019 & 2032
- Table 61: Japan Fiber Optics Market Revenue (Billion) Forecast, by Application 2019 & 2032
- Table 62: Japan Fiber Optics Market Volume (units) Forecast, by Application 2019 & 2032
- Table 63: India Fiber Optics Market Revenue (Billion) Forecast, by Application 2019 & 2032
- Table 64: India Fiber Optics Market Volume (units) Forecast, by Application 2019 & 2032
- Table 65: South Korea Fiber Optics Market Revenue (Billion) Forecast, by Application 2019 & 2032
- Table 66: South Korea Fiber Optics Market Volume (units) Forecast, by Application 2019 & 2032
- Table 67: ANZ Fiber Optics Market Revenue (Billion) Forecast, by Application 2019 & 2032
- Table 68: ANZ Fiber Optics Market Volume (units) Forecast, by Application 2019 & 2032
- Table 69: Rest of Asia Pacific Fiber Optics Market Revenue (Billion) Forecast, by Application 2019 & 2032
- Table 70: Rest of Asia Pacific Fiber Optics Market Volume (units) Forecast, by Application 2019 & 2032
- Table 71: Global Fiber Optics Market Revenue Billion Forecast, by Fiber Type 2019 & 2032
- Table 72: Global Fiber Optics Market Volume units Forecast, by Fiber Type 2019 & 2032
- Table 73: Global Fiber Optics Market Revenue Billion Forecast, by Cable Type 2019 & 2032
- Table 74: Global Fiber Optics Market Volume units Forecast, by Cable Type 2019 & 2032
- Table 75: Global Fiber Optics Market Revenue Billion Forecast, by Deployment 2019 & 2032
- Table 76: Global Fiber Optics Market Volume units Forecast, by Deployment 2019 & 2032
- Table 77: Global Fiber Optics Market Revenue Billion Forecast, by End User 2019 & 2032
- Table 78: Global Fiber Optics Market Volume units Forecast, by End User 2019 & 2032
- Table 79: Global Fiber Optics Market Revenue Billion Forecast, by Country 2019 & 2032
- Table 80: Global Fiber Optics Market Volume units Forecast, by Country 2019 & 2032
- Table 81: Brazil Fiber Optics Market Revenue (Billion) Forecast, by Application 2019 & 2032
- Table 82: Brazil Fiber Optics Market Volume (units) Forecast, by Application 2019 & 2032
- Table 83: Mexico Fiber Optics Market Revenue (Billion) Forecast, by Application 2019 & 2032
- Table 84: Mexico Fiber Optics Market Volume (units) Forecast, by Application 2019 & 2032
- Table 85: Rest of Latin America Fiber Optics Market Revenue (Billion) Forecast, by Application 2019 & 2032
- Table 86: Rest of Latin America Fiber Optics Market Volume (units) Forecast, by Application 2019 & 2032
- Table 87: Global Fiber Optics Market Revenue Billion Forecast, by Fiber Type 2019 & 2032
- Table 88: Global Fiber Optics Market Volume units Forecast, by Fiber Type 2019 & 2032
- Table 89: Global Fiber Optics Market Revenue Billion Forecast, by Cable Type 2019 & 2032
- Table 90: Global Fiber Optics Market Volume units Forecast, by Cable Type 2019 & 2032
- Table 91: Global Fiber Optics Market Revenue Billion Forecast, by Deployment 2019 & 2032
- Table 92: Global Fiber Optics Market Volume units Forecast, by Deployment 2019 & 2032
- Table 93: Global Fiber Optics Market Revenue Billion Forecast, by End User 2019 & 2032
- Table 94: Global Fiber Optics Market Volume units Forecast, by End User 2019 & 2032
- Table 95: Global Fiber Optics Market Revenue Billion Forecast, by Country 2019 & 2032
- Table 96: Global Fiber Optics Market Volume units Forecast, by Country 2019 & 2032
- Table 97: UAE Fiber Optics Market Revenue (Billion) Forecast, by Application 2019 & 2032
- Table 98: UAE Fiber Optics Market Volume (units) Forecast, by Application 2019 & 2032
- Table 99: Saudi Arabia Fiber Optics Market Revenue (Billion) Forecast, by Application 2019 & 2032
- Table 100: Saudi Arabia Fiber Optics Market Volume (units) Forecast, by Application 2019 & 2032
- Table 101: South Africa Fiber Optics Market Revenue (Billion) Forecast, by Application 2019 & 2032
- Table 102: South Africa Fiber Optics Market Volume (units) Forecast, by Application 2019 & 2032
- Table 103: Rest of MEA Fiber Optics Market Revenue (Billion) Forecast, by Application 2019 & 2032
- Table 104: Rest of MEA Fiber Optics Market Volume (units) Forecast, by Application 2019 & 2032
STEP 1 - Identification of Relevant Samples Size from Population Database


STEP 2 - Approaches for Defining Global Market Size (Value, Volume* & Price*)

Note* : In applicable scenarios
STEP 3 - Data Sources
Primary Research
- Web Analytics
- Survey Reports
- Research Institute
- Latest Research Reports
- Opinion Leaders
Secondary Research
- Annual Reports
- White Paper
- Latest Press Release
- Industry Association
- Paid Database
- Investor Presentations

STEP 4 - Data Triangulation
Involves using different sources of information in order to increase the validity of a study
These sources are likely to be stakeholders in a program - participants, other researchers, program staff, other community members, and so on.
Then we put all data in single framework & apply various statistical tools to find out the dynamic on the market.
During the analysis stage, feedback from the stakeholder groups would be compared to determine areas of agreement as well as areas of divergence
Frequently Asked Questions
Related Reports
See the similar reports


About Market Insights Report
Market Insights Reports offers comprehensive market research reports and analysis, giving businesses important information about their clients, rivals, and sector to help them make well-informed decisions on operations, marketing, and business strategy. We offer a variety of services in addition to market research, data analysis, and strategy planning. In order to find opportunities and learn more about our competitors and the industry at large, we employ competitive analysis. To identify areas for development, we also evaluate our performance against that of our rivals. We can determine the places at which we can offer our clients the most value by performing value chain analysis.
Additionally, clients receive a thorough overview of their industry business environment. We can find trends that help us forecast future possibilities and threats by examining global macroeconomic dynamics and consumer behavior patterns. By analyzing their features and advantages, contrasting them with comparable items on the market, and evaluating both their quantitative and qualitative performance, we comprehensively evaluate our clients' products. This allows us to assist customers in determining how their goods compare to those of their rivals and in creating successful marketing plans. Our group has been successful in gaining a thorough grasp of our clients' requirements and offering them creative solutions. We currently provide services to more than 50 nations in Europe, the Middle East, Africa, Latin America, Asia Pacific, and North America. Because of our global reach, we have been able to establish trusting bonds with our partners and clients in various nations, improving customer service and forging a more cohesive worldwide presence.