
.jpg&w=3840&q=100)
Market
Insights
Reports delivered globally, covering a wide range of industries and sectors.
Clients who trust our expertise and rely on our insights for business decisions.
Managed Reports, ensuring seamless updates and premium service.
Satisfied Customers, committed to delivering exceptional value and quality.
Growlers Market Strategic Insights: Analysis 2025 and Forecasts 2033
Growlers Market by Material (Stainless Steel, Glass, Ceramic, Plastic), by Size (Less than 32 oz, 32 oz to 64 oz, More than 64 oz), by Closure type (Screw Cap, Swing Top, Flip Top, Others), by Application (Craft Beer, Other Alcoholic Beverages, Non-Alcoholic Beverages, Others), by Distribution Channel (Brewery Tasting Rooms, Retail Stores, Online Retailers, Others), by North America (U.S., Canada), by Europe (Germany, UK, France, Spain, Italy), by Asia Pacific (China, Japan, India, Australia, South Korea, Indonesia, Malaysia), by Latin America (Brazil, Mexico, Argentina), by Middle East & Africa (South Africa, Saudi Arabia, UAE, Egypt) Forecast 2025-2033
Growlers Market Strategic Insights: Analysis 2025 and Forecasts 2033
Key Insights
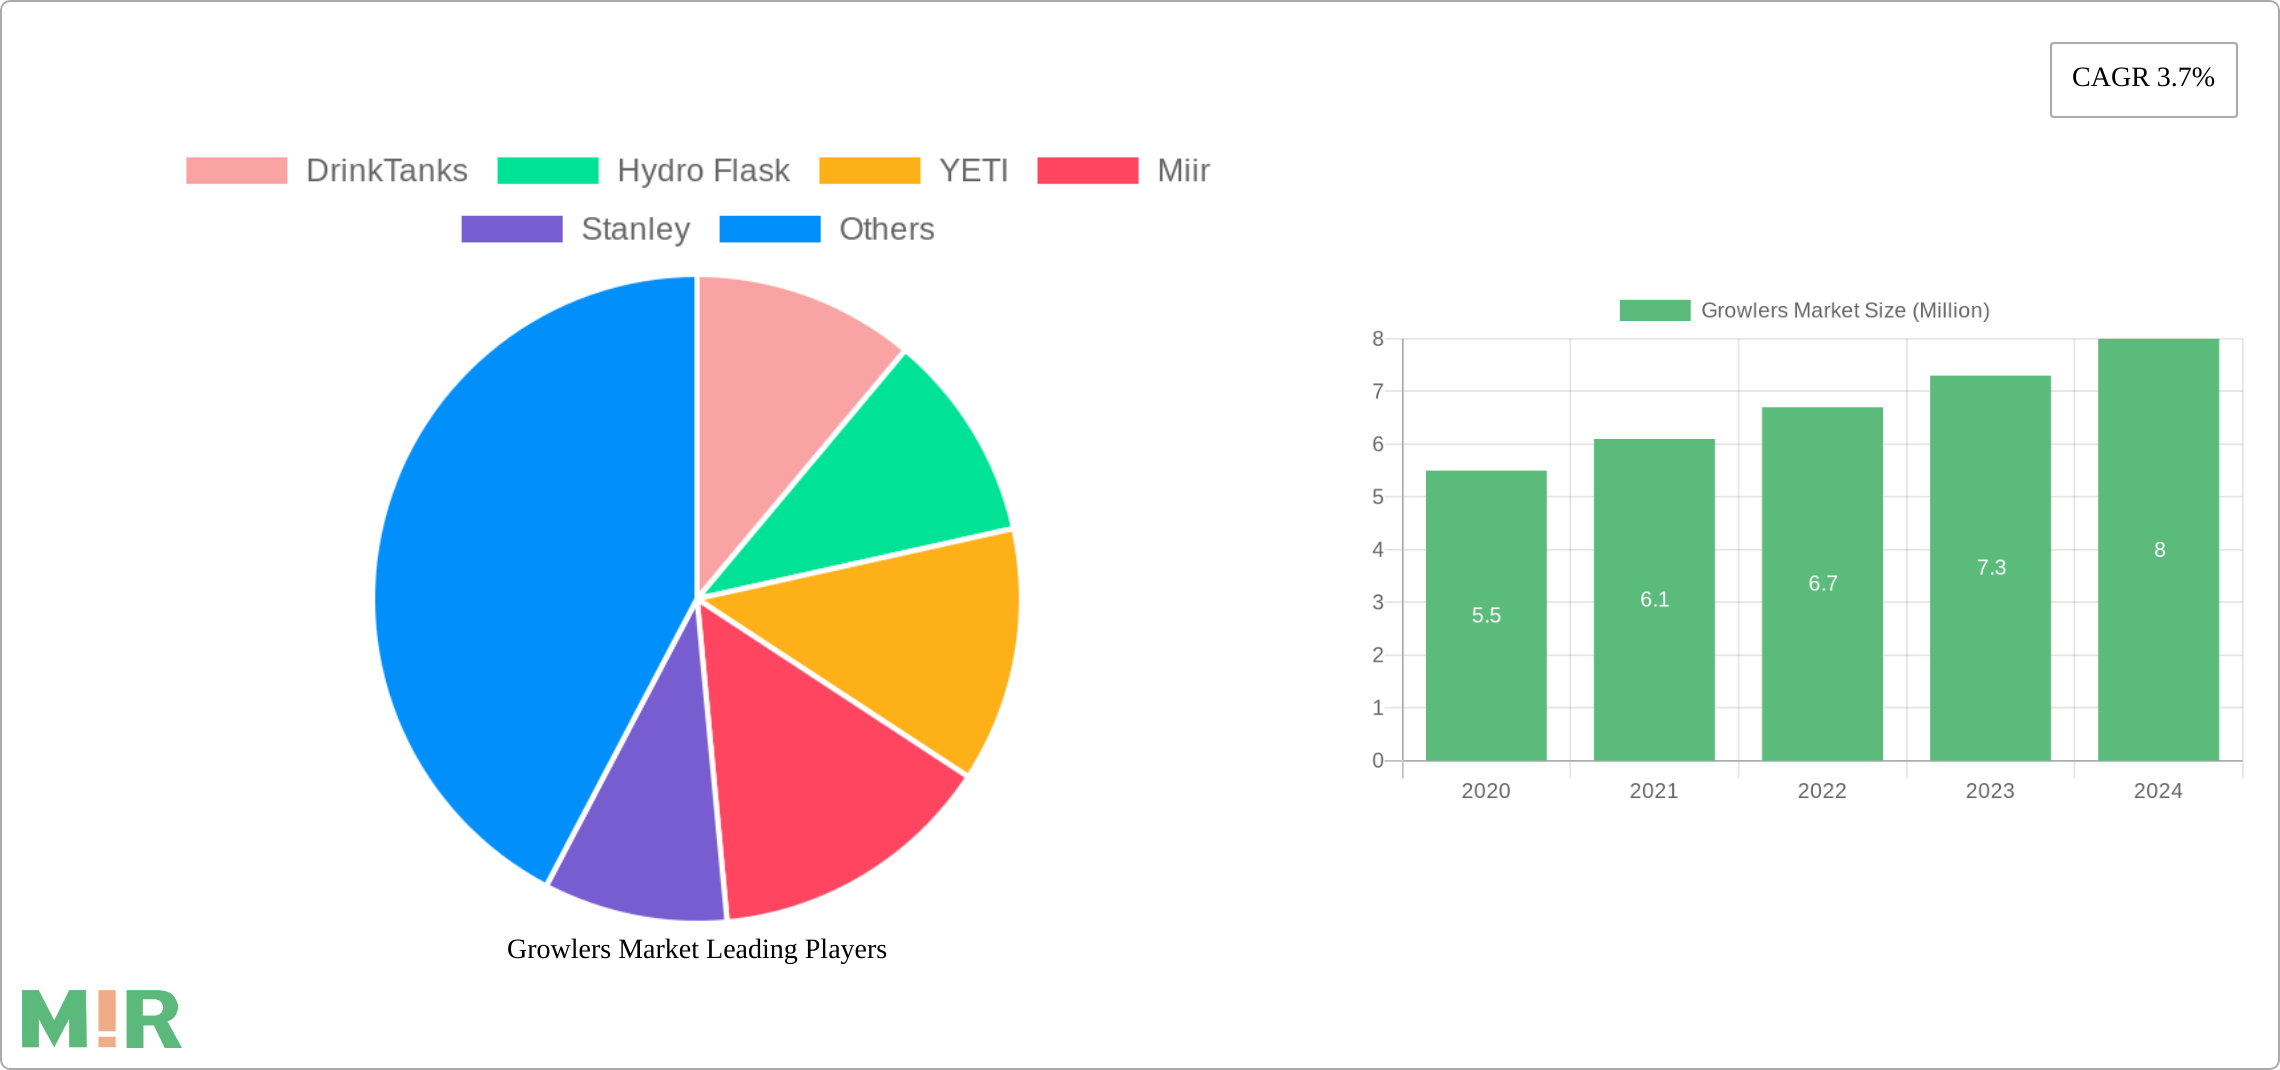
The size of the Growlers Market was valued at USD 530.1 Million in 2024 and is projected to reach USD 683.61 Million by 2033, with an expected CAGR of 3.7% during the forecast period. The Growlers Market targets the increasing need for reusable containers, tailor-made for transporting craft beer, cider, and various drinks. These vessels, usually constructed from glass, stainless steel, or ceramic, provide an eco-friendly option compared to disposable packaging. The market is influenced by the growing appeal of craft breweries and the transition to sustainable practices, as both consumers and companies aim to minimize waste. Growlers, available in different sizes, enable customers to buy beverages in quantity and savor fresh, locally-made drinks. This market includes growlers, caps, dispensers, and related accessories, such as promotional products utilized by breweries and bars. As craft beer culture gains popularity and the number of eco-aware consumers increases, the Growlers Market is expected to experience notable growth. Technological improvements, such as better sealing techniques and personalized branding choices, are increasing the attractiveness of growlers. Furthermore, evolving laws regarding alcohol distribution and the growing trend of on-demand consumption play a role in the growth of this market segment.
Growlers Market Concentration & Characteristics
Key players in the growlers market include DrinkTanks, Hydro Flask, YETI, Miir, Stanley, Klean Kanteen, Manna, Igloo, Lifeline, and Fifty/Fifty. These companies have established a strong presence in the market through strategic partnerships, product innovation, and customer outreach programs.
The market is characterized by a high level of innovation, with companies constantly introducing new features and designs to appeal to consumers. Regulations and product substitutes have a moderate impact on the market, while end-user concentration is relatively low.
Growlers Market Trends
Key market trends include the growing popularity of non-alcoholic beverages, the increasing demand for larger growlers, and the increasing adoption of online distribution channels. The market is also witnessing a shift towards more sustainable materials, such as glass and stainless steel.

Key Region or Country & Segment to Dominate the Market
North America is the largest market for growlers, followed by Europe and Asia Pacific. The United States is the dominant country in the North American region, while China is the fastest-growing market in Asia Pacific. The stainless steel segment is expected to dominate the market throughout the forecast period.
Growlers Market Product Insights Report Coverage & Deliverables
This market report provides comprehensive insights into the growlers market, including market size, market share, and growth forecasts. It also analyzes market trends, key drivers, and challenges. The report provides valuable information for manufacturers, distributors, and end-users.
Growlers Market Analysis
The growlers market has witnessed a steady growth in recent years, driven by the increasing demand for craft beers and other specialty beverages. The market is expected to continue growing at a moderate pace over the next few years.
Growlers Market Regional Insights
North America is the largest market for growlers, followed by Europe and Asia Pacific. The United States is the dominant country in the North American region, while China is the fastest-growing market in Asia Pacific.
- North America: U.S., Canada
- Europe: Germany, UK, France, Spain, Italy
- Asia Pacific: China, Japan, India, Australia, South Korea, Indonesia, Malaysia
- Latin America: Brazil, Mexico, Argentina
- Middle East & Africa: South Africa, Saudi Arabia, UAE, Egypt
Driving Forces: What's Propelling the Growlers Market
The key factors driving the growth of the growlers market include:
- Rising popularity of craft beers and other specialty beverages
- Growing demand for sustainable packaging solutions
- Increasing availability of growlers in various sizes and materials
Challenges and Restraints in Growlers Market
Some of the challenges and restraints faced by the growlers market include:
- Competition from alternative packaging solutions, such as cans and bottles
- Concerns about product breakage during transportation
- Limited shelf life of beverages stored in growlers
Emerging Trends in Growlers Market
Emerging trends in the growlers market include:
- Growing popularity of non-alcoholic beverages
- Increasing demand for larger growlers
- Increasing adoption of online distribution channels
- Shift towards more sustainable materials
Growlers Industry News
- November 2021: Ardagh Group S.A. acquired Consol Holdings Proprietary Limited, a leading producer of glass packaging in the Africa continent.
- April 2021: Alpha Packaging acquired Boxmore Plastics as part of its expansion plans in Europe.
Leading Players in the Growlers Market
Growlers Market Segmentation
- 1. Material
- 1.1. Stainless Steel
- 1.2. Glass
- 1.3. Ceramic
- 1.4. Plastic
- 2. Size
- 2.1. Less than 32 oz
- 2.2. 32 oz to 64 oz
- 2.3. More than 64 oz
- 3. Closure type
- 3.1. Screw Cap
- 3.2. Swing Top
- 3.3. Flip Top
- 3.4. Others
- 4. Application
- 4.1. Craft Beer
- 4.2. Other Alcoholic Beverages
- 4.3. Non-Alcoholic Beverages
- 4.4. Others
- 5. Distribution Channel
- 5.1. Brewery Tasting Rooms
- 5.2. Retail Stores
- 5.3. Online Retailers
- 5.4. Others
Growlers Market Segmentation By Geography
- 1. North America
- 1.1. U.S.
- 1.2. Canada
- 2. Europe
- 2.1. Germany
- 2.2. UK
- 2.3. France
- 2.4. Spain
- 2.5. Italy
- 3. Asia Pacific
- 3.1. China
- 3.2. Japan
- 3.3. India
- 3.4. Australia
- 3.5. South Korea
- 3.6. Indonesia
- 3.7. Malaysia
- 4. Latin America
- 4.1. Brazil
- 4.2. Mexico
- 4.3. Argentina
- 5. Middle East & Africa
- 5.1. South Africa
- 5.2. Saudi Arabia
- 5.3. UAE
- 5.4. Egypt

Growlers Market REPORT HIGHLIGHTS
| Aspects | Details |
|---|---|
| Study Period | 2019-2033 |
| Base Year | 2024 |
| Estimated Year | 2025 |
| Forecast Period | 2025-2033 |
| Historical Period | 2019-2024 |
| Growth Rate | CAGR of 3.7% from 2019-2033 |
| Segmentation |
|
- 1. Introduction
- 1.1. Research Scope
- 1.2. Market Segmentation
- 1.3. Research Methodology
- 1.4. Definitions and Assumptions
- 2. Executive Summary
- 2.1. Introduction
- 3. Market Dynamics
- 3.1. Introduction
- 3.2. Market Drivers
- 3.2.1 Growing beverage industry
- 3.2.2 Expansion of the food service sector
- 3.2.3 Rising population
- 3.3. Market Restrains
- 3.3.1 Regulatory and Compliance Issues
- 3.3.2 Hygiene and Cleaning Concerns
- 3.3.3 Quality Control and Consistency
- 3.4. Market Trends
- 4. Market Factor Analysis
- 4.1. Porters Five Forces
- 4.2. Supply/Value Chain
- 4.3. PESTEL analysis
- 4.4. Market Entropy
- 4.5. Patent/Trademark Analysis
- 5. Global Growlers Market Analysis, Insights and Forecast, 2019-2031
- 5.1. Market Analysis, Insights and Forecast - by Material
- 5.1.1. Stainless Steel
- 5.1.2. Glass
- 5.1.3. Ceramic
- 5.1.4. Plastic
- 5.2. Market Analysis, Insights and Forecast - by Size
- 5.2.1. Less than 32 oz
- 5.2.2. 32 oz to 64 oz
- 5.2.3. More than 64 oz
- 5.3. Market Analysis, Insights and Forecast - by Closure type
- 5.3.1. Screw Cap
- 5.3.2. Swing Top
- 5.3.3. Flip Top
- 5.3.4. Others
- 5.4. Market Analysis, Insights and Forecast - by Application
- 5.4.1. Craft Beer
- 5.4.2. Other Alcoholic Beverages
- 5.4.3. Non-Alcoholic Beverages
- 5.4.4. Others
- 5.5. Market Analysis, Insights and Forecast - by Distribution Channel
- 5.5.1. Brewery Tasting Rooms
- 5.5.2. Retail Stores
- 5.5.3. Online Retailers
- 5.5.4. Others
- 5.6. Market Analysis, Insights and Forecast - by Region
- 5.6.1. North America
- 5.6.2. Europe
- 5.6.3. Asia Pacific
- 5.6.4. Latin America
- 5.6.5. Middle East & Africa
- 5.1. Market Analysis, Insights and Forecast - by Material
- 6. North America Growlers Market Analysis, Insights and Forecast, 2019-2031
- 6.1. Market Analysis, Insights and Forecast - by Material
- 6.1.1. Stainless Steel
- 6.1.2. Glass
- 6.1.3. Ceramic
- 6.1.4. Plastic
- 6.2. Market Analysis, Insights and Forecast - by Size
- 6.2.1. Less than 32 oz
- 6.2.2. 32 oz to 64 oz
- 6.2.3. More than 64 oz
- 6.3. Market Analysis, Insights and Forecast - by Closure type
- 6.3.1. Screw Cap
- 6.3.2. Swing Top
- 6.3.3. Flip Top
- 6.3.4. Others
- 6.4. Market Analysis, Insights and Forecast - by Application
- 6.4.1. Craft Beer
- 6.4.2. Other Alcoholic Beverages
- 6.4.3. Non-Alcoholic Beverages
- 6.4.4. Others
- 6.5. Market Analysis, Insights and Forecast - by Distribution Channel
- 6.5.1. Brewery Tasting Rooms
- 6.5.2. Retail Stores
- 6.5.3. Online Retailers
- 6.5.4. Others
- 6.1. Market Analysis, Insights and Forecast - by Material
- 7. Europe Growlers Market Analysis, Insights and Forecast, 2019-2031
- 7.1. Market Analysis, Insights and Forecast - by Material
- 7.1.1. Stainless Steel
- 7.1.2. Glass
- 7.1.3. Ceramic
- 7.1.4. Plastic
- 7.2. Market Analysis, Insights and Forecast - by Size
- 7.2.1. Less than 32 oz
- 7.2.2. 32 oz to 64 oz
- 7.2.3. More than 64 oz
- 7.3. Market Analysis, Insights and Forecast - by Closure type
- 7.3.1. Screw Cap
- 7.3.2. Swing Top
- 7.3.3. Flip Top
- 7.3.4. Others
- 7.4. Market Analysis, Insights and Forecast - by Application
- 7.4.1. Craft Beer
- 7.4.2. Other Alcoholic Beverages
- 7.4.3. Non-Alcoholic Beverages
- 7.4.4. Others
- 7.5. Market Analysis, Insights and Forecast - by Distribution Channel
- 7.5.1. Brewery Tasting Rooms
- 7.5.2. Retail Stores
- 7.5.3. Online Retailers
- 7.5.4. Others
- 7.1. Market Analysis, Insights and Forecast - by Material
- 8. Asia Pacific Growlers Market Analysis, Insights and Forecast, 2019-2031
- 8.1. Market Analysis, Insights and Forecast - by Material
- 8.1.1. Stainless Steel
- 8.1.2. Glass
- 8.1.3. Ceramic
- 8.1.4. Plastic
- 8.2. Market Analysis, Insights and Forecast - by Size
- 8.2.1. Less than 32 oz
- 8.2.2. 32 oz to 64 oz
- 8.2.3. More than 64 oz
- 8.3. Market Analysis, Insights and Forecast - by Closure type
- 8.3.1. Screw Cap
- 8.3.2. Swing Top
- 8.3.3. Flip Top
- 8.3.4. Others
- 8.4. Market Analysis, Insights and Forecast - by Application
- 8.4.1. Craft Beer
- 8.4.2. Other Alcoholic Beverages
- 8.4.3. Non-Alcoholic Beverages
- 8.4.4. Others
- 8.5. Market Analysis, Insights and Forecast - by Distribution Channel
- 8.5.1. Brewery Tasting Rooms
- 8.5.2. Retail Stores
- 8.5.3. Online Retailers
- 8.5.4. Others
- 8.1. Market Analysis, Insights and Forecast - by Material
- 9. Latin America Growlers Market Analysis, Insights and Forecast, 2019-2031
- 9.1. Market Analysis, Insights and Forecast - by Material
- 9.1.1. Stainless Steel
- 9.1.2. Glass
- 9.1.3. Ceramic
- 9.1.4. Plastic
- 9.2. Market Analysis, Insights and Forecast - by Size
- 9.2.1. Less than 32 oz
- 9.2.2. 32 oz to 64 oz
- 9.2.3. More than 64 oz
- 9.3. Market Analysis, Insights and Forecast - by Closure type
- 9.3.1. Screw Cap
- 9.3.2. Swing Top
- 9.3.3. Flip Top
- 9.3.4. Others
- 9.4. Market Analysis, Insights and Forecast - by Application
- 9.4.1. Craft Beer
- 9.4.2. Other Alcoholic Beverages
- 9.4.3. Non-Alcoholic Beverages
- 9.4.4. Others
- 9.5. Market Analysis, Insights and Forecast - by Distribution Channel
- 9.5.1. Brewery Tasting Rooms
- 9.5.2. Retail Stores
- 9.5.3. Online Retailers
- 9.5.4. Others
- 9.1. Market Analysis, Insights and Forecast - by Material
- 10. Middle East & Africa Growlers Market Analysis, Insights and Forecast, 2019-2031
- 10.1. Market Analysis, Insights and Forecast - by Material
- 10.1.1. Stainless Steel
- 10.1.2. Glass
- 10.1.3. Ceramic
- 10.1.4. Plastic
- 10.2. Market Analysis, Insights and Forecast - by Size
- 10.2.1. Less than 32 oz
- 10.2.2. 32 oz to 64 oz
- 10.2.3. More than 64 oz
- 10.3. Market Analysis, Insights and Forecast - by Closure type
- 10.3.1. Screw Cap
- 10.3.2. Swing Top
- 10.3.3. Flip Top
- 10.3.4. Others
- 10.4. Market Analysis, Insights and Forecast - by Application
- 10.4.1. Craft Beer
- 10.4.2. Other Alcoholic Beverages
- 10.4.3. Non-Alcoholic Beverages
- 10.4.4. Others
- 10.5. Market Analysis, Insights and Forecast - by Distribution Channel
- 10.5.1. Brewery Tasting Rooms
- 10.5.2. Retail Stores
- 10.5.3. Online Retailers
- 10.5.4. Others
- 10.1. Market Analysis, Insights and Forecast - by Material
- 11. Competitive Analysis
- 11.1. Global Market Share Analysis 2024
- 11.2. Company Profiles
- 11.2.1 DrinkTanks
- 11.2.1.1. Overview
- 11.2.1.2. Products
- 11.2.1.3. SWOT Analysis
- 11.2.1.4. Recent Developments
- 11.2.1.5. Financials (Based on Availability)
- 11.2.2 Hydro Flask
- 11.2.2.1. Overview
- 11.2.2.2. Products
- 11.2.2.3. SWOT Analysis
- 11.2.2.4. Recent Developments
- 11.2.2.5. Financials (Based on Availability)
- 11.2.3 YETI
- 11.2.3.1. Overview
- 11.2.3.2. Products
- 11.2.3.3. SWOT Analysis
- 11.2.3.4. Recent Developments
- 11.2.3.5. Financials (Based on Availability)
- 11.2.4 Miir
- 11.2.4.1. Overview
- 11.2.4.2. Products
- 11.2.4.3. SWOT Analysis
- 11.2.4.4. Recent Developments
- 11.2.4.5. Financials (Based on Availability)
- 11.2.5 Stanley
- 11.2.5.1. Overview
- 11.2.5.2. Products
- 11.2.5.3. SWOT Analysis
- 11.2.5.4. Recent Developments
- 11.2.5.5. Financials (Based on Availability)
- 11.2.6 Klean Kanteen
- 11.2.6.1. Overview
- 11.2.6.2. Products
- 11.2.6.3. SWOT Analysis
- 11.2.6.4. Recent Developments
- 11.2.6.5. Financials (Based on Availability)
- 11.2.7 Manna
- 11.2.7.1. Overview
- 11.2.7.2. Products
- 11.2.7.3. SWOT Analysis
- 11.2.7.4. Recent Developments
- 11.2.7.5. Financials (Based on Availability)
- 11.2.8 Igloo
- 11.2.8.1. Overview
- 11.2.8.2. Products
- 11.2.8.3. SWOT Analysis
- 11.2.8.4. Recent Developments
- 11.2.8.5. Financials (Based on Availability)
- 11.2.9 Lifeline
- 11.2.9.1. Overview
- 11.2.9.2. Products
- 11.2.9.3. SWOT Analysis
- 11.2.9.4. Recent Developments
- 11.2.9.5. Financials (Based on Availability)
- 11.2.10 Fifty/Fifty
- 11.2.10.1. Overview
- 11.2.10.2. Products
- 11.2.10.3. SWOT Analysis
- 11.2.10.4. Recent Developments
- 11.2.10.5. Financials (Based on Availability)
- 11.2.1 DrinkTanks
- Figure 1: Global Growlers Market Revenue Breakdown (Million, %) by Region 2024 & 2032
- Figure 2: Global Growlers Market Volume Breakdown (K Tons, %) by Region 2024 & 2032
- Figure 3: North America Growlers Market Revenue (Million), by Material 2024 & 2032
- Figure 4: North America Growlers Market Volume (K Tons), by Material 2024 & 2032
- Figure 5: North America Growlers Market Revenue Share (%), by Material 2024 & 2032
- Figure 6: North America Growlers Market Volume Share (%), by Material 2024 & 2032
- Figure 7: North America Growlers Market Revenue (Million), by Size 2024 & 2032
- Figure 8: North America Growlers Market Volume (K Tons), by Size 2024 & 2032
- Figure 9: North America Growlers Market Revenue Share (%), by Size 2024 & 2032
- Figure 10: North America Growlers Market Volume Share (%), by Size 2024 & 2032
- Figure 11: North America Growlers Market Revenue (Million), by Closure type 2024 & 2032
- Figure 12: North America Growlers Market Volume (K Tons), by Closure type 2024 & 2032
- Figure 13: North America Growlers Market Revenue Share (%), by Closure type 2024 & 2032
- Figure 14: North America Growlers Market Volume Share (%), by Closure type 2024 & 2032
- Figure 15: North America Growlers Market Revenue (Million), by Application 2024 & 2032
- Figure 16: North America Growlers Market Volume (K Tons), by Application 2024 & 2032
- Figure 17: North America Growlers Market Revenue Share (%), by Application 2024 & 2032
- Figure 18: North America Growlers Market Volume Share (%), by Application 2024 & 2032
- Figure 19: North America Growlers Market Revenue (Million), by Distribution Channel 2024 & 2032
- Figure 20: North America Growlers Market Volume (K Tons), by Distribution Channel 2024 & 2032
- Figure 21: North America Growlers Market Revenue Share (%), by Distribution Channel 2024 & 2032
- Figure 22: North America Growlers Market Volume Share (%), by Distribution Channel 2024 & 2032
- Figure 23: North America Growlers Market Revenue (Million), by Country 2024 & 2032
- Figure 24: North America Growlers Market Volume (K Tons), by Country 2024 & 2032
- Figure 25: North America Growlers Market Revenue Share (%), by Country 2024 & 2032
- Figure 26: North America Growlers Market Volume Share (%), by Country 2024 & 2032
- Figure 27: Europe Growlers Market Revenue (Million), by Material 2024 & 2032
- Figure 28: Europe Growlers Market Volume (K Tons), by Material 2024 & 2032
- Figure 29: Europe Growlers Market Revenue Share (%), by Material 2024 & 2032
- Figure 30: Europe Growlers Market Volume Share (%), by Material 2024 & 2032
- Figure 31: Europe Growlers Market Revenue (Million), by Size 2024 & 2032
- Figure 32: Europe Growlers Market Volume (K Tons), by Size 2024 & 2032
- Figure 33: Europe Growlers Market Revenue Share (%), by Size 2024 & 2032
- Figure 34: Europe Growlers Market Volume Share (%), by Size 2024 & 2032
- Figure 35: Europe Growlers Market Revenue (Million), by Closure type 2024 & 2032
- Figure 36: Europe Growlers Market Volume (K Tons), by Closure type 2024 & 2032
- Figure 37: Europe Growlers Market Revenue Share (%), by Closure type 2024 & 2032
- Figure 38: Europe Growlers Market Volume Share (%), by Closure type 2024 & 2032
- Figure 39: Europe Growlers Market Revenue (Million), by Application 2024 & 2032
- Figure 40: Europe Growlers Market Volume (K Tons), by Application 2024 & 2032
- Figure 41: Europe Growlers Market Revenue Share (%), by Application 2024 & 2032
- Figure 42: Europe Growlers Market Volume Share (%), by Application 2024 & 2032
- Figure 43: Europe Growlers Market Revenue (Million), by Distribution Channel 2024 & 2032
- Figure 44: Europe Growlers Market Volume (K Tons), by Distribution Channel 2024 & 2032
- Figure 45: Europe Growlers Market Revenue Share (%), by Distribution Channel 2024 & 2032
- Figure 46: Europe Growlers Market Volume Share (%), by Distribution Channel 2024 & 2032
- Figure 47: Europe Growlers Market Revenue (Million), by Country 2024 & 2032
- Figure 48: Europe Growlers Market Volume (K Tons), by Country 2024 & 2032
- Figure 49: Europe Growlers Market Revenue Share (%), by Country 2024 & 2032
- Figure 50: Europe Growlers Market Volume Share (%), by Country 2024 & 2032
- Figure 51: Asia Pacific Growlers Market Revenue (Million), by Material 2024 & 2032
- Figure 52: Asia Pacific Growlers Market Volume (K Tons), by Material 2024 & 2032
- Figure 53: Asia Pacific Growlers Market Revenue Share (%), by Material 2024 & 2032
- Figure 54: Asia Pacific Growlers Market Volume Share (%), by Material 2024 & 2032
- Figure 55: Asia Pacific Growlers Market Revenue (Million), by Size 2024 & 2032
- Figure 56: Asia Pacific Growlers Market Volume (K Tons), by Size 2024 & 2032
- Figure 57: Asia Pacific Growlers Market Revenue Share (%), by Size 2024 & 2032
- Figure 58: Asia Pacific Growlers Market Volume Share (%), by Size 2024 & 2032
- Figure 59: Asia Pacific Growlers Market Revenue (Million), by Closure type 2024 & 2032
- Figure 60: Asia Pacific Growlers Market Volume (K Tons), by Closure type 2024 & 2032
- Figure 61: Asia Pacific Growlers Market Revenue Share (%), by Closure type 2024 & 2032
- Figure 62: Asia Pacific Growlers Market Volume Share (%), by Closure type 2024 & 2032
- Figure 63: Asia Pacific Growlers Market Revenue (Million), by Application 2024 & 2032
- Figure 64: Asia Pacific Growlers Market Volume (K Tons), by Application 2024 & 2032
- Figure 65: Asia Pacific Growlers Market Revenue Share (%), by Application 2024 & 2032
- Figure 66: Asia Pacific Growlers Market Volume Share (%), by Application 2024 & 2032
- Figure 67: Asia Pacific Growlers Market Revenue (Million), by Distribution Channel 2024 & 2032
- Figure 68: Asia Pacific Growlers Market Volume (K Tons), by Distribution Channel 2024 & 2032
- Figure 69: Asia Pacific Growlers Market Revenue Share (%), by Distribution Channel 2024 & 2032
- Figure 70: Asia Pacific Growlers Market Volume Share (%), by Distribution Channel 2024 & 2032
- Figure 71: Asia Pacific Growlers Market Revenue (Million), by Country 2024 & 2032
- Figure 72: Asia Pacific Growlers Market Volume (K Tons), by Country 2024 & 2032
- Figure 73: Asia Pacific Growlers Market Revenue Share (%), by Country 2024 & 2032
- Figure 74: Asia Pacific Growlers Market Volume Share (%), by Country 2024 & 2032
- Figure 75: Latin America Growlers Market Revenue (Million), by Material 2024 & 2032
- Figure 76: Latin America Growlers Market Volume (K Tons), by Material 2024 & 2032
- Figure 77: Latin America Growlers Market Revenue Share (%), by Material 2024 & 2032
- Figure 78: Latin America Growlers Market Volume Share (%), by Material 2024 & 2032
- Figure 79: Latin America Growlers Market Revenue (Million), by Size 2024 & 2032
- Figure 80: Latin America Growlers Market Volume (K Tons), by Size 2024 & 2032
- Figure 81: Latin America Growlers Market Revenue Share (%), by Size 2024 & 2032
- Figure 82: Latin America Growlers Market Volume Share (%), by Size 2024 & 2032
- Figure 83: Latin America Growlers Market Revenue (Million), by Closure type 2024 & 2032
- Figure 84: Latin America Growlers Market Volume (K Tons), by Closure type 2024 & 2032
- Figure 85: Latin America Growlers Market Revenue Share (%), by Closure type 2024 & 2032
- Figure 86: Latin America Growlers Market Volume Share (%), by Closure type 2024 & 2032
- Figure 87: Latin America Growlers Market Revenue (Million), by Application 2024 & 2032
- Figure 88: Latin America Growlers Market Volume (K Tons), by Application 2024 & 2032
- Figure 89: Latin America Growlers Market Revenue Share (%), by Application 2024 & 2032
- Figure 90: Latin America Growlers Market Volume Share (%), by Application 2024 & 2032
- Figure 91: Latin America Growlers Market Revenue (Million), by Distribution Channel 2024 & 2032
- Figure 92: Latin America Growlers Market Volume (K Tons), by Distribution Channel 2024 & 2032
- Figure 93: Latin America Growlers Market Revenue Share (%), by Distribution Channel 2024 & 2032
- Figure 94: Latin America Growlers Market Volume Share (%), by Distribution Channel 2024 & 2032
- Figure 95: Latin America Growlers Market Revenue (Million), by Country 2024 & 2032
- Figure 96: Latin America Growlers Market Volume (K Tons), by Country 2024 & 2032
- Figure 97: Latin America Growlers Market Revenue Share (%), by Country 2024 & 2032
- Figure 98: Latin America Growlers Market Volume Share (%), by Country 2024 & 2032
- Figure 99: Middle East & Africa Growlers Market Revenue (Million), by Material 2024 & 2032
- Figure 100: Middle East & Africa Growlers Market Volume (K Tons), by Material 2024 & 2032
- Figure 101: Middle East & Africa Growlers Market Revenue Share (%), by Material 2024 & 2032
- Figure 102: Middle East & Africa Growlers Market Volume Share (%), by Material 2024 & 2032
- Figure 103: Middle East & Africa Growlers Market Revenue (Million), by Size 2024 & 2032
- Figure 104: Middle East & Africa Growlers Market Volume (K Tons), by Size 2024 & 2032
- Figure 105: Middle East & Africa Growlers Market Revenue Share (%), by Size 2024 & 2032
- Figure 106: Middle East & Africa Growlers Market Volume Share (%), by Size 2024 & 2032
- Figure 107: Middle East & Africa Growlers Market Revenue (Million), by Closure type 2024 & 2032
- Figure 108: Middle East & Africa Growlers Market Volume (K Tons), by Closure type 2024 & 2032
- Figure 109: Middle East & Africa Growlers Market Revenue Share (%), by Closure type 2024 & 2032
- Figure 110: Middle East & Africa Growlers Market Volume Share (%), by Closure type 2024 & 2032
- Figure 111: Middle East & Africa Growlers Market Revenue (Million), by Application 2024 & 2032
- Figure 112: Middle East & Africa Growlers Market Volume (K Tons), by Application 2024 & 2032
- Figure 113: Middle East & Africa Growlers Market Revenue Share (%), by Application 2024 & 2032
- Figure 114: Middle East & Africa Growlers Market Volume Share (%), by Application 2024 & 2032
- Figure 115: Middle East & Africa Growlers Market Revenue (Million), by Distribution Channel 2024 & 2032
- Figure 116: Middle East & Africa Growlers Market Volume (K Tons), by Distribution Channel 2024 & 2032
- Figure 117: Middle East & Africa Growlers Market Revenue Share (%), by Distribution Channel 2024 & 2032
- Figure 118: Middle East & Africa Growlers Market Volume Share (%), by Distribution Channel 2024 & 2032
- Figure 119: Middle East & Africa Growlers Market Revenue (Million), by Country 2024 & 2032
- Figure 120: Middle East & Africa Growlers Market Volume (K Tons), by Country 2024 & 2032
- Figure 121: Middle East & Africa Growlers Market Revenue Share (%), by Country 2024 & 2032
- Figure 122: Middle East & Africa Growlers Market Volume Share (%), by Country 2024 & 2032
- Table 1: Global Growlers Market Revenue Million Forecast, by Region 2019 & 2032
- Table 2: Global Growlers Market Volume K Tons Forecast, by Region 2019 & 2032
- Table 3: Global Growlers Market Revenue Million Forecast, by Material 2019 & 2032
- Table 4: Global Growlers Market Volume K Tons Forecast, by Material 2019 & 2032
- Table 5: Global Growlers Market Revenue Million Forecast, by Size 2019 & 2032
- Table 6: Global Growlers Market Volume K Tons Forecast, by Size 2019 & 2032
- Table 7: Global Growlers Market Revenue Million Forecast, by Closure type 2019 & 2032
- Table 8: Global Growlers Market Volume K Tons Forecast, by Closure type 2019 & 2032
- Table 9: Global Growlers Market Revenue Million Forecast, by Application 2019 & 2032
- Table 10: Global Growlers Market Volume K Tons Forecast, by Application 2019 & 2032
- Table 11: Global Growlers Market Revenue Million Forecast, by Distribution Channel 2019 & 2032
- Table 12: Global Growlers Market Volume K Tons Forecast, by Distribution Channel 2019 & 2032
- Table 13: Global Growlers Market Revenue Million Forecast, by Region 2019 & 2032
- Table 14: Global Growlers Market Volume K Tons Forecast, by Region 2019 & 2032
- Table 15: Global Growlers Market Revenue Million Forecast, by Material 2019 & 2032
- Table 16: Global Growlers Market Volume K Tons Forecast, by Material 2019 & 2032
- Table 17: Global Growlers Market Revenue Million Forecast, by Size 2019 & 2032
- Table 18: Global Growlers Market Volume K Tons Forecast, by Size 2019 & 2032
- Table 19: Global Growlers Market Revenue Million Forecast, by Closure type 2019 & 2032
- Table 20: Global Growlers Market Volume K Tons Forecast, by Closure type 2019 & 2032
- Table 21: Global Growlers Market Revenue Million Forecast, by Application 2019 & 2032
- Table 22: Global Growlers Market Volume K Tons Forecast, by Application 2019 & 2032
- Table 23: Global Growlers Market Revenue Million Forecast, by Distribution Channel 2019 & 2032
- Table 24: Global Growlers Market Volume K Tons Forecast, by Distribution Channel 2019 & 2032
- Table 25: Global Growlers Market Revenue Million Forecast, by Country 2019 & 2032
- Table 26: Global Growlers Market Volume K Tons Forecast, by Country 2019 & 2032
- Table 27: U.S. Growlers Market Revenue (Million) Forecast, by Application 2019 & 2032
- Table 28: U.S. Growlers Market Volume (K Tons) Forecast, by Application 2019 & 2032
- Table 29: Canada Growlers Market Revenue (Million) Forecast, by Application 2019 & 2032
- Table 30: Canada Growlers Market Volume (K Tons) Forecast, by Application 2019 & 2032
- Table 31: Global Growlers Market Revenue Million Forecast, by Material 2019 & 2032
- Table 32: Global Growlers Market Volume K Tons Forecast, by Material 2019 & 2032
- Table 33: Global Growlers Market Revenue Million Forecast, by Size 2019 & 2032
- Table 34: Global Growlers Market Volume K Tons Forecast, by Size 2019 & 2032
- Table 35: Global Growlers Market Revenue Million Forecast, by Closure type 2019 & 2032
- Table 36: Global Growlers Market Volume K Tons Forecast, by Closure type 2019 & 2032
- Table 37: Global Growlers Market Revenue Million Forecast, by Application 2019 & 2032
- Table 38: Global Growlers Market Volume K Tons Forecast, by Application 2019 & 2032
- Table 39: Global Growlers Market Revenue Million Forecast, by Distribution Channel 2019 & 2032
- Table 40: Global Growlers Market Volume K Tons Forecast, by Distribution Channel 2019 & 2032
- Table 41: Global Growlers Market Revenue Million Forecast, by Country 2019 & 2032
- Table 42: Global Growlers Market Volume K Tons Forecast, by Country 2019 & 2032
- Table 43: Germany Growlers Market Revenue (Million) Forecast, by Application 2019 & 2032
- Table 44: Germany Growlers Market Volume (K Tons) Forecast, by Application 2019 & 2032
- Table 45: UK Growlers Market Revenue (Million) Forecast, by Application 2019 & 2032
- Table 46: UK Growlers Market Volume (K Tons) Forecast, by Application 2019 & 2032
- Table 47: France Growlers Market Revenue (Million) Forecast, by Application 2019 & 2032
- Table 48: France Growlers Market Volume (K Tons) Forecast, by Application 2019 & 2032
- Table 49: Spain Growlers Market Revenue (Million) Forecast, by Application 2019 & 2032
- Table 50: Spain Growlers Market Volume (K Tons) Forecast, by Application 2019 & 2032
- Table 51: Italy Growlers Market Revenue (Million) Forecast, by Application 2019 & 2032
- Table 52: Italy Growlers Market Volume (K Tons) Forecast, by Application 2019 & 2032
- Table 53: Global Growlers Market Revenue Million Forecast, by Material 2019 & 2032
- Table 54: Global Growlers Market Volume K Tons Forecast, by Material 2019 & 2032
- Table 55: Global Growlers Market Revenue Million Forecast, by Size 2019 & 2032
- Table 56: Global Growlers Market Volume K Tons Forecast, by Size 2019 & 2032
- Table 57: Global Growlers Market Revenue Million Forecast, by Closure type 2019 & 2032
- Table 58: Global Growlers Market Volume K Tons Forecast, by Closure type 2019 & 2032
- Table 59: Global Growlers Market Revenue Million Forecast, by Application 2019 & 2032
- Table 60: Global Growlers Market Volume K Tons Forecast, by Application 2019 & 2032
- Table 61: Global Growlers Market Revenue Million Forecast, by Distribution Channel 2019 & 2032
- Table 62: Global Growlers Market Volume K Tons Forecast, by Distribution Channel 2019 & 2032
- Table 63: Global Growlers Market Revenue Million Forecast, by Country 2019 & 2032
- Table 64: Global Growlers Market Volume K Tons Forecast, by Country 2019 & 2032
- Table 65: China Growlers Market Revenue (Million) Forecast, by Application 2019 & 2032
- Table 66: China Growlers Market Volume (K Tons) Forecast, by Application 2019 & 2032
- Table 67: Japan Growlers Market Revenue (Million) Forecast, by Application 2019 & 2032
- Table 68: Japan Growlers Market Volume (K Tons) Forecast, by Application 2019 & 2032
- Table 69: India Growlers Market Revenue (Million) Forecast, by Application 2019 & 2032
- Table 70: India Growlers Market Volume (K Tons) Forecast, by Application 2019 & 2032
- Table 71: Australia Growlers Market Revenue (Million) Forecast, by Application 2019 & 2032
- Table 72: Australia Growlers Market Volume (K Tons) Forecast, by Application 2019 & 2032
- Table 73: South Korea Growlers Market Revenue (Million) Forecast, by Application 2019 & 2032
- Table 74: South Korea Growlers Market Volume (K Tons) Forecast, by Application 2019 & 2032
- Table 75: Indonesia Growlers Market Revenue (Million) Forecast, by Application 2019 & 2032
- Table 76: Indonesia Growlers Market Volume (K Tons) Forecast, by Application 2019 & 2032
- Table 77: Malaysia Growlers Market Revenue (Million) Forecast, by Application 2019 & 2032
- Table 78: Malaysia Growlers Market Volume (K Tons) Forecast, by Application 2019 & 2032
- Table 79: Global Growlers Market Revenue Million Forecast, by Material 2019 & 2032
- Table 80: Global Growlers Market Volume K Tons Forecast, by Material 2019 & 2032
- Table 81: Global Growlers Market Revenue Million Forecast, by Size 2019 & 2032
- Table 82: Global Growlers Market Volume K Tons Forecast, by Size 2019 & 2032
- Table 83: Global Growlers Market Revenue Million Forecast, by Closure type 2019 & 2032
- Table 84: Global Growlers Market Volume K Tons Forecast, by Closure type 2019 & 2032
- Table 85: Global Growlers Market Revenue Million Forecast, by Application 2019 & 2032
- Table 86: Global Growlers Market Volume K Tons Forecast, by Application 2019 & 2032
- Table 87: Global Growlers Market Revenue Million Forecast, by Distribution Channel 2019 & 2032
- Table 88: Global Growlers Market Volume K Tons Forecast, by Distribution Channel 2019 & 2032
- Table 89: Global Growlers Market Revenue Million Forecast, by Country 2019 & 2032
- Table 90: Global Growlers Market Volume K Tons Forecast, by Country 2019 & 2032
- Table 91: Brazil Growlers Market Revenue (Million) Forecast, by Application 2019 & 2032
- Table 92: Brazil Growlers Market Volume (K Tons) Forecast, by Application 2019 & 2032
- Table 93: Mexico Growlers Market Revenue (Million) Forecast, by Application 2019 & 2032
- Table 94: Mexico Growlers Market Volume (K Tons) Forecast, by Application 2019 & 2032
- Table 95: Argentina Growlers Market Revenue (Million) Forecast, by Application 2019 & 2032
- Table 96: Argentina Growlers Market Volume (K Tons) Forecast, by Application 2019 & 2032
- Table 97: Global Growlers Market Revenue Million Forecast, by Material 2019 & 2032
- Table 98: Global Growlers Market Volume K Tons Forecast, by Material 2019 & 2032
- Table 99: Global Growlers Market Revenue Million Forecast, by Size 2019 & 2032
- Table 100: Global Growlers Market Volume K Tons Forecast, by Size 2019 & 2032
- Table 101: Global Growlers Market Revenue Million Forecast, by Closure type 2019 & 2032
- Table 102: Global Growlers Market Volume K Tons Forecast, by Closure type 2019 & 2032
- Table 103: Global Growlers Market Revenue Million Forecast, by Application 2019 & 2032
- Table 104: Global Growlers Market Volume K Tons Forecast, by Application 2019 & 2032
- Table 105: Global Growlers Market Revenue Million Forecast, by Distribution Channel 2019 & 2032
- Table 106: Global Growlers Market Volume K Tons Forecast, by Distribution Channel 2019 & 2032
- Table 107: Global Growlers Market Revenue Million Forecast, by Country 2019 & 2032
- Table 108: Global Growlers Market Volume K Tons Forecast, by Country 2019 & 2032
- Table 109: South Africa Growlers Market Revenue (Million) Forecast, by Application 2019 & 2032
- Table 110: South Africa Growlers Market Volume (K Tons) Forecast, by Application 2019 & 2032
- Table 111: Saudi Arabia Growlers Market Revenue (Million) Forecast, by Application 2019 & 2032
- Table 112: Saudi Arabia Growlers Market Volume (K Tons) Forecast, by Application 2019 & 2032
- Table 113: UAE Growlers Market Revenue (Million) Forecast, by Application 2019 & 2032
- Table 114: UAE Growlers Market Volume (K Tons) Forecast, by Application 2019 & 2032
- Table 115: Egypt Growlers Market Revenue (Million) Forecast, by Application 2019 & 2032
- Table 116: Egypt Growlers Market Volume (K Tons) Forecast, by Application 2019 & 2032
STEP 1 - Identification of Relevant Samples Size from Population Database


STEP 2 - Approaches for Defining Global Market Size (Value, Volume* & Price*)

Note* : In applicable scenarios
STEP 3 - Data Sources
Primary Research
- Web Analytics
- Survey Reports
- Research Institute
- Latest Research Reports
- Opinion Leaders
Secondary Research
- Annual Reports
- White Paper
- Latest Press Release
- Industry Association
- Paid Database
- Investor Presentations

STEP 4 - Data Triangulation
Involves using different sources of information in order to increase the validity of a study
These sources are likely to be stakeholders in a program - participants, other researchers, program staff, other community members, and so on.
Then we put all data in single framework & apply various statistical tools to find out the dynamic on the market.
During the analysis stage, feedback from the stakeholder groups would be compared to determine areas of agreement as well as areas of divergence
Frequently Asked Questions
Related Reports
See the similar reports


About Market Insights Report
Market Insights Reports offers comprehensive market research reports and analysis, giving businesses important information about their clients, rivals, and sector to help them make well-informed decisions on operations, marketing, and business strategy. We offer a variety of services in addition to market research, data analysis, and strategy planning. In order to find opportunities and learn more about our competitors and the industry at large, we employ competitive analysis. To identify areas for development, we also evaluate our performance against that of our rivals. We can determine the places at which we can offer our clients the most value by performing value chain analysis.
Additionally, clients receive a thorough overview of their industry business environment. We can find trends that help us forecast future possibilities and threats by examining global macroeconomic dynamics and consumer behavior patterns. By analyzing their features and advantages, contrasting them with comparable items on the market, and evaluating both their quantitative and qualitative performance, we comprehensively evaluate our clients' products. This allows us to assist customers in determining how their goods compare to those of their rivals and in creating successful marketing plans. Our group has been successful in gaining a thorough grasp of our clients' requirements and offering them creative solutions. We currently provide services to more than 50 nations in Europe, the Middle East, Africa, Latin America, Asia Pacific, and North America. Because of our global reach, we have been able to establish trusting bonds with our partners and clients in various nations, improving customer service and forging a more cohesive worldwide presence.