
.jpg&w=3840&q=100)
Market
Insights
Reports delivered globally, covering a wide range of industries and sectors.
Clients who trust our expertise and rely on our insights for business decisions.
Managed Reports, ensuring seamless updates and premium service.
Satisfied Customers, committed to delivering exceptional value and quality.
Microprocessor Market Navigating Dynamics Comprehensive Analysis and Forecasts 2025-2033
Microprocessor Market by Architecture (Complex Instruction Set Computer (CISC), Reduced Instruction Set Computer (RISC), Application Specific Integrated Circuit (ASIC), Superscalar, Digital Signal Processor (DSP)), by Application (Automotive & transportation, Consumer electronics & home appliances, Industrial, Medical & healthcare, Aerospace & defense, IT & telecom, Others), by North America (U.S., Canada), by Europe (Germany, UK, France, Italy, Spain, Rest of Europe), by Asia Pacific (China, India, Japan, South Korea, ANZ, Rest of Asia Pacific), by Latin America (Brazil, Mexico, Rest of Latin America), by MEA (UAE, Saudi Arabia, South Africa, Rest of MEA) Forecast 2025-2033
Microprocessor Market Navigating Dynamics Comprehensive Analysis and Forecasts 2025-2033
Key Insights
The size of the Microprocessor Market was valued at USD 77 Billion in 2024 and is projected to reach USD 123.65 Billion by 2033, with an expected CAGR of 7% during the forecast period. The Microprocessor Market focuses on the design and production of integrated circuits that act as the central processing unit (CPU) in computers, smartphones, and various electronic gadgets. Microprocessors are crucial for executing commands, carrying out calculations, and facilitating the functioning of intricate systems in various applications, ranging from consumer gadgets to industrial equipment. The market is propelled by the rising need for more powerful, energy-efficient, and compact processors to facilitate applications in artificial intelligence (AI), 5G connectivity, IoT, and autonomous systems. Improvements in semiconductor technology, including reduced process nodes, multi-core CPUs, and enhancements in chip design, are enhancing performance and facilitating more advanced applications. Major market players like Intel, AMD, and ARM are constantly advancing next-generation processors to satisfy the demands of sectors such as automotive, telecommunications, healthcare, and gaming. With the increasing demand for quicker, smarter, and more interconnected devices, significant growth in the Microprocessor Market is anticipated, fueling the continuous digital transformation in multiple industries.

Microprocessor Market Concentration & Characteristics
The market is characterized by a high level of innovation, with leading players investing heavily in research and development. Regulations play a crucial role in shaping the market, influencing product design, safety standards, and environmental impact. End-user concentration is fragmented across different industries, each with its specific requirements. M&A activity is moderate, as established players seek to strengthen their market position.
Microprocessor Market Trends
Key market trends include:
- Increasing Demand for High-Performance Computing: The proliferation of AI, machine learning, and cloud computing is driving the demand for microprocessors with higher performance and efficiency.
- Adoption of Advanced Architectures: The transition towards RISC and superscalar architectures enables faster execution and improved power consumption, catering to the performance demands of modern applications.
- Growth of Edge Computing: The need for real-time data processing and analysis at the edge is fostering the adoption of microprocessors optimized for low-latency and low-power operation.

Key Region or Country & Segment to Dominate the Market
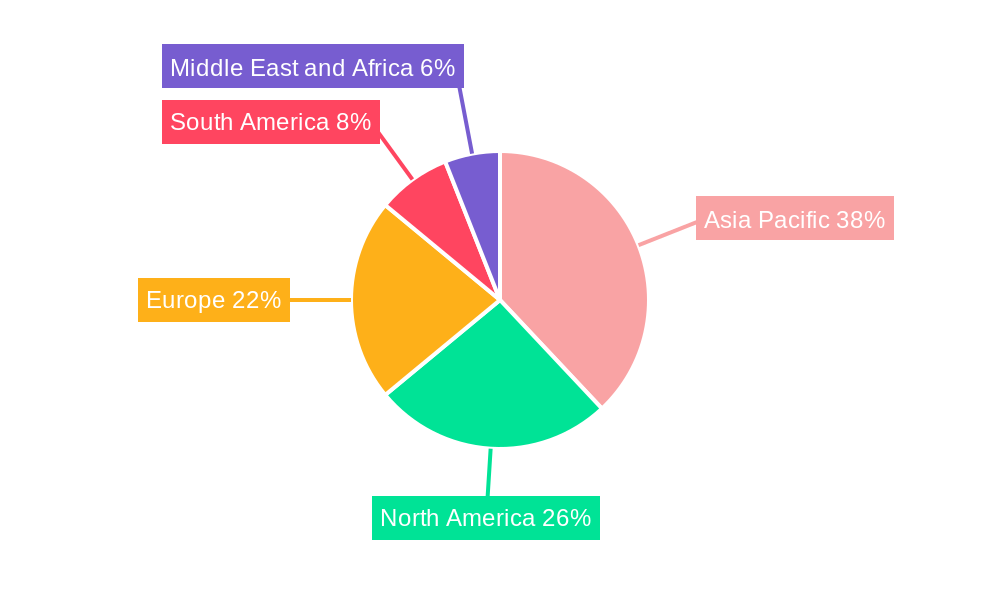
Regions Dominating the Market:
- North America: Advanced technology adoption and a strong semiconductor industry contribute to its leadership in the market.
- Asia Pacific: Rapidly growing electronics and automotive industries drive market growth in this region, particularly in China and India.
Segments Dominating the Market:
- Application: Automotive & Transportation: The increasing reliance on in-vehicle electronics and autonomous driving systems boosts the demand for automotive-grade microprocessors.
- Architecture: RISC: The adoption of RISC-based microprocessors for mobile and edge computing applications fuels market growth.
Microprocessor Market Product Insights Report Coverage & Deliverables
The report provides comprehensive coverage of the microprocessor market, including:
- Market size and growth projections
- Analysis of market trends and drivers
- Segmentation by architecture, application, and region
- Competitive landscape and company profiles
- Future outlook and industry insights
Microprocessor Market Analysis
Market Size and Share: The global microprocessor market reached a size of USD 77 billion in 2023. Intel Corporation leads the market with a significant share, followed by Samsung Electronics Co., Ltd. and Broadcom Inc.
Growth: The market is anticipated to grow at a CAGR of 7% over the forecast period. The adoption of advanced technologies, increasing demand for high-performance computing, and expanding edge computing market will drive this growth.
Microprocessor Market Regional Insights
North America:
- U.S.: Key industry hub with leading technology companies and semiconductor manufacturers.
- Canada: Growing automotive and aerospace industries contribute to the demand for microprocessors.
Asia Pacific:
- China: Rapid industrialization and technology adoption fuel market growth.
- India: Expanding electronics and semiconductor industries drive microprocessor demand.
- Japan: Advanced technology adoption and a strong automotive industry contribute to the market size.
Driving Forces: What's Propelling the Microprocessor Market
- Increasing demand for advanced computing and data processing
- Proliferation of cloud computing, AI, and machine learning applications
- Growing adoption of mobile devices and IoT devices
- Government initiatives promoting technology adoption
- Rising demand for energy-efficient and high-performance microprocessors
Challenges and Restraints in Microprocessor Market
- Intense competition from established players
- Fluctuations in raw material prices
- Intellectual property concerns and patent disputes
- Supply chain disruptions and geopolitical tensions
- Lack of skilled workforce and人才库问题
Emerging Trends in Microprocessor Market
- Development of 3D packaging technologies for enhanced performance and power efficiency
- Adoption of advanced materials, such as graphene and silicene, for improved conductivity
- Integration of heterogeneous computing architectures
- Increasing focus on sustainability and energy-efficient designs
Microprocessor Industry News
January 2023: Intel introduces its 13th Gen high-performance laptop processors, featuring up to 24 cores for demanding applications.
June 2023: Intel announces plans to rebrand its chips starting with the Meteor Lake CPUs, updating the familiar "i" series.
Leading Players in the Microprocessor Market
- Intel Corporation
- Samsung Electronics Co., Ltd.
- Broadcom Inc.
- Qualcomm Technologies, Inc.
- Advanced Micro Devices, Inc.
- NVIDIA Corporation
- Arm Limited
Microprocessor Market Segmentation
- 1. Architecture
- 1.1. Complex Instruction Set Computer (CISC)
- 1.2. Reduced Instruction Set Computer (RISC)
- 1.3. Application Specific Integrated Circuit (ASIC)
- 1.4. Superscalar
- 1.5. Digital Signal Processor (DSP)
- 2. Application
- 2.1. Automotive & transportation
- 2.2. Consumer electronics & home appliances
- 2.3. Industrial
- 2.4. Medical & healthcare
- 2.5. Aerospace & defense
- 2.6. IT & telecom
- 2.7. Others
Microprocessor Market Segmentation By Geography
- 1. North America
- 1.1. U.S.
- 1.2. Canada
- 2. Europe
- 2.1. Germany
- 2.2. UK
- 2.3. France
- 2.4. Italy
- 2.5. Spain
- 2.6. Rest of Europe
- 3. Asia Pacific
- 3.1. China
- 3.2. India
- 3.3. Japan
- 3.4. South Korea
- 3.5. ANZ
- 3.6. Rest of Asia Pacific
- 4. Latin America
- 4.1. Brazil
- 4.2. Mexico
- 4.3. Rest of Latin America
- 5. MEA
- 5.1. UAE
- 5.2. Saudi Arabia
- 5.3. South Africa
- 5.4. Rest of MEA
Microprocessor Market REPORT HIGHLIGHTS
| Aspects | Details |
|---|---|
| Study Period | 2019-2033 |
| Base Year | 2024 |
| Estimated Year | 2025 |
| Forecast Period | 2025-2033 |
| Historical Period | 2019-2024 |
| Growth Rate | CAGR of 7% from 2019-2033 |
| Segmentation |
|
- 1. Introduction
- 1.1. Research Scope
- 1.2. Market Segmentation
- 1.3. Research Methodology
- 1.4. Definitions and Assumptions
- 2. Executive Summary
- 2.1. Introduction
- 3. Market Dynamics
- 3.1. Introduction
- 3.2. Market Drivers
- 3.2.1 Technological advancements in semiconductor manufacturing
- 3.2.2 Increasing demand for consumer electronics
- 3.2.3 Expansion of the internet of things (IoT)
- 3.2.4 Growing adoption of artificial intelligence and machine learning
- 3.2.5 Rise of autonomous vehicles and advanced driver assistance systems (ADAS)
- 3.3. Market Restrains
- 3.3.1 High R&D costs and capital expenditure
- 3.3.2 Intense competition and price pressure
- 3.4. Market Trends
- 4. Market Factor Analysis
- 4.1. Porters Five Forces
- 4.2. Supply/Value Chain
- 4.3. PESTEL analysis
- 4.4. Market Entropy
- 4.5. Patent/Trademark Analysis
- 5. Global Microprocessor Market Analysis, Insights and Forecast, 2019-2031
- 5.1. Market Analysis, Insights and Forecast - by Architecture
- 5.1.1. Complex Instruction Set Computer (CISC)
- 5.1.2. Reduced Instruction Set Computer (RISC)
- 5.1.3. Application Specific Integrated Circuit (ASIC)
- 5.1.4. Superscalar
- 5.1.5. Digital Signal Processor (DSP)
- 5.2. Market Analysis, Insights and Forecast - by Application
- 5.2.1. Automotive & transportation
- 5.2.2. Consumer electronics & home appliances
- 5.2.3. Industrial
- 5.2.4. Medical & healthcare
- 5.2.5. Aerospace & defense
- 5.2.6. IT & telecom
- 5.2.7. Others
- 5.3. Market Analysis, Insights and Forecast - by Region
- 5.3.1. North America
- 5.3.2. Europe
- 5.3.3. Asia Pacific
- 5.3.4. Latin America
- 5.3.5. MEA
- 5.1. Market Analysis, Insights and Forecast - by Architecture
- 6. North America Microprocessor Market Analysis, Insights and Forecast, 2019-2031
- 6.1. Market Analysis, Insights and Forecast - by Architecture
- 6.1.1. Complex Instruction Set Computer (CISC)
- 6.1.2. Reduced Instruction Set Computer (RISC)
- 6.1.3. Application Specific Integrated Circuit (ASIC)
- 6.1.4. Superscalar
- 6.1.5. Digital Signal Processor (DSP)
- 6.2. Market Analysis, Insights and Forecast - by Application
- 6.2.1. Automotive & transportation
- 6.2.2. Consumer electronics & home appliances
- 6.2.3. Industrial
- 6.2.4. Medical & healthcare
- 6.2.5. Aerospace & defense
- 6.2.6. IT & telecom
- 6.2.7. Others
- 6.1. Market Analysis, Insights and Forecast - by Architecture
- 7. Europe Microprocessor Market Analysis, Insights and Forecast, 2019-2031
- 7.1. Market Analysis, Insights and Forecast - by Architecture
- 7.1.1. Complex Instruction Set Computer (CISC)
- 7.1.2. Reduced Instruction Set Computer (RISC)
- 7.1.3. Application Specific Integrated Circuit (ASIC)
- 7.1.4. Superscalar
- 7.1.5. Digital Signal Processor (DSP)
- 7.2. Market Analysis, Insights and Forecast - by Application
- 7.2.1. Automotive & transportation
- 7.2.2. Consumer electronics & home appliances
- 7.2.3. Industrial
- 7.2.4. Medical & healthcare
- 7.2.5. Aerospace & defense
- 7.2.6. IT & telecom
- 7.2.7. Others
- 7.1. Market Analysis, Insights and Forecast - by Architecture
- 8. Asia Pacific Microprocessor Market Analysis, Insights and Forecast, 2019-2031
- 8.1. Market Analysis, Insights and Forecast - by Architecture
- 8.1.1. Complex Instruction Set Computer (CISC)
- 8.1.2. Reduced Instruction Set Computer (RISC)
- 8.1.3. Application Specific Integrated Circuit (ASIC)
- 8.1.4. Superscalar
- 8.1.5. Digital Signal Processor (DSP)
- 8.2. Market Analysis, Insights and Forecast - by Application
- 8.2.1. Automotive & transportation
- 8.2.2. Consumer electronics & home appliances
- 8.2.3. Industrial
- 8.2.4. Medical & healthcare
- 8.2.5. Aerospace & defense
- 8.2.6. IT & telecom
- 8.2.7. Others
- 8.1. Market Analysis, Insights and Forecast - by Architecture
- 9. Latin America Microprocessor Market Analysis, Insights and Forecast, 2019-2031
- 9.1. Market Analysis, Insights and Forecast - by Architecture
- 9.1.1. Complex Instruction Set Computer (CISC)
- 9.1.2. Reduced Instruction Set Computer (RISC)
- 9.1.3. Application Specific Integrated Circuit (ASIC)
- 9.1.4. Superscalar
- 9.1.5. Digital Signal Processor (DSP)
- 9.2. Market Analysis, Insights and Forecast - by Application
- 9.2.1. Automotive & transportation
- 9.2.2. Consumer electronics & home appliances
- 9.2.3. Industrial
- 9.2.4. Medical & healthcare
- 9.2.5. Aerospace & defense
- 9.2.6. IT & telecom
- 9.2.7. Others
- 9.1. Market Analysis, Insights and Forecast - by Architecture
- 10. MEA Microprocessor Market Analysis, Insights and Forecast, 2019-2031
- 10.1. Market Analysis, Insights and Forecast - by Architecture
- 10.1.1. Complex Instruction Set Computer (CISC)
- 10.1.2. Reduced Instruction Set Computer (RISC)
- 10.1.3. Application Specific Integrated Circuit (ASIC)
- 10.1.4. Superscalar
- 10.1.5. Digital Signal Processor (DSP)
- 10.2. Market Analysis, Insights and Forecast - by Application
- 10.2.1. Automotive & transportation
- 10.2.2. Consumer electronics & home appliances
- 10.2.3. Industrial
- 10.2.4. Medical & healthcare
- 10.2.5. Aerospace & defense
- 10.2.6. IT & telecom
- 10.2.7. Others
- 10.1. Market Analysis, Insights and Forecast - by Architecture
- 11. Competitive Analysis
- 11.1. Global Market Share Analysis 2024
- 11.2. Company Profiles
- 11.2.1 Intel Corporation
- 11.2.1.1. Overview
- 11.2.1.2. Products
- 11.2.1.3. SWOT Analysis
- 11.2.1.4. Recent Developments
- 11.2.1.5. Financials (Based on Availability)
- 11.2.2 Samsung Electronics Co. Ltd.
- 11.2.2.1. Overview
- 11.2.2.2. Products
- 11.2.2.3. SWOT Analysis
- 11.2.2.4. Recent Developments
- 11.2.2.5. Financials (Based on Availability)
- 11.2.3 Broadcom Inc.
- 11.2.3.1. Overview
- 11.2.3.2. Products
- 11.2.3.3. SWOT Analysis
- 11.2.3.4. Recent Developments
- 11.2.3.5. Financials (Based on Availability)
- 11.2.4 Qualcomm Technologies Inc.
- 11.2.4.1. Overview
- 11.2.4.2. Products
- 11.2.4.3. SWOT Analysis
- 11.2.4.4. Recent Developments
- 11.2.4.5. Financials (Based on Availability)
- 11.2.5 Advanced Micro Devices Inc.
- 11.2.5.1. Overview
- 11.2.5.2. Products
- 11.2.5.3. SWOT Analysis
- 11.2.5.4. Recent Developments
- 11.2.5.5. Financials (Based on Availability)
- 11.2.6 NVIDIA Corporation
- 11.2.6.1. Overview
- 11.2.6.2. Products
- 11.2.6.3. SWOT Analysis
- 11.2.6.4. Recent Developments
- 11.2.6.5. Financials (Based on Availability)
- 11.2.7 Arm Limited
- 11.2.7.1. Overview
- 11.2.7.2. Products
- 11.2.7.3. SWOT Analysis
- 11.2.7.4. Recent Developments
- 11.2.7.5. Financials (Based on Availability)
- 11.2.1 Intel Corporation
- Figure 1: Global Microprocessor Market Revenue Breakdown (Billion, %) by Region 2024 & 2032
- Figure 2: Global Microprocessor Market Volume Breakdown (K Tons, %) by Region 2024 & 2032
- Figure 3: North America Microprocessor Market Revenue (Billion), by Architecture 2024 & 2032
- Figure 4: North America Microprocessor Market Volume (K Tons), by Architecture 2024 & 2032
- Figure 5: North America Microprocessor Market Revenue Share (%), by Architecture 2024 & 2032
- Figure 6: North America Microprocessor Market Volume Share (%), by Architecture 2024 & 2032
- Figure 7: North America Microprocessor Market Revenue (Billion), by Application 2024 & 2032
- Figure 8: North America Microprocessor Market Volume (K Tons), by Application 2024 & 2032
- Figure 9: North America Microprocessor Market Revenue Share (%), by Application 2024 & 2032
- Figure 10: North America Microprocessor Market Volume Share (%), by Application 2024 & 2032
- Figure 11: North America Microprocessor Market Revenue (Billion), by Country 2024 & 2032
- Figure 12: North America Microprocessor Market Volume (K Tons), by Country 2024 & 2032
- Figure 13: North America Microprocessor Market Revenue Share (%), by Country 2024 & 2032
- Figure 14: North America Microprocessor Market Volume Share (%), by Country 2024 & 2032
- Figure 15: Europe Microprocessor Market Revenue (Billion), by Architecture 2024 & 2032
- Figure 16: Europe Microprocessor Market Volume (K Tons), by Architecture 2024 & 2032
- Figure 17: Europe Microprocessor Market Revenue Share (%), by Architecture 2024 & 2032
- Figure 18: Europe Microprocessor Market Volume Share (%), by Architecture 2024 & 2032
- Figure 19: Europe Microprocessor Market Revenue (Billion), by Application 2024 & 2032
- Figure 20: Europe Microprocessor Market Volume (K Tons), by Application 2024 & 2032
- Figure 21: Europe Microprocessor Market Revenue Share (%), by Application 2024 & 2032
- Figure 22: Europe Microprocessor Market Volume Share (%), by Application 2024 & 2032
- Figure 23: Europe Microprocessor Market Revenue (Billion), by Country 2024 & 2032
- Figure 24: Europe Microprocessor Market Volume (K Tons), by Country 2024 & 2032
- Figure 25: Europe Microprocessor Market Revenue Share (%), by Country 2024 & 2032
- Figure 26: Europe Microprocessor Market Volume Share (%), by Country 2024 & 2032
- Figure 27: Asia Pacific Microprocessor Market Revenue (Billion), by Architecture 2024 & 2032
- Figure 28: Asia Pacific Microprocessor Market Volume (K Tons), by Architecture 2024 & 2032
- Figure 29: Asia Pacific Microprocessor Market Revenue Share (%), by Architecture 2024 & 2032
- Figure 30: Asia Pacific Microprocessor Market Volume Share (%), by Architecture 2024 & 2032
- Figure 31: Asia Pacific Microprocessor Market Revenue (Billion), by Application 2024 & 2032
- Figure 32: Asia Pacific Microprocessor Market Volume (K Tons), by Application 2024 & 2032
- Figure 33: Asia Pacific Microprocessor Market Revenue Share (%), by Application 2024 & 2032
- Figure 34: Asia Pacific Microprocessor Market Volume Share (%), by Application 2024 & 2032
- Figure 35: Asia Pacific Microprocessor Market Revenue (Billion), by Country 2024 & 2032
- Figure 36: Asia Pacific Microprocessor Market Volume (K Tons), by Country 2024 & 2032
- Figure 37: Asia Pacific Microprocessor Market Revenue Share (%), by Country 2024 & 2032
- Figure 38: Asia Pacific Microprocessor Market Volume Share (%), by Country 2024 & 2032
- Figure 39: Latin America Microprocessor Market Revenue (Billion), by Architecture 2024 & 2032
- Figure 40: Latin America Microprocessor Market Volume (K Tons), by Architecture 2024 & 2032
- Figure 41: Latin America Microprocessor Market Revenue Share (%), by Architecture 2024 & 2032
- Figure 42: Latin America Microprocessor Market Volume Share (%), by Architecture 2024 & 2032
- Figure 43: Latin America Microprocessor Market Revenue (Billion), by Application 2024 & 2032
- Figure 44: Latin America Microprocessor Market Volume (K Tons), by Application 2024 & 2032
- Figure 45: Latin America Microprocessor Market Revenue Share (%), by Application 2024 & 2032
- Figure 46: Latin America Microprocessor Market Volume Share (%), by Application 2024 & 2032
- Figure 47: Latin America Microprocessor Market Revenue (Billion), by Country 2024 & 2032
- Figure 48: Latin America Microprocessor Market Volume (K Tons), by Country 2024 & 2032
- Figure 49: Latin America Microprocessor Market Revenue Share (%), by Country 2024 & 2032
- Figure 50: Latin America Microprocessor Market Volume Share (%), by Country 2024 & 2032
- Figure 51: MEA Microprocessor Market Revenue (Billion), by Architecture 2024 & 2032
- Figure 52: MEA Microprocessor Market Volume (K Tons), by Architecture 2024 & 2032
- Figure 53: MEA Microprocessor Market Revenue Share (%), by Architecture 2024 & 2032
- Figure 54: MEA Microprocessor Market Volume Share (%), by Architecture 2024 & 2032
- Figure 55: MEA Microprocessor Market Revenue (Billion), by Application 2024 & 2032
- Figure 56: MEA Microprocessor Market Volume (K Tons), by Application 2024 & 2032
- Figure 57: MEA Microprocessor Market Revenue Share (%), by Application 2024 & 2032
- Figure 58: MEA Microprocessor Market Volume Share (%), by Application 2024 & 2032
- Figure 59: MEA Microprocessor Market Revenue (Billion), by Country 2024 & 2032
- Figure 60: MEA Microprocessor Market Volume (K Tons), by Country 2024 & 2032
- Figure 61: MEA Microprocessor Market Revenue Share (%), by Country 2024 & 2032
- Figure 62: MEA Microprocessor Market Volume Share (%), by Country 2024 & 2032
- Table 1: Global Microprocessor Market Revenue Billion Forecast, by Region 2019 & 2032
- Table 2: Global Microprocessor Market Volume K Tons Forecast, by Region 2019 & 2032
- Table 3: Global Microprocessor Market Revenue Billion Forecast, by Architecture 2019 & 2032
- Table 4: Global Microprocessor Market Volume K Tons Forecast, by Architecture 2019 & 2032
- Table 5: Global Microprocessor Market Revenue Billion Forecast, by Application 2019 & 2032
- Table 6: Global Microprocessor Market Volume K Tons Forecast, by Application 2019 & 2032
- Table 7: Global Microprocessor Market Revenue Billion Forecast, by Region 2019 & 2032
- Table 8: Global Microprocessor Market Volume K Tons Forecast, by Region 2019 & 2032
- Table 9: Global Microprocessor Market Revenue Billion Forecast, by Architecture 2019 & 2032
- Table 10: Global Microprocessor Market Volume K Tons Forecast, by Architecture 2019 & 2032
- Table 11: Global Microprocessor Market Revenue Billion Forecast, by Application 2019 & 2032
- Table 12: Global Microprocessor Market Volume K Tons Forecast, by Application 2019 & 2032
- Table 13: Global Microprocessor Market Revenue Billion Forecast, by Country 2019 & 2032
- Table 14: Global Microprocessor Market Volume K Tons Forecast, by Country 2019 & 2032
- Table 15: U.S. Microprocessor Market Revenue (Billion) Forecast, by Application 2019 & 2032
- Table 16: U.S. Microprocessor Market Volume (K Tons) Forecast, by Application 2019 & 2032
- Table 17: Canada Microprocessor Market Revenue (Billion) Forecast, by Application 2019 & 2032
- Table 18: Canada Microprocessor Market Volume (K Tons) Forecast, by Application 2019 & 2032
- Table 19: Global Microprocessor Market Revenue Billion Forecast, by Architecture 2019 & 2032
- Table 20: Global Microprocessor Market Volume K Tons Forecast, by Architecture 2019 & 2032
- Table 21: Global Microprocessor Market Revenue Billion Forecast, by Application 2019 & 2032
- Table 22: Global Microprocessor Market Volume K Tons Forecast, by Application 2019 & 2032
- Table 23: Global Microprocessor Market Revenue Billion Forecast, by Country 2019 & 2032
- Table 24: Global Microprocessor Market Volume K Tons Forecast, by Country 2019 & 2032
- Table 25: Germany Microprocessor Market Revenue (Billion) Forecast, by Application 2019 & 2032
- Table 26: Germany Microprocessor Market Volume (K Tons) Forecast, by Application 2019 & 2032
- Table 27: UK Microprocessor Market Revenue (Billion) Forecast, by Application 2019 & 2032
- Table 28: UK Microprocessor Market Volume (K Tons) Forecast, by Application 2019 & 2032
- Table 29: France Microprocessor Market Revenue (Billion) Forecast, by Application 2019 & 2032
- Table 30: France Microprocessor Market Volume (K Tons) Forecast, by Application 2019 & 2032
- Table 31: Italy Microprocessor Market Revenue (Billion) Forecast, by Application 2019 & 2032
- Table 32: Italy Microprocessor Market Volume (K Tons) Forecast, by Application 2019 & 2032
- Table 33: Spain Microprocessor Market Revenue (Billion) Forecast, by Application 2019 & 2032
- Table 34: Spain Microprocessor Market Volume (K Tons) Forecast, by Application 2019 & 2032
- Table 35: Rest of Europe Microprocessor Market Revenue (Billion) Forecast, by Application 2019 & 2032
- Table 36: Rest of Europe Microprocessor Market Volume (K Tons) Forecast, by Application 2019 & 2032
- Table 37: Global Microprocessor Market Revenue Billion Forecast, by Architecture 2019 & 2032
- Table 38: Global Microprocessor Market Volume K Tons Forecast, by Architecture 2019 & 2032
- Table 39: Global Microprocessor Market Revenue Billion Forecast, by Application 2019 & 2032
- Table 40: Global Microprocessor Market Volume K Tons Forecast, by Application 2019 & 2032
- Table 41: Global Microprocessor Market Revenue Billion Forecast, by Country 2019 & 2032
- Table 42: Global Microprocessor Market Volume K Tons Forecast, by Country 2019 & 2032
- Table 43: China Microprocessor Market Revenue (Billion) Forecast, by Application 2019 & 2032
- Table 44: China Microprocessor Market Volume (K Tons) Forecast, by Application 2019 & 2032
- Table 45: India Microprocessor Market Revenue (Billion) Forecast, by Application 2019 & 2032
- Table 46: India Microprocessor Market Volume (K Tons) Forecast, by Application 2019 & 2032
- Table 47: Japan Microprocessor Market Revenue (Billion) Forecast, by Application 2019 & 2032
- Table 48: Japan Microprocessor Market Volume (K Tons) Forecast, by Application 2019 & 2032
- Table 49: South Korea Microprocessor Market Revenue (Billion) Forecast, by Application 2019 & 2032
- Table 50: South Korea Microprocessor Market Volume (K Tons) Forecast, by Application 2019 & 2032
- Table 51: ANZ Microprocessor Market Revenue (Billion) Forecast, by Application 2019 & 2032
- Table 52: ANZ Microprocessor Market Volume (K Tons) Forecast, by Application 2019 & 2032
- Table 53: Rest of Asia Pacific Microprocessor Market Revenue (Billion) Forecast, by Application 2019 & 2032
- Table 54: Rest of Asia Pacific Microprocessor Market Volume (K Tons) Forecast, by Application 2019 & 2032
- Table 55: Global Microprocessor Market Revenue Billion Forecast, by Architecture 2019 & 2032
- Table 56: Global Microprocessor Market Volume K Tons Forecast, by Architecture 2019 & 2032
- Table 57: Global Microprocessor Market Revenue Billion Forecast, by Application 2019 & 2032
- Table 58: Global Microprocessor Market Volume K Tons Forecast, by Application 2019 & 2032
- Table 59: Global Microprocessor Market Revenue Billion Forecast, by Country 2019 & 2032
- Table 60: Global Microprocessor Market Volume K Tons Forecast, by Country 2019 & 2032
- Table 61: Brazil Microprocessor Market Revenue (Billion) Forecast, by Application 2019 & 2032
- Table 62: Brazil Microprocessor Market Volume (K Tons) Forecast, by Application 2019 & 2032
- Table 63: Mexico Microprocessor Market Revenue (Billion) Forecast, by Application 2019 & 2032
- Table 64: Mexico Microprocessor Market Volume (K Tons) Forecast, by Application 2019 & 2032
- Table 65: Rest of Latin America Microprocessor Market Revenue (Billion) Forecast, by Application 2019 & 2032
- Table 66: Rest of Latin America Microprocessor Market Volume (K Tons) Forecast, by Application 2019 & 2032
- Table 67: Global Microprocessor Market Revenue Billion Forecast, by Architecture 2019 & 2032
- Table 68: Global Microprocessor Market Volume K Tons Forecast, by Architecture 2019 & 2032
- Table 69: Global Microprocessor Market Revenue Billion Forecast, by Application 2019 & 2032
- Table 70: Global Microprocessor Market Volume K Tons Forecast, by Application 2019 & 2032
- Table 71: Global Microprocessor Market Revenue Billion Forecast, by Country 2019 & 2032
- Table 72: Global Microprocessor Market Volume K Tons Forecast, by Country 2019 & 2032
- Table 73: UAE Microprocessor Market Revenue (Billion) Forecast, by Application 2019 & 2032
- Table 74: UAE Microprocessor Market Volume (K Tons) Forecast, by Application 2019 & 2032
- Table 75: Saudi Arabia Microprocessor Market Revenue (Billion) Forecast, by Application 2019 & 2032
- Table 76: Saudi Arabia Microprocessor Market Volume (K Tons) Forecast, by Application 2019 & 2032
- Table 77: South Africa Microprocessor Market Revenue (Billion) Forecast, by Application 2019 & 2032
- Table 78: South Africa Microprocessor Market Volume (K Tons) Forecast, by Application 2019 & 2032
- Table 79: Rest of MEA Microprocessor Market Revenue (Billion) Forecast, by Application 2019 & 2032
- Table 80: Rest of MEA Microprocessor Market Volume (K Tons) Forecast, by Application 2019 & 2032
STEP 1 - Identification of Relevant Samples Size from Population Database


STEP 2 - Approaches for Defining Global Market Size (Value, Volume* & Price*)

Note* : In applicable scenarios
STEP 3 - Data Sources
Primary Research
- Web Analytics
- Survey Reports
- Research Institute
- Latest Research Reports
- Opinion Leaders
Secondary Research
- Annual Reports
- White Paper
- Latest Press Release
- Industry Association
- Paid Database
- Investor Presentations

STEP 4 - Data Triangulation
Involves using different sources of information in order to increase the validity of a study
These sources are likely to be stakeholders in a program - participants, other researchers, program staff, other community members, and so on.
Then we put all data in single framework & apply various statistical tools to find out the dynamic on the market.
During the analysis stage, feedback from the stakeholder groups would be compared to determine areas of agreement as well as areas of divergence
Frequently Asked Questions
Related Reports
See the similar reports


About Market Insights Report
Market Insights Reports offers comprehensive market research reports and analysis, giving businesses important information about their clients, rivals, and sector to help them make well-informed decisions on operations, marketing, and business strategy. We offer a variety of services in addition to market research, data analysis, and strategy planning. In order to find opportunities and learn more about our competitors and the industry at large, we employ competitive analysis. To identify areas for development, we also evaluate our performance against that of our rivals. We can determine the places at which we can offer our clients the most value by performing value chain analysis.
Additionally, clients receive a thorough overview of their industry business environment. We can find trends that help us forecast future possibilities and threats by examining global macroeconomic dynamics and consumer behavior patterns. By analyzing their features and advantages, contrasting them with comparable items on the market, and evaluating both their quantitative and qualitative performance, we comprehensively evaluate our clients' products. This allows us to assist customers in determining how their goods compare to those of their rivals and in creating successful marketing plans. Our group has been successful in gaining a thorough grasp of our clients' requirements and offering them creative solutions. We currently provide services to more than 50 nations in Europe, the Middle East, Africa, Latin America, Asia Pacific, and North America. Because of our global reach, we have been able to establish trusting bonds with our partners and clients in various nations, improving customer service and forging a more cohesive worldwide presence.