Report banner
Occupancy Sensors Market
Updated On

Feb 18 2025

Total Pages

200

Occupancy Sensors Market Strategic Roadmap: Analysis and Forecasts 2025-2033

Occupancy Sensors Market by Technology (Passive Infrared (PIR), Ultrasonic, Dual technology, Microwave, Others), by Operation (Indoor operation, Outdoor operation), by Coverage Area (Less than 90 degree, 70-90 degree, 180-360 degree), by Building Type (Residential buildings, Commercial buildings), by Network Connectivity (Wired, Wireless), by Application (Lighting control, HVAC, Security & surveillance, Others), by North America (U.S., Canada), by Europe (Germany, UK, France, Italy, Spain, Rest of Europe), by Asia Pacific (China, India, Japan, South Korea, ANZ, Rest of Asia Pacific), by Latin America (Brazil, Mexico, Rest of Latin America), by MEA (UAE, Saudi Arabia, South Africa, Rest of MEA) Forecast 2025-2033

Publisher Logo

Occupancy Sensors Market Strategic Roadmap: Analysis and Forecasts 2025-2033


Key Insights

The size of the Occupancy Sensors Market was valued at USD 2 Billion in 2024 and is projected to reach USD 5.00 Billion by 2033, with an expected CAGR of 14% during the forecast period.These sensors play a crucial role in reducing energy consumption by automatically adjusting lighting, HVAC, and other building systems based on occupancy, leading to significant cost savings. The rise of smart homes and building automation systems has further fueled market demand. Technological advancements, including microwave, ultrasonic, and dual technology sensors, have enhanced accuracy and reliability, improving both convenience and security. With growing concerns over energy conservation and environmental sustainability, businesses and homeowners are increasingly adopting occupancy sensors to optimize resource utilization. Additionally, the integration of artificial intelligence (AI) and Internet of Things (IoT) technology is making these sensors more intelligent, allowing for advanced data analytics and predictive automation. As the market continues to expand, key players are focusing on innovation to enhance sensor capabilities and efficiency.

Occupancy Sensors Market Research Report - Market Size, Growth & Forecast

Occupancy Sensors Market Concentration & Characteristics

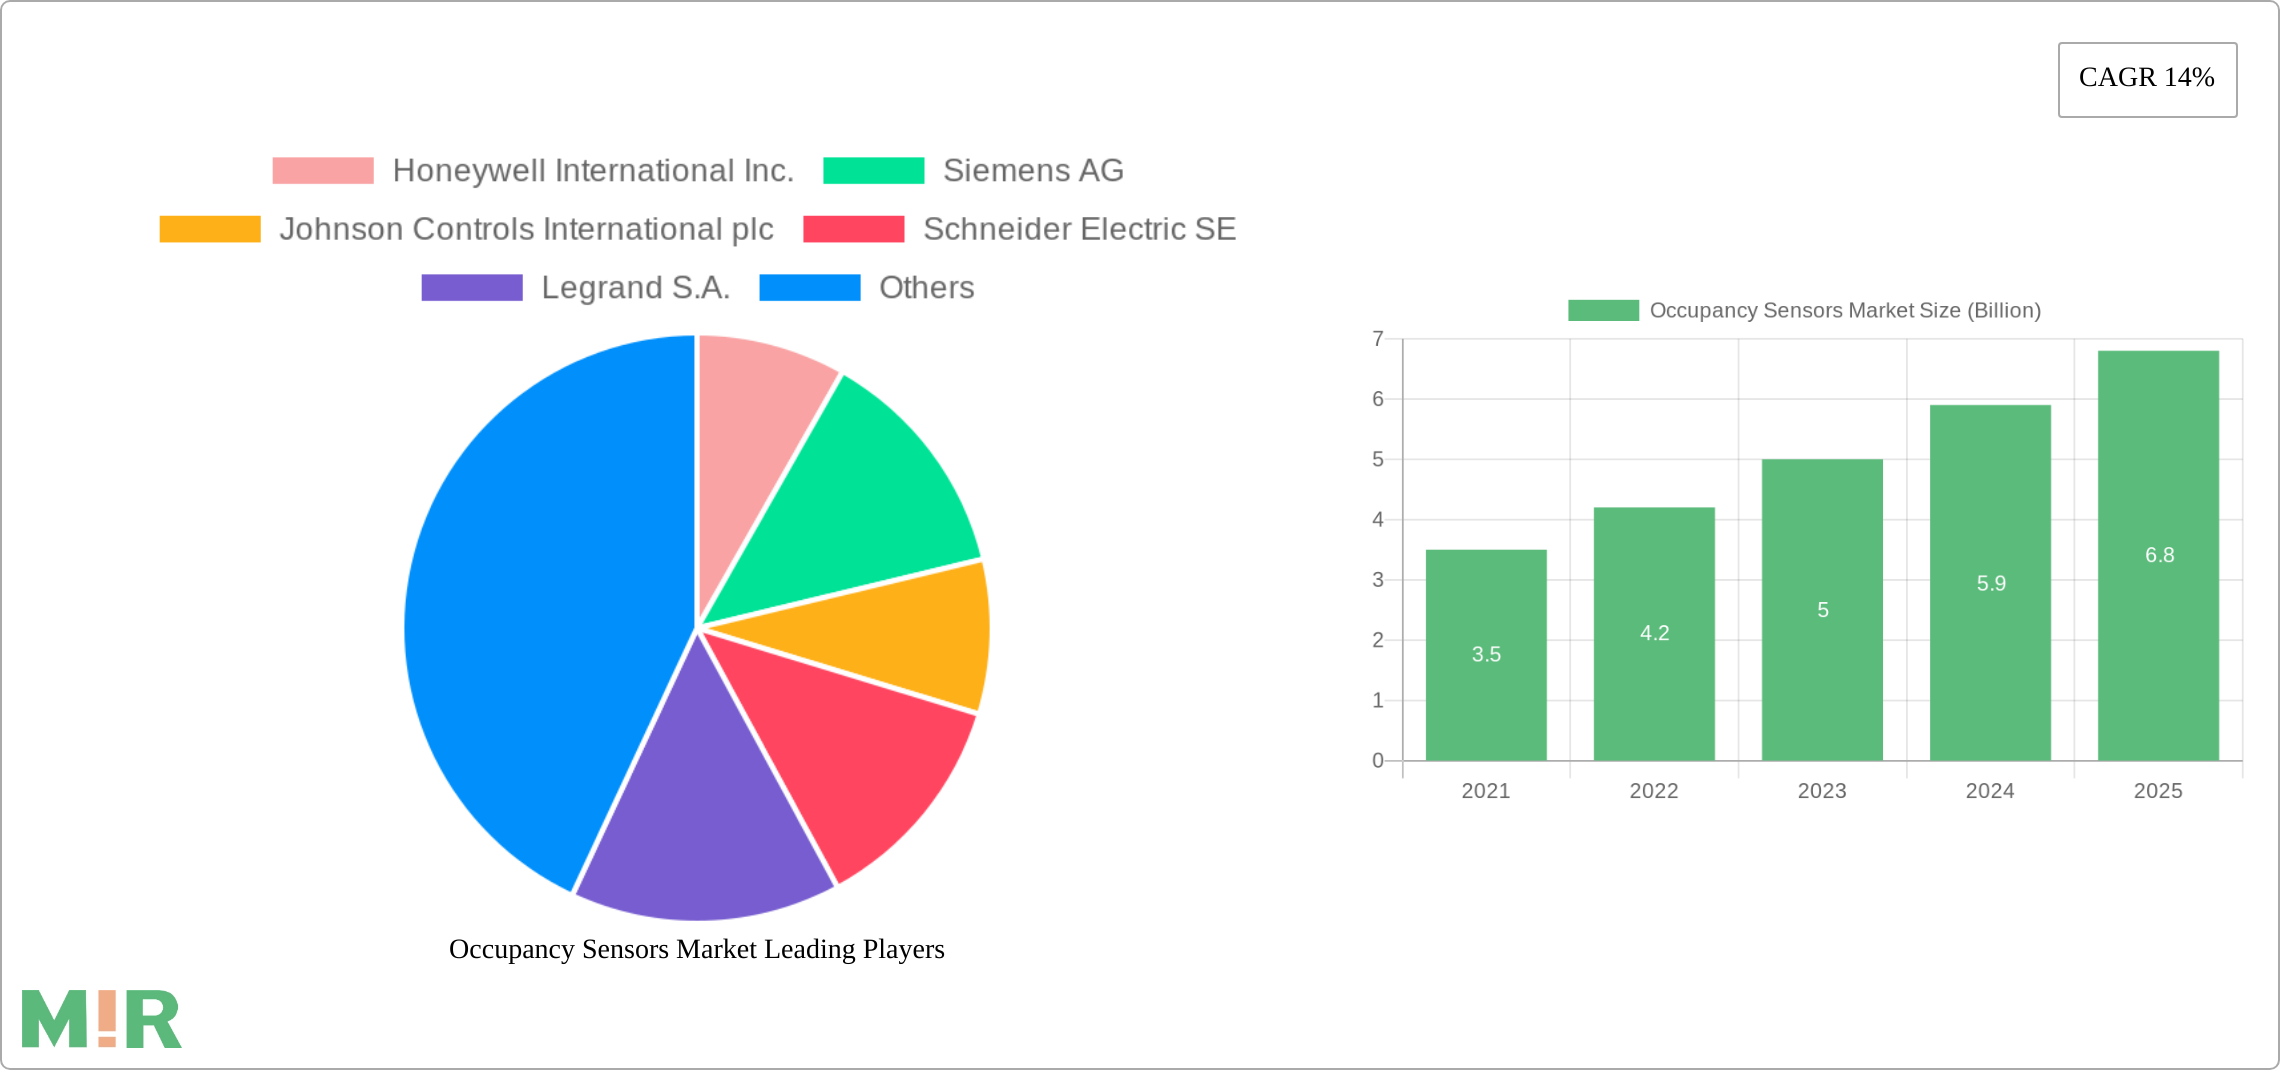
The Occupancy Sensors Market is characterized by a moderate level of concentration. Major players in the market include Honeywell International Inc., Siemens AG, Johnson Controls International plc, Schneider Electric SE, Legrand S.A., Lutron Electronics Co., Inc., and Texas Instruments Incorporated. These companies possess strong distribution networks and a wide range of product offerings, catering to various applications and market segments.

Innovation is a key characteristic of the Occupancy Sensors Market, with manufacturers continuously developing new technologies to improve sensor accuracy, reliability, and functionality. Government regulations and standards play a significant role in shaping the market, ensuring compliance with energy efficiency and safety requirements.

Occupancy Sensors Market Trends

The Occupancy Sensors Market is witnessing several key trends that are shaping its growth trajectory. The adoption of wireless occupancy sensors is on the rise, offering flexibility and ease of installation. The integration of occupancy sensors with building management systems (BMS) is another prominent trend, enabling centralized control and monitoring of building systems.

Advanced analytics and data collection capabilities are also gaining traction in the Occupancy Sensors Market. By leveraging data on occupancy patterns, businesses and organizations can optimize energy use, improve space planning, and enhance overall operational efficiency.

Occupancy Sensors Market Growth

Key Region or Country & Segment to Dominate the Market

Dominant Region: Asia Pacific is expected to remain the largest market for occupancy sensors throughout the forecast period. The region's rapid urbanization and growing construction industry are driving the demand for energy-efficient solutions.

Dominant Building Type: Commercial buildings are expected to account for the largest share of the Occupancy Sensors Market. The focus on energy conservation and the need for enhanced security in commercial spaces are contributing to the growing adoption of occupancy sensors in this segment.

Occupancy Sensors Market Product Insights Report Coverage & Deliverables

Coverage:

  • Market Size: Market size estimations by value and volume for the global and regional markets
  • Market Share: Market share analysis of leading players based on revenue
  • Growth Rates: Historical and projected growth rates for the market
  • Market Segmentation: Market segmentation by technology, operation, coverage area, building type, network connectivity, and application
  • Competitive Landscape: Company profiles, SWOT analysis, and market positioning

Deliverables:

  • Comprehensive research report
  • Excel data file containing market data
  • Analyst support for queries and clarifications

Occupancy Sensors Market Analysis

The Occupancy Sensors Market is expected to witness robust growth, reaching a valuation of 2 Billion by 2028. The rising demand for energy-efficient solutions, advancements in sensing technologies, and the growing adoption of smart building systems are key factors driving the market's growth.

Occupancy Sensors Market Regional Insights

North America: The North American market is expected to grow at a moderate pace, driven by government initiatives promoting energy efficiency and the increasing adoption of wireless occupancy sensors.

Europe: The European market is expected to witness significant growth, with the region's strong focus on sustainability and the growing adoption of occupancy sensors in commercial buildings.

Asia Pacific: The Asia Pacific market is expected to remain the largest and fastest-growing market, driven by the region's rapid urbanization, growing construction industry, and rising demand for energy-efficient solutions.

Driving Forces: What's Propelling the Occupancy Sensors Market

  • Government initiatives promoting energy efficiency
  • Technological advancements in sensing technologies
  • Growing adoption of smart home and building automation systems
  • Rising awareness of energy conservation

Challenges and Restraints in Occupancy Sensors Market

  • Implementation costs associated with installing and maintaining occupancy sensors
  • Concerns about privacy and data security
  • Limited availability of skilled installers

Emerging Trends in Occupancy Sensors Market

  • Adoption of wireless occupancy sensors
  • Integration with building management systems
  • Data analytics and optimization capabilities
  • Integration with smart home devices

Occupancy Sensors Industry News

September 2022:

  • Novelda announces the launch of its Ultra-wideband (UWB) occupancy sensor, providing precise and reliable detection with enhanced energy savings.

December 2021:

  • Aqara announces plans to market its next-generation occupancy sensor, the Aqara Human Presence Sensor FP1, offering highly accurate occupancy detection using 60GHz millimeter wave technology.

Leading Players in the Occupancy Sensors Market

Occupancy Sensors Market Segmentation

  • 1. Technology
    • 1.1. Passive Infrared (PIR)
    • 1.2. Ultrasonic
    • 1.3. Dual technology
    • 1.4. Microwave
    • 1.5. Others
  • 2. Operation
    • 2.1. Indoor operation
    • 2.2. Outdoor operation
  • 3. Coverage Area
    • 3.1. Less than 90 degree
    • 3.2. 70-90 degree
    • 3.3. 180-360 degree
  • 4. Building Type
    • 4.1. Residential buildings
    • 4.2. Commercial buildings
  • 5. Network Connectivity
    • 5.1. Wired
    • 5.2. Wireless
  • 6. Application
    • 6.1. Lighting control
    • 6.2. HVAC
    • 6.3. Security & surveillance
    • 6.4. Others

Occupancy Sensors Market Segmentation By Geography

  • 1. North America
    • 1.1. U.S.
    • 1.2. Canada
  • 2. Europe
    • 2.1. Germany
    • 2.2. UK
    • 2.3. France
    • 2.4. Italy
    • 2.5. Spain
    • 2.6. Rest of Europe
  • 3. Asia Pacific
    • 3.1. China
    • 3.2. India
    • 3.3. Japan
    • 3.4. South Korea
    • 3.5. ANZ
    • 3.6. Rest of Asia Pacific
  • 4. Latin America
    • 4.1. Brazil
    • 4.2. Mexico
    • 4.3. Rest of Latin America
  • 5. MEA
    • 5.1. UAE
    • 5.2. Saudi Arabia
    • 5.3. South Africa
    • 5.4. Rest of MEA

Occupancy Sensors Market Regional Share


Occupancy Sensors Market REPORT HIGHLIGHTS

AspectsDetails
Study Period 2019-2033
Base Year 2024
Estimated Year 2025
Forecast Period2025-2033
Historical Period2019-2024
Growth RateCAGR of 14% from 2019-2033
Segmentation
    • By Technology
      • Passive Infrared (PIR)
      • Ultrasonic
      • Dual technology
      • Microwave
      • Others
    • By Operation
      • Indoor operation
      • Outdoor operation
    • By Coverage Area
      • Less than 90 degree
      • 70-90 degree
      • 180-360 degree
    • By Building Type
      • Residential buildings
      • Commercial buildings
    • By Network Connectivity
      • Wired
      • Wireless
    • By Application
      • Lighting control
      • HVAC
      • Security & surveillance
      • Others
  • By Geography
    • North America
      • U.S.
      • Canada
    • Europe
      • Germany
      • UK
      • France
      • Italy
      • Spain
      • Rest of Europe
    • Asia Pacific
      • China
      • India
      • Japan
      • South Korea
      • ANZ
      • Rest of Asia Pacific
    • Latin America
      • Brazil
      • Mexico
      • Rest of Latin America
    • MEA
      • UAE
      • Saudi Arabia
      • South Africa
      • Rest of MEA


Table of Contents

  1. 1. Introduction
    • 1.1. Research Scope
    • 1.2. Market Segmentation
    • 1.3. Research Methodology
    • 1.4. Definitions and Assumptions
  2. 2. Executive Summary
    • 2.1. Introduction
  3. 3. Market Dynamics
    • 3.1. Introduction
      • 3.2. Market Drivers
        • 3.2.1 Increasing need for energy-efficient solutions
        • 3.2.2 Growing adoption in smart buildings
        • 3.2.3 Rising emphasis on green technologies
        • 3.2.4 Integration with IoT for smarter functionalities
        • 3.2.5 Demand for smart home solutions
      • 3.3. Market Restrains
        • 3.3.1 Occasional triggering errors impact reliability
        • 3.3.2 Regular upkeep requires time and resources
      • 3.4. Market Trends
        • 3.4.1 The Occupancy Sensors Market is witnessing several key trends that are shaping its growth trajectory. The adoption of wireless occupancy sensors is on the rise
        • 3.4.2 offering flexibility and ease of installation. The integration of occupancy sensors with building management systems (BMS) is another prominent trend
        • 3.4.3 enabling centralized control and monitoring of building systems.
  4. 4. Market Factor Analysis
    • 4.1. Porters Five Forces
    • 4.2. Supply/Value Chain
    • 4.3. PESTEL analysis
    • 4.4. Market Entropy
    • 4.5. Patent/Trademark Analysis
  5. 5. Global Occupancy Sensors Market Analysis, Insights and Forecast, 2019-2031
    • 5.1. Market Analysis, Insights and Forecast - by Technology
      • 5.1.1. Passive Infrared (PIR)
      • 5.1.2. Ultrasonic
      • 5.1.3. Dual technology
      • 5.1.4. Microwave
      • 5.1.5. Others
    • 5.2. Market Analysis, Insights and Forecast - by Operation
      • 5.2.1. Indoor operation
      • 5.2.2. Outdoor operation
    • 5.3. Market Analysis, Insights and Forecast - by Coverage Area
      • 5.3.1. Less than 90 degree
      • 5.3.2. 70-90 degree
      • 5.3.3. 180-360 degree
    • 5.4. Market Analysis, Insights and Forecast - by Building Type
      • 5.4.1. Residential buildings
      • 5.4.2. Commercial buildings
    • 5.5. Market Analysis, Insights and Forecast - by Network Connectivity
      • 5.5.1. Wired
      • 5.5.2. Wireless
    • 5.6. Market Analysis, Insights and Forecast - by Application
      • 5.6.1. Lighting control
      • 5.6.2. HVAC
      • 5.6.3. Security & surveillance
      • 5.6.4. Others
    • 5.7. Market Analysis, Insights and Forecast - by Region
      • 5.7.1. North America
      • 5.7.2. Europe
      • 5.7.3. Asia Pacific
      • 5.7.4. Latin America
      • 5.7.5. MEA
  6. 6. North America Occupancy Sensors Market Analysis, Insights and Forecast, 2019-2031
    • 6.1. Market Analysis, Insights and Forecast - by Technology
      • 6.1.1. Passive Infrared (PIR)
      • 6.1.2. Ultrasonic
      • 6.1.3. Dual technology
      • 6.1.4. Microwave
      • 6.1.5. Others
    • 6.2. Market Analysis, Insights and Forecast - by Operation
      • 6.2.1. Indoor operation
      • 6.2.2. Outdoor operation
    • 6.3. Market Analysis, Insights and Forecast - by Coverage Area
      • 6.3.1. Less than 90 degree
      • 6.3.2. 70-90 degree
      • 6.3.3. 180-360 degree
    • 6.4. Market Analysis, Insights and Forecast - by Building Type
      • 6.4.1. Residential buildings
      • 6.4.2. Commercial buildings
    • 6.5. Market Analysis, Insights and Forecast - by Network Connectivity
      • 6.5.1. Wired
      • 6.5.2. Wireless
    • 6.6. Market Analysis, Insights and Forecast - by Application
      • 6.6.1. Lighting control
      • 6.6.2. HVAC
      • 6.6.3. Security & surveillance
      • 6.6.4. Others
  7. 7. Europe Occupancy Sensors Market Analysis, Insights and Forecast, 2019-2031
    • 7.1. Market Analysis, Insights and Forecast - by Technology
      • 7.1.1. Passive Infrared (PIR)
      • 7.1.2. Ultrasonic
      • 7.1.3. Dual technology
      • 7.1.4. Microwave
      • 7.1.5. Others
    • 7.2. Market Analysis, Insights and Forecast - by Operation
      • 7.2.1. Indoor operation
      • 7.2.2. Outdoor operation
    • 7.3. Market Analysis, Insights and Forecast - by Coverage Area
      • 7.3.1. Less than 90 degree
      • 7.3.2. 70-90 degree
      • 7.3.3. 180-360 degree
    • 7.4. Market Analysis, Insights and Forecast - by Building Type
      • 7.4.1. Residential buildings
      • 7.4.2. Commercial buildings
    • 7.5. Market Analysis, Insights and Forecast - by Network Connectivity
      • 7.5.1. Wired
      • 7.5.2. Wireless
    • 7.6. Market Analysis, Insights and Forecast - by Application
      • 7.6.1. Lighting control
      • 7.6.2. HVAC
      • 7.6.3. Security & surveillance
      • 7.6.4. Others
  8. 8. Asia Pacific Occupancy Sensors Market Analysis, Insights and Forecast, 2019-2031
    • 8.1. Market Analysis, Insights and Forecast - by Technology
      • 8.1.1. Passive Infrared (PIR)
      • 8.1.2. Ultrasonic
      • 8.1.3. Dual technology
      • 8.1.4. Microwave
      • 8.1.5. Others
    • 8.2. Market Analysis, Insights and Forecast - by Operation
      • 8.2.1. Indoor operation
      • 8.2.2. Outdoor operation
    • 8.3. Market Analysis, Insights and Forecast - by Coverage Area
      • 8.3.1. Less than 90 degree
      • 8.3.2. 70-90 degree
      • 8.3.3. 180-360 degree
    • 8.4. Market Analysis, Insights and Forecast - by Building Type
      • 8.4.1. Residential buildings
      • 8.4.2. Commercial buildings
    • 8.5. Market Analysis, Insights and Forecast - by Network Connectivity
      • 8.5.1. Wired
      • 8.5.2. Wireless
    • 8.6. Market Analysis, Insights and Forecast - by Application
      • 8.6.1. Lighting control
      • 8.6.2. HVAC
      • 8.6.3. Security & surveillance
      • 8.6.4. Others
  9. 9. Latin America Occupancy Sensors Market Analysis, Insights and Forecast, 2019-2031
    • 9.1. Market Analysis, Insights and Forecast - by Technology
      • 9.1.1. Passive Infrared (PIR)
      • 9.1.2. Ultrasonic
      • 9.1.3. Dual technology
      • 9.1.4. Microwave
      • 9.1.5. Others
    • 9.2. Market Analysis, Insights and Forecast - by Operation
      • 9.2.1. Indoor operation
      • 9.2.2. Outdoor operation
    • 9.3. Market Analysis, Insights and Forecast - by Coverage Area
      • 9.3.1. Less than 90 degree
      • 9.3.2. 70-90 degree
      • 9.3.3. 180-360 degree
    • 9.4. Market Analysis, Insights and Forecast - by Building Type
      • 9.4.1. Residential buildings
      • 9.4.2. Commercial buildings
    • 9.5. Market Analysis, Insights and Forecast - by Network Connectivity
      • 9.5.1. Wired
      • 9.5.2. Wireless
    • 9.6. Market Analysis, Insights and Forecast - by Application
      • 9.6.1. Lighting control
      • 9.6.2. HVAC
      • 9.6.3. Security & surveillance
      • 9.6.4. Others
  10. 10. MEA Occupancy Sensors Market Analysis, Insights and Forecast, 2019-2031
    • 10.1. Market Analysis, Insights and Forecast - by Technology
      • 10.1.1. Passive Infrared (PIR)
      • 10.1.2. Ultrasonic
      • 10.1.3. Dual technology
      • 10.1.4. Microwave
      • 10.1.5. Others
    • 10.2. Market Analysis, Insights and Forecast - by Operation
      • 10.2.1. Indoor operation
      • 10.2.2. Outdoor operation
    • 10.3. Market Analysis, Insights and Forecast - by Coverage Area
      • 10.3.1. Less than 90 degree
      • 10.3.2. 70-90 degree
      • 10.3.3. 180-360 degree
    • 10.4. Market Analysis, Insights and Forecast - by Building Type
      • 10.4.1. Residential buildings
      • 10.4.2. Commercial buildings
    • 10.5. Market Analysis, Insights and Forecast - by Network Connectivity
      • 10.5.1. Wired
      • 10.5.2. Wireless
    • 10.6. Market Analysis, Insights and Forecast - by Application
      • 10.6.1. Lighting control
      • 10.6.2. HVAC
      • 10.6.3. Security & surveillance
      • 10.6.4. Others
  11. 11. Competitive Analysis
    • 11.1. Global Market Share Analysis 2024
      • 11.2. Company Profiles
        • 11.2.1 Honeywell International Inc.
          • 11.2.1.1. Overview
          • 11.2.1.2. Products
          • 11.2.1.3. SWOT Analysis
          • 11.2.1.4. Recent Developments
          • 11.2.1.5. Financials (Based on Availability)
        • 11.2.2 Siemens AG
          • 11.2.2.1. Overview
          • 11.2.2.2. Products
          • 11.2.2.3. SWOT Analysis
          • 11.2.2.4. Recent Developments
          • 11.2.2.5. Financials (Based on Availability)
        • 11.2.3 Johnson Controls International plc
          • 11.2.3.1. Overview
          • 11.2.3.2. Products
          • 11.2.3.3. SWOT Analysis
          • 11.2.3.4. Recent Developments
          • 11.2.3.5. Financials (Based on Availability)
        • 11.2.4 Schneider Electric SE
          • 11.2.4.1. Overview
          • 11.2.4.2. Products
          • 11.2.4.3. SWOT Analysis
          • 11.2.4.4. Recent Developments
          • 11.2.4.5. Financials (Based on Availability)
        • 11.2.5 Legrand S.A.
          • 11.2.5.1. Overview
          • 11.2.5.2. Products
          • 11.2.5.3. SWOT Analysis
          • 11.2.5.4. Recent Developments
          • 11.2.5.5. Financials (Based on Availability)
        • 11.2.6 Lutron Electronics Co. Inc.
          • 11.2.6.1. Overview
          • 11.2.6.2. Products
          • 11.2.6.3. SWOT Analysis
          • 11.2.6.4. Recent Developments
          • 11.2.6.5. Financials (Based on Availability)
        • 11.2.7 Texas Instruments Incorporated
          • 11.2.7.1. Overview
          • 11.2.7.2. Products
          • 11.2.7.3. SWOT Analysis
          • 11.2.7.4. Recent Developments
          • 11.2.7.5. Financials (Based on Availability)

List of Figures

  1. Figure 1: Global Occupancy Sensors Market Revenue Breakdown (Billion, %) by Region 2024 & 2032
  2. Figure 2: Global Occupancy Sensors Market Volume Breakdown (units, %) by Region 2024 & 2032
  3. Figure 3: North America Occupancy Sensors Market Revenue (Billion), by Technology 2024 & 2032
  4. Figure 4: North America Occupancy Sensors Market Volume (units), by Technology 2024 & 2032
  5. Figure 5: North America Occupancy Sensors Market Revenue Share (%), by Technology 2024 & 2032
  6. Figure 6: North America Occupancy Sensors Market Volume Share (%), by Technology 2024 & 2032
  7. Figure 7: North America Occupancy Sensors Market Revenue (Billion), by Operation 2024 & 2032
  8. Figure 8: North America Occupancy Sensors Market Volume (units), by Operation 2024 & 2032
  9. Figure 9: North America Occupancy Sensors Market Revenue Share (%), by Operation 2024 & 2032
  10. Figure 10: North America Occupancy Sensors Market Volume Share (%), by Operation 2024 & 2032
  11. Figure 11: North America Occupancy Sensors Market Revenue (Billion), by Coverage Area 2024 & 2032
  12. Figure 12: North America Occupancy Sensors Market Volume (units), by Coverage Area 2024 & 2032
  13. Figure 13: North America Occupancy Sensors Market Revenue Share (%), by Coverage Area 2024 & 2032
  14. Figure 14: North America Occupancy Sensors Market Volume Share (%), by Coverage Area 2024 & 2032
  15. Figure 15: North America Occupancy Sensors Market Revenue (Billion), by Building Type 2024 & 2032
  16. Figure 16: North America Occupancy Sensors Market Volume (units), by Building Type 2024 & 2032
  17. Figure 17: North America Occupancy Sensors Market Revenue Share (%), by Building Type 2024 & 2032
  18. Figure 18: North America Occupancy Sensors Market Volume Share (%), by Building Type 2024 & 2032
  19. Figure 19: North America Occupancy Sensors Market Revenue (Billion), by Network Connectivity 2024 & 2032
  20. Figure 20: North America Occupancy Sensors Market Volume (units), by Network Connectivity 2024 & 2032
  21. Figure 21: North America Occupancy Sensors Market Revenue Share (%), by Network Connectivity 2024 & 2032
  22. Figure 22: North America Occupancy Sensors Market Volume Share (%), by Network Connectivity 2024 & 2032
  23. Figure 23: North America Occupancy Sensors Market Revenue (Billion), by Application 2024 & 2032
  24. Figure 24: North America Occupancy Sensors Market Volume (units), by Application 2024 & 2032
  25. Figure 25: North America Occupancy Sensors Market Revenue Share (%), by Application 2024 & 2032
  26. Figure 26: North America Occupancy Sensors Market Volume Share (%), by Application 2024 & 2032
  27. Figure 27: North America Occupancy Sensors Market Revenue (Billion), by Country 2024 & 2032
  28. Figure 28: North America Occupancy Sensors Market Volume (units), by Country 2024 & 2032
  29. Figure 29: North America Occupancy Sensors Market Revenue Share (%), by Country 2024 & 2032
  30. Figure 30: North America Occupancy Sensors Market Volume Share (%), by Country 2024 & 2032
  31. Figure 31: Europe Occupancy Sensors Market Revenue (Billion), by Technology 2024 & 2032
  32. Figure 32: Europe Occupancy Sensors Market Volume (units), by Technology 2024 & 2032
  33. Figure 33: Europe Occupancy Sensors Market Revenue Share (%), by Technology 2024 & 2032
  34. Figure 34: Europe Occupancy Sensors Market Volume Share (%), by Technology 2024 & 2032
  35. Figure 35: Europe Occupancy Sensors Market Revenue (Billion), by Operation 2024 & 2032
  36. Figure 36: Europe Occupancy Sensors Market Volume (units), by Operation 2024 & 2032
  37. Figure 37: Europe Occupancy Sensors Market Revenue Share (%), by Operation 2024 & 2032
  38. Figure 38: Europe Occupancy Sensors Market Volume Share (%), by Operation 2024 & 2032
  39. Figure 39: Europe Occupancy Sensors Market Revenue (Billion), by Coverage Area 2024 & 2032
  40. Figure 40: Europe Occupancy Sensors Market Volume (units), by Coverage Area 2024 & 2032
  41. Figure 41: Europe Occupancy Sensors Market Revenue Share (%), by Coverage Area 2024 & 2032
  42. Figure 42: Europe Occupancy Sensors Market Volume Share (%), by Coverage Area 2024 & 2032
  43. Figure 43: Europe Occupancy Sensors Market Revenue (Billion), by Building Type 2024 & 2032
  44. Figure 44: Europe Occupancy Sensors Market Volume (units), by Building Type 2024 & 2032
  45. Figure 45: Europe Occupancy Sensors Market Revenue Share (%), by Building Type 2024 & 2032
  46. Figure 46: Europe Occupancy Sensors Market Volume Share (%), by Building Type 2024 & 2032
  47. Figure 47: Europe Occupancy Sensors Market Revenue (Billion), by Network Connectivity 2024 & 2032
  48. Figure 48: Europe Occupancy Sensors Market Volume (units), by Network Connectivity 2024 & 2032
  49. Figure 49: Europe Occupancy Sensors Market Revenue Share (%), by Network Connectivity 2024 & 2032
  50. Figure 50: Europe Occupancy Sensors Market Volume Share (%), by Network Connectivity 2024 & 2032
  51. Figure 51: Europe Occupancy Sensors Market Revenue (Billion), by Application 2024 & 2032
  52. Figure 52: Europe Occupancy Sensors Market Volume (units), by Application 2024 & 2032
  53. Figure 53: Europe Occupancy Sensors Market Revenue Share (%), by Application 2024 & 2032
  54. Figure 54: Europe Occupancy Sensors Market Volume Share (%), by Application 2024 & 2032
  55. Figure 55: Europe Occupancy Sensors Market Revenue (Billion), by Country 2024 & 2032
  56. Figure 56: Europe Occupancy Sensors Market Volume (units), by Country 2024 & 2032
  57. Figure 57: Europe Occupancy Sensors Market Revenue Share (%), by Country 2024 & 2032
  58. Figure 58: Europe Occupancy Sensors Market Volume Share (%), by Country 2024 & 2032
  59. Figure 59: Asia Pacific Occupancy Sensors Market Revenue (Billion), by Technology 2024 & 2032
  60. Figure 60: Asia Pacific Occupancy Sensors Market Volume (units), by Technology 2024 & 2032
  61. Figure 61: Asia Pacific Occupancy Sensors Market Revenue Share (%), by Technology 2024 & 2032
  62. Figure 62: Asia Pacific Occupancy Sensors Market Volume Share (%), by Technology 2024 & 2032
  63. Figure 63: Asia Pacific Occupancy Sensors Market Revenue (Billion), by Operation 2024 & 2032
  64. Figure 64: Asia Pacific Occupancy Sensors Market Volume (units), by Operation 2024 & 2032
  65. Figure 65: Asia Pacific Occupancy Sensors Market Revenue Share (%), by Operation 2024 & 2032
  66. Figure 66: Asia Pacific Occupancy Sensors Market Volume Share (%), by Operation 2024 & 2032
  67. Figure 67: Asia Pacific Occupancy Sensors Market Revenue (Billion), by Coverage Area 2024 & 2032
  68. Figure 68: Asia Pacific Occupancy Sensors Market Volume (units), by Coverage Area 2024 & 2032
  69. Figure 69: Asia Pacific Occupancy Sensors Market Revenue Share (%), by Coverage Area 2024 & 2032
  70. Figure 70: Asia Pacific Occupancy Sensors Market Volume Share (%), by Coverage Area 2024 & 2032
  71. Figure 71: Asia Pacific Occupancy Sensors Market Revenue (Billion), by Building Type 2024 & 2032
  72. Figure 72: Asia Pacific Occupancy Sensors Market Volume (units), by Building Type 2024 & 2032
  73. Figure 73: Asia Pacific Occupancy Sensors Market Revenue Share (%), by Building Type 2024 & 2032
  74. Figure 74: Asia Pacific Occupancy Sensors Market Volume Share (%), by Building Type 2024 & 2032
  75. Figure 75: Asia Pacific Occupancy Sensors Market Revenue (Billion), by Network Connectivity 2024 & 2032
  76. Figure 76: Asia Pacific Occupancy Sensors Market Volume (units), by Network Connectivity 2024 & 2032
  77. Figure 77: Asia Pacific Occupancy Sensors Market Revenue Share (%), by Network Connectivity 2024 & 2032
  78. Figure 78: Asia Pacific Occupancy Sensors Market Volume Share (%), by Network Connectivity 2024 & 2032
  79. Figure 79: Asia Pacific Occupancy Sensors Market Revenue (Billion), by Application 2024 & 2032
  80. Figure 80: Asia Pacific Occupancy Sensors Market Volume (units), by Application 2024 & 2032
  81. Figure 81: Asia Pacific Occupancy Sensors Market Revenue Share (%), by Application 2024 & 2032
  82. Figure 82: Asia Pacific Occupancy Sensors Market Volume Share (%), by Application 2024 & 2032
  83. Figure 83: Asia Pacific Occupancy Sensors Market Revenue (Billion), by Country 2024 & 2032
  84. Figure 84: Asia Pacific Occupancy Sensors Market Volume (units), by Country 2024 & 2032
  85. Figure 85: Asia Pacific Occupancy Sensors Market Revenue Share (%), by Country 2024 & 2032
  86. Figure 86: Asia Pacific Occupancy Sensors Market Volume Share (%), by Country 2024 & 2032
  87. Figure 87: Latin America Occupancy Sensors Market Revenue (Billion), by Technology 2024 & 2032
  88. Figure 88: Latin America Occupancy Sensors Market Volume (units), by Technology 2024 & 2032
  89. Figure 89: Latin America Occupancy Sensors Market Revenue Share (%), by Technology 2024 & 2032
  90. Figure 90: Latin America Occupancy Sensors Market Volume Share (%), by Technology 2024 & 2032
  91. Figure 91: Latin America Occupancy Sensors Market Revenue (Billion), by Operation 2024 & 2032
  92. Figure 92: Latin America Occupancy Sensors Market Volume (units), by Operation 2024 & 2032
  93. Figure 93: Latin America Occupancy Sensors Market Revenue Share (%), by Operation 2024 & 2032
  94. Figure 94: Latin America Occupancy Sensors Market Volume Share (%), by Operation 2024 & 2032
  95. Figure 95: Latin America Occupancy Sensors Market Revenue (Billion), by Coverage Area 2024 & 2032
  96. Figure 96: Latin America Occupancy Sensors Market Volume (units), by Coverage Area 2024 & 2032
  97. Figure 97: Latin America Occupancy Sensors Market Revenue Share (%), by Coverage Area 2024 & 2032
  98. Figure 98: Latin America Occupancy Sensors Market Volume Share (%), by Coverage Area 2024 & 2032
  99. Figure 99: Latin America Occupancy Sensors Market Revenue (Billion), by Building Type 2024 & 2032
  100. Figure 100: Latin America Occupancy Sensors Market Volume (units), by Building Type 2024 & 2032
  101. Figure 101: Latin America Occupancy Sensors Market Revenue Share (%), by Building Type 2024 & 2032
  102. Figure 102: Latin America Occupancy Sensors Market Volume Share (%), by Building Type 2024 & 2032
  103. Figure 103: Latin America Occupancy Sensors Market Revenue (Billion), by Network Connectivity 2024 & 2032
  104. Figure 104: Latin America Occupancy Sensors Market Volume (units), by Network Connectivity 2024 & 2032
  105. Figure 105: Latin America Occupancy Sensors Market Revenue Share (%), by Network Connectivity 2024 & 2032
  106. Figure 106: Latin America Occupancy Sensors Market Volume Share (%), by Network Connectivity 2024 & 2032
  107. Figure 107: Latin America Occupancy Sensors Market Revenue (Billion), by Application 2024 & 2032
  108. Figure 108: Latin America Occupancy Sensors Market Volume (units), by Application 2024 & 2032
  109. Figure 109: Latin America Occupancy Sensors Market Revenue Share (%), by Application 2024 & 2032
  110. Figure 110: Latin America Occupancy Sensors Market Volume Share (%), by Application 2024 & 2032
  111. Figure 111: Latin America Occupancy Sensors Market Revenue (Billion), by Country 2024 & 2032
  112. Figure 112: Latin America Occupancy Sensors Market Volume (units), by Country 2024 & 2032
  113. Figure 113: Latin America Occupancy Sensors Market Revenue Share (%), by Country 2024 & 2032
  114. Figure 114: Latin America Occupancy Sensors Market Volume Share (%), by Country 2024 & 2032
  115. Figure 115: MEA Occupancy Sensors Market Revenue (Billion), by Technology 2024 & 2032
  116. Figure 116: MEA Occupancy Sensors Market Volume (units), by Technology 2024 & 2032
  117. Figure 117: MEA Occupancy Sensors Market Revenue Share (%), by Technology 2024 & 2032
  118. Figure 118: MEA Occupancy Sensors Market Volume Share (%), by Technology 2024 & 2032
  119. Figure 119: MEA Occupancy Sensors Market Revenue (Billion), by Operation 2024 & 2032
  120. Figure 120: MEA Occupancy Sensors Market Volume (units), by Operation 2024 & 2032
  121. Figure 121: MEA Occupancy Sensors Market Revenue Share (%), by Operation 2024 & 2032
  122. Figure 122: MEA Occupancy Sensors Market Volume Share (%), by Operation 2024 & 2032
  123. Figure 123: MEA Occupancy Sensors Market Revenue (Billion), by Coverage Area 2024 & 2032
  124. Figure 124: MEA Occupancy Sensors Market Volume (units), by Coverage Area 2024 & 2032
  125. Figure 125: MEA Occupancy Sensors Market Revenue Share (%), by Coverage Area 2024 & 2032
  126. Figure 126: MEA Occupancy Sensors Market Volume Share (%), by Coverage Area 2024 & 2032
  127. Figure 127: MEA Occupancy Sensors Market Revenue (Billion), by Building Type 2024 & 2032
  128. Figure 128: MEA Occupancy Sensors Market Volume (units), by Building Type 2024 & 2032
  129. Figure 129: MEA Occupancy Sensors Market Revenue Share (%), by Building Type 2024 & 2032
  130. Figure 130: MEA Occupancy Sensors Market Volume Share (%), by Building Type 2024 & 2032
  131. Figure 131: MEA Occupancy Sensors Market Revenue (Billion), by Network Connectivity 2024 & 2032
  132. Figure 132: MEA Occupancy Sensors Market Volume (units), by Network Connectivity 2024 & 2032
  133. Figure 133: MEA Occupancy Sensors Market Revenue Share (%), by Network Connectivity 2024 & 2032
  134. Figure 134: MEA Occupancy Sensors Market Volume Share (%), by Network Connectivity 2024 & 2032
  135. Figure 135: MEA Occupancy Sensors Market Revenue (Billion), by Application 2024 & 2032
  136. Figure 136: MEA Occupancy Sensors Market Volume (units), by Application 2024 & 2032
  137. Figure 137: MEA Occupancy Sensors Market Revenue Share (%), by Application 2024 & 2032
  138. Figure 138: MEA Occupancy Sensors Market Volume Share (%), by Application 2024 & 2032
  139. Figure 139: MEA Occupancy Sensors Market Revenue (Billion), by Country 2024 & 2032
  140. Figure 140: MEA Occupancy Sensors Market Volume (units), by Country 2024 & 2032
  141. Figure 141: MEA Occupancy Sensors Market Revenue Share (%), by Country 2024 & 2032
  142. Figure 142: MEA Occupancy Sensors Market Volume Share (%), by Country 2024 & 2032

List of Tables

  1. Table 1: Global Occupancy Sensors Market Revenue Billion Forecast, by Region 2019 & 2032
  2. Table 2: Global Occupancy Sensors Market Volume units Forecast, by Region 2019 & 2032
  3. Table 3: Global Occupancy Sensors Market Revenue Billion Forecast, by Technology 2019 & 2032
  4. Table 4: Global Occupancy Sensors Market Volume units Forecast, by Technology 2019 & 2032
  5. Table 5: Global Occupancy Sensors Market Revenue Billion Forecast, by Operation 2019 & 2032
  6. Table 6: Global Occupancy Sensors Market Volume units Forecast, by Operation 2019 & 2032
  7. Table 7: Global Occupancy Sensors Market Revenue Billion Forecast, by Coverage Area 2019 & 2032
  8. Table 8: Global Occupancy Sensors Market Volume units Forecast, by Coverage Area 2019 & 2032
  9. Table 9: Global Occupancy Sensors Market Revenue Billion Forecast, by Building Type 2019 & 2032
  10. Table 10: Global Occupancy Sensors Market Volume units Forecast, by Building Type 2019 & 2032
  11. Table 11: Global Occupancy Sensors Market Revenue Billion Forecast, by Network Connectivity 2019 & 2032
  12. Table 12: Global Occupancy Sensors Market Volume units Forecast, by Network Connectivity 2019 & 2032
  13. Table 13: Global Occupancy Sensors Market Revenue Billion Forecast, by Application 2019 & 2032
  14. Table 14: Global Occupancy Sensors Market Volume units Forecast, by Application 2019 & 2032
  15. Table 15: Global Occupancy Sensors Market Revenue Billion Forecast, by Region 2019 & 2032
  16. Table 16: Global Occupancy Sensors Market Volume units Forecast, by Region 2019 & 2032
  17. Table 17: Global Occupancy Sensors Market Revenue Billion Forecast, by Technology 2019 & 2032
  18. Table 18: Global Occupancy Sensors Market Volume units Forecast, by Technology 2019 & 2032
  19. Table 19: Global Occupancy Sensors Market Revenue Billion Forecast, by Operation 2019 & 2032
  20. Table 20: Global Occupancy Sensors Market Volume units Forecast, by Operation 2019 & 2032
  21. Table 21: Global Occupancy Sensors Market Revenue Billion Forecast, by Coverage Area 2019 & 2032
  22. Table 22: Global Occupancy Sensors Market Volume units Forecast, by Coverage Area 2019 & 2032
  23. Table 23: Global Occupancy Sensors Market Revenue Billion Forecast, by Building Type 2019 & 2032
  24. Table 24: Global Occupancy Sensors Market Volume units Forecast, by Building Type 2019 & 2032
  25. Table 25: Global Occupancy Sensors Market Revenue Billion Forecast, by Network Connectivity 2019 & 2032
  26. Table 26: Global Occupancy Sensors Market Volume units Forecast, by Network Connectivity 2019 & 2032
  27. Table 27: Global Occupancy Sensors Market Revenue Billion Forecast, by Application 2019 & 2032
  28. Table 28: Global Occupancy Sensors Market Volume units Forecast, by Application 2019 & 2032
  29. Table 29: Global Occupancy Sensors Market Revenue Billion Forecast, by Country 2019 & 2032
  30. Table 30: Global Occupancy Sensors Market Volume units Forecast, by Country 2019 & 2032
  31. Table 31: U.S. Occupancy Sensors Market Revenue (Billion) Forecast, by Application 2019 & 2032
  32. Table 32: U.S. Occupancy Sensors Market Volume (units) Forecast, by Application 2019 & 2032
  33. Table 33: Canada Occupancy Sensors Market Revenue (Billion) Forecast, by Application 2019 & 2032
  34. Table 34: Canada Occupancy Sensors Market Volume (units) Forecast, by Application 2019 & 2032
  35. Table 35: Global Occupancy Sensors Market Revenue Billion Forecast, by Technology 2019 & 2032
  36. Table 36: Global Occupancy Sensors Market Volume units Forecast, by Technology 2019 & 2032
  37. Table 37: Global Occupancy Sensors Market Revenue Billion Forecast, by Operation 2019 & 2032
  38. Table 38: Global Occupancy Sensors Market Volume units Forecast, by Operation 2019 & 2032
  39. Table 39: Global Occupancy Sensors Market Revenue Billion Forecast, by Coverage Area 2019 & 2032
  40. Table 40: Global Occupancy Sensors Market Volume units Forecast, by Coverage Area 2019 & 2032
  41. Table 41: Global Occupancy Sensors Market Revenue Billion Forecast, by Building Type 2019 & 2032
  42. Table 42: Global Occupancy Sensors Market Volume units Forecast, by Building Type 2019 & 2032
  43. Table 43: Global Occupancy Sensors Market Revenue Billion Forecast, by Network Connectivity 2019 & 2032
  44. Table 44: Global Occupancy Sensors Market Volume units Forecast, by Network Connectivity 2019 & 2032
  45. Table 45: Global Occupancy Sensors Market Revenue Billion Forecast, by Application 2019 & 2032
  46. Table 46: Global Occupancy Sensors Market Volume units Forecast, by Application 2019 & 2032
  47. Table 47: Global Occupancy Sensors Market Revenue Billion Forecast, by Country 2019 & 2032
  48. Table 48: Global Occupancy Sensors Market Volume units Forecast, by Country 2019 & 2032
  49. Table 49: Germany Occupancy Sensors Market Revenue (Billion) Forecast, by Application 2019 & 2032
  50. Table 50: Germany Occupancy Sensors Market Volume (units) Forecast, by Application 2019 & 2032
  51. Table 51: UK Occupancy Sensors Market Revenue (Billion) Forecast, by Application 2019 & 2032
  52. Table 52: UK Occupancy Sensors Market Volume (units) Forecast, by Application 2019 & 2032
  53. Table 53: France Occupancy Sensors Market Revenue (Billion) Forecast, by Application 2019 & 2032
  54. Table 54: France Occupancy Sensors Market Volume (units) Forecast, by Application 2019 & 2032
  55. Table 55: Italy Occupancy Sensors Market Revenue (Billion) Forecast, by Application 2019 & 2032
  56. Table 56: Italy Occupancy Sensors Market Volume (units) Forecast, by Application 2019 & 2032
  57. Table 57: Spain Occupancy Sensors Market Revenue (Billion) Forecast, by Application 2019 & 2032
  58. Table 58: Spain Occupancy Sensors Market Volume (units) Forecast, by Application 2019 & 2032
  59. Table 59: Rest of Europe Occupancy Sensors Market Revenue (Billion) Forecast, by Application 2019 & 2032
  60. Table 60: Rest of Europe Occupancy Sensors Market Volume (units) Forecast, by Application 2019 & 2032
  61. Table 61: Global Occupancy Sensors Market Revenue Billion Forecast, by Technology 2019 & 2032
  62. Table 62: Global Occupancy Sensors Market Volume units Forecast, by Technology 2019 & 2032
  63. Table 63: Global Occupancy Sensors Market Revenue Billion Forecast, by Operation 2019 & 2032
  64. Table 64: Global Occupancy Sensors Market Volume units Forecast, by Operation 2019 & 2032
  65. Table 65: Global Occupancy Sensors Market Revenue Billion Forecast, by Coverage Area 2019 & 2032
  66. Table 66: Global Occupancy Sensors Market Volume units Forecast, by Coverage Area 2019 & 2032
  67. Table 67: Global Occupancy Sensors Market Revenue Billion Forecast, by Building Type 2019 & 2032
  68. Table 68: Global Occupancy Sensors Market Volume units Forecast, by Building Type 2019 & 2032
  69. Table 69: Global Occupancy Sensors Market Revenue Billion Forecast, by Network Connectivity 2019 & 2032
  70. Table 70: Global Occupancy Sensors Market Volume units Forecast, by Network Connectivity 2019 & 2032
  71. Table 71: Global Occupancy Sensors Market Revenue Billion Forecast, by Application 2019 & 2032
  72. Table 72: Global Occupancy Sensors Market Volume units Forecast, by Application 2019 & 2032
  73. Table 73: Global Occupancy Sensors Market Revenue Billion Forecast, by Country 2019 & 2032
  74. Table 74: Global Occupancy Sensors Market Volume units Forecast, by Country 2019 & 2032
  75. Table 75: China Occupancy Sensors Market Revenue (Billion) Forecast, by Application 2019 & 2032
  76. Table 76: China Occupancy Sensors Market Volume (units) Forecast, by Application 2019 & 2032
  77. Table 77: India Occupancy Sensors Market Revenue (Billion) Forecast, by Application 2019 & 2032
  78. Table 78: India Occupancy Sensors Market Volume (units) Forecast, by Application 2019 & 2032
  79. Table 79: Japan Occupancy Sensors Market Revenue (Billion) Forecast, by Application 2019 & 2032
  80. Table 80: Japan Occupancy Sensors Market Volume (units) Forecast, by Application 2019 & 2032
  81. Table 81: South Korea Occupancy Sensors Market Revenue (Billion) Forecast, by Application 2019 & 2032
  82. Table 82: South Korea Occupancy Sensors Market Volume (units) Forecast, by Application 2019 & 2032
  83. Table 83: ANZ Occupancy Sensors Market Revenue (Billion) Forecast, by Application 2019 & 2032
  84. Table 84: ANZ Occupancy Sensors Market Volume (units) Forecast, by Application 2019 & 2032
  85. Table 85: Rest of Asia Pacific Occupancy Sensors Market Revenue (Billion) Forecast, by Application 2019 & 2032
  86. Table 86: Rest of Asia Pacific Occupancy Sensors Market Volume (units) Forecast, by Application 2019 & 2032
  87. Table 87: Global Occupancy Sensors Market Revenue Billion Forecast, by Technology 2019 & 2032
  88. Table 88: Global Occupancy Sensors Market Volume units Forecast, by Technology 2019 & 2032
  89. Table 89: Global Occupancy Sensors Market Revenue Billion Forecast, by Operation 2019 & 2032
  90. Table 90: Global Occupancy Sensors Market Volume units Forecast, by Operation 2019 & 2032
  91. Table 91: Global Occupancy Sensors Market Revenue Billion Forecast, by Coverage Area 2019 & 2032
  92. Table 92: Global Occupancy Sensors Market Volume units Forecast, by Coverage Area 2019 & 2032
  93. Table 93: Global Occupancy Sensors Market Revenue Billion Forecast, by Building Type 2019 & 2032
  94. Table 94: Global Occupancy Sensors Market Volume units Forecast, by Building Type 2019 & 2032
  95. Table 95: Global Occupancy Sensors Market Revenue Billion Forecast, by Network Connectivity 2019 & 2032
  96. Table 96: Global Occupancy Sensors Market Volume units Forecast, by Network Connectivity 2019 & 2032
  97. Table 97: Global Occupancy Sensors Market Revenue Billion Forecast, by Application 2019 & 2032
  98. Table 98: Global Occupancy Sensors Market Volume units Forecast, by Application 2019 & 2032
  99. Table 99: Global Occupancy Sensors Market Revenue Billion Forecast, by Country 2019 & 2032
  100. Table 100: Global Occupancy Sensors Market Volume units Forecast, by Country 2019 & 2032
  101. Table 101: Brazil Occupancy Sensors Market Revenue (Billion) Forecast, by Application 2019 & 2032
  102. Table 102: Brazil Occupancy Sensors Market Volume (units) Forecast, by Application 2019 & 2032
  103. Table 103: Mexico Occupancy Sensors Market Revenue (Billion) Forecast, by Application 2019 & 2032
  104. Table 104: Mexico Occupancy Sensors Market Volume (units) Forecast, by Application 2019 & 2032
  105. Table 105: Rest of Latin America Occupancy Sensors Market Revenue (Billion) Forecast, by Application 2019 & 2032
  106. Table 106: Rest of Latin America Occupancy Sensors Market Volume (units) Forecast, by Application 2019 & 2032
  107. Table 107: Global Occupancy Sensors Market Revenue Billion Forecast, by Technology 2019 & 2032
  108. Table 108: Global Occupancy Sensors Market Volume units Forecast, by Technology 2019 & 2032
  109. Table 109: Global Occupancy Sensors Market Revenue Billion Forecast, by Operation 2019 & 2032
  110. Table 110: Global Occupancy Sensors Market Volume units Forecast, by Operation 2019 & 2032
  111. Table 111: Global Occupancy Sensors Market Revenue Billion Forecast, by Coverage Area 2019 & 2032
  112. Table 112: Global Occupancy Sensors Market Volume units Forecast, by Coverage Area 2019 & 2032
  113. Table 113: Global Occupancy Sensors Market Revenue Billion Forecast, by Building Type 2019 & 2032
  114. Table 114: Global Occupancy Sensors Market Volume units Forecast, by Building Type 2019 & 2032
  115. Table 115: Global Occupancy Sensors Market Revenue Billion Forecast, by Network Connectivity 2019 & 2032
  116. Table 116: Global Occupancy Sensors Market Volume units Forecast, by Network Connectivity 2019 & 2032
  117. Table 117: Global Occupancy Sensors Market Revenue Billion Forecast, by Application 2019 & 2032
  118. Table 118: Global Occupancy Sensors Market Volume units Forecast, by Application 2019 & 2032
  119. Table 119: Global Occupancy Sensors Market Revenue Billion Forecast, by Country 2019 & 2032
  120. Table 120: Global Occupancy Sensors Market Volume units Forecast, by Country 2019 & 2032
  121. Table 121: UAE Occupancy Sensors Market Revenue (Billion) Forecast, by Application 2019 & 2032
  122. Table 122: UAE Occupancy Sensors Market Volume (units) Forecast, by Application 2019 & 2032
  123. Table 123: Saudi Arabia Occupancy Sensors Market Revenue (Billion) Forecast, by Application 2019 & 2032
  124. Table 124: Saudi Arabia Occupancy Sensors Market Volume (units) Forecast, by Application 2019 & 2032
  125. Table 125: South Africa Occupancy Sensors Market Revenue (Billion) Forecast, by Application 2019 & 2032
  126. Table 126: South Africa Occupancy Sensors Market Volume (units) Forecast, by Application 2019 & 2032
  127. Table 127: Rest of MEA Occupancy Sensors Market Revenue (Billion) Forecast, by Application 2019 & 2032
  128. Table 128: Rest of MEA Occupancy Sensors Market Volume (units) Forecast, by Application 2019 & 2032


STEP 1 - Identification of Relevant Samples Size from Population Database

Step Chart
bar chart
method chart

STEP 2 - Approaches for Defining Global Market Size (Value, Volume* & Price*)

approach chart
Top-down and bottom-up approaches are used to validate the global market size and estimate the market size for manufactures, regional segemnts, product and application.

Note* : In applicable scenarios

STEP 3 - Data Sources

Primary Research

  • Web Analytics
  • Survey Reports
  • Research Institute
  • Latest Research Reports
  • Opinion Leaders

Secondary Research

  • Annual Reports
  • White Paper
  • Latest Press Release
  • Industry Association
  • Paid Database
  • Investor Presentations
approach chart

STEP 4 - Data Triangulation

Involves using different sources of information in order to increase the validity of a study

These sources are likely to be stakeholders in a program - participants, other researchers, program staff, other community members, and so on.

Then we put all data in single framework & apply various statistical tools to find out the dynamic on the market.

During the analysis stage, feedback from the stakeholder groups would be compared to determine areas of agreement as well as areas of divergence

Additionally after gathering mix and scattered data from wide range of sources, data is triangull- ated and correlated to come up with estimated figures which are further validated through primary mediums, or industry experts, opinion leader.

Frequently Asked Questions

1. What is the projected Compound Annual Growth Rate (CAGR) of the Occupancy Sensors Market?

The projected CAGR is approximately 14%.

2. Which companies are prominent players in the Occupancy Sensors Market?

Key companies in the market include Honeywell International Inc., Siemens AG, Johnson Controls International plc, Schneider Electric SE, Legrand S.A., Lutron Electronics Co., Inc., Texas Instruments Incorporated.

3. What are the main segments of the Occupancy Sensors Market?

The market segments include Technology, Operation, Coverage Area, Building Type, Network Connectivity, Application.

4. Can you provide details about the market size?

The market size is estimated to be USD 2 Billion as of 2022.

5. What are some drivers contributing to market growth?

Increasing need for energy-efficient solutions. Growing adoption in smart buildings. Rising emphasis on green technologies. Integration with IoT for smarter functionalities. Demand for smart home solutions.

6. What are the notable trends driving market growth?

The Occupancy Sensors Market is witnessing several key trends that are shaping its growth trajectory. The adoption of wireless occupancy sensors is on the rise. offering flexibility and ease of installation. The integration of occupancy sensors with building management systems (BMS) is another prominent trend. enabling centralized control and monitoring of building systems..

7. Are there any restraints impacting market growth?

Occasional triggering errors impact reliability. Regular upkeep requires time and resources.

8. Can you provide examples of recent developments in the market?

In September 2022, Novelda, the best-selling human presence sensor brand, announced its Ultra-wideband (UWB) occupancy sensor. When one approaches the sensor, lights are instantly turned on and quickly turned off, enhancing energy savings and improving the user experience. This sensor takes building lighting automation to the next level by allowing the user to configure the time-out and the precise detection zone.

9. What pricing options are available for accessing the report?

Pricing options include single-user, multi-user, and enterprise licenses priced at USD 4,850, USD 5,350, and USD 8,350 respectively.

10. Is the market size provided in terms of value or volume?

The market size is provided in terms of value, measured in Billion and volume, measured in units.

11. Are there any specific market keywords associated with the report?

Yes, the market keyword associated with the report is "Occupancy Sensors Market," which aids in identifying and referencing the specific market segment covered.

12. How do I determine which pricing option suits my needs best?

The pricing options vary based on user requirements and access needs. Individual users may opt for single-user licenses, while businesses requiring broader access may choose multi-user or enterprise licenses for cost-effective access to the report.

13. Are there any additional resources or data provided in the Occupancy Sensors Market report?

While the report offers comprehensive insights, it's advisable to review the specific contents or supplementary materials provided to ascertain if additional resources or data are available.

14. How can I stay updated on further developments or reports in the Occupancy Sensors Market?

To stay informed about further developments, trends, and reports in the Occupancy Sensors Market, consider subscribing to industry newsletters, following relevant companies and organizations, or regularly checking reputable industry news sources and publications.

Related Reports

See the similar reports

Discover the Latest Market Insight Reports

Access in-depth insights on industries, companies, trends, and global markets. Our expertly curated reports provide the most relevant data and analysis in a condensed, easy-to-read format.

shop image 1

About Market Insights Report

Market Insights Reports offers comprehensive market research reports and analysis, giving businesses important information about their clients, rivals, and sector to help them make well-informed decisions on operations, marketing, and business strategy. We offer a variety of services in addition to market research, data analysis, and strategy planning. In order to find opportunities and learn more about our competitors and the industry at large, we employ competitive analysis. To identify areas for development, we also evaluate our performance against that of our rivals. We can determine the places at which we can offer our clients the most value by performing value chain analysis.

Additionally, clients receive a thorough overview of their industry business environment. We can find trends that help us forecast future possibilities and threats by examining global macroeconomic dynamics and consumer behavior patterns. By analyzing their features and advantages, contrasting them with comparable items on the market, and evaluating both their quantitative and qualitative performance, we comprehensively evaluate our clients' products. This allows us to assist customers in determining how their goods compare to those of their rivals and in creating successful marketing plans. Our group has been successful in gaining a thorough grasp of our clients' requirements and offering them creative solutions. We currently provide services to more than 50 nations in Europe, the Middle East, Africa, Latin America, Asia Pacific, and North America. Because of our global reach, we have been able to establish trusting bonds with our partners and clients in various nations, improving customer service and forging a more cohesive worldwide presence.

We use cookies to enhance your experience.

By clicking "Accept All", you consent to the use of all cookies.

Customize your preferences or read our Cookie Policy.