
.jpg&w=3840&q=100)
Market
Insights
Reports delivered globally, covering a wide range of industries and sectors.
Clients who trust our expertise and rely on our insights for business decisions.
Managed Reports, ensuring seamless updates and premium service.
Satisfied Customers, committed to delivering exceptional value and quality.
Radio Access Network Market Analysis 2025 and Forecasts 2033: Unveiling Growth Opportunities
Radio Access Network Market by Component (Communication Infrastructure, Service), by Connectivity Technology (2G, 3G, 4G/LTE, 5G), by Deployment Region (High-density Urban Area, Suburban and Rural Area), by North America (U.S., Canada), by Europe (UK, Germany, France, Italy, Spain, Netherlands, Russia), by APAC (China, India, Japan, Australia and New Zealand, South Korea, Southeast Asia), by LAMEA (Brazil, Mexico, Argentina, Colombia), by MEA (South Africa, Saudi Arabia, Israel, UAE) Forecast 2025-2033
Radio Access Network Market Analysis 2025 and Forecasts 2033: Unveiling Growth Opportunities
Key Insights
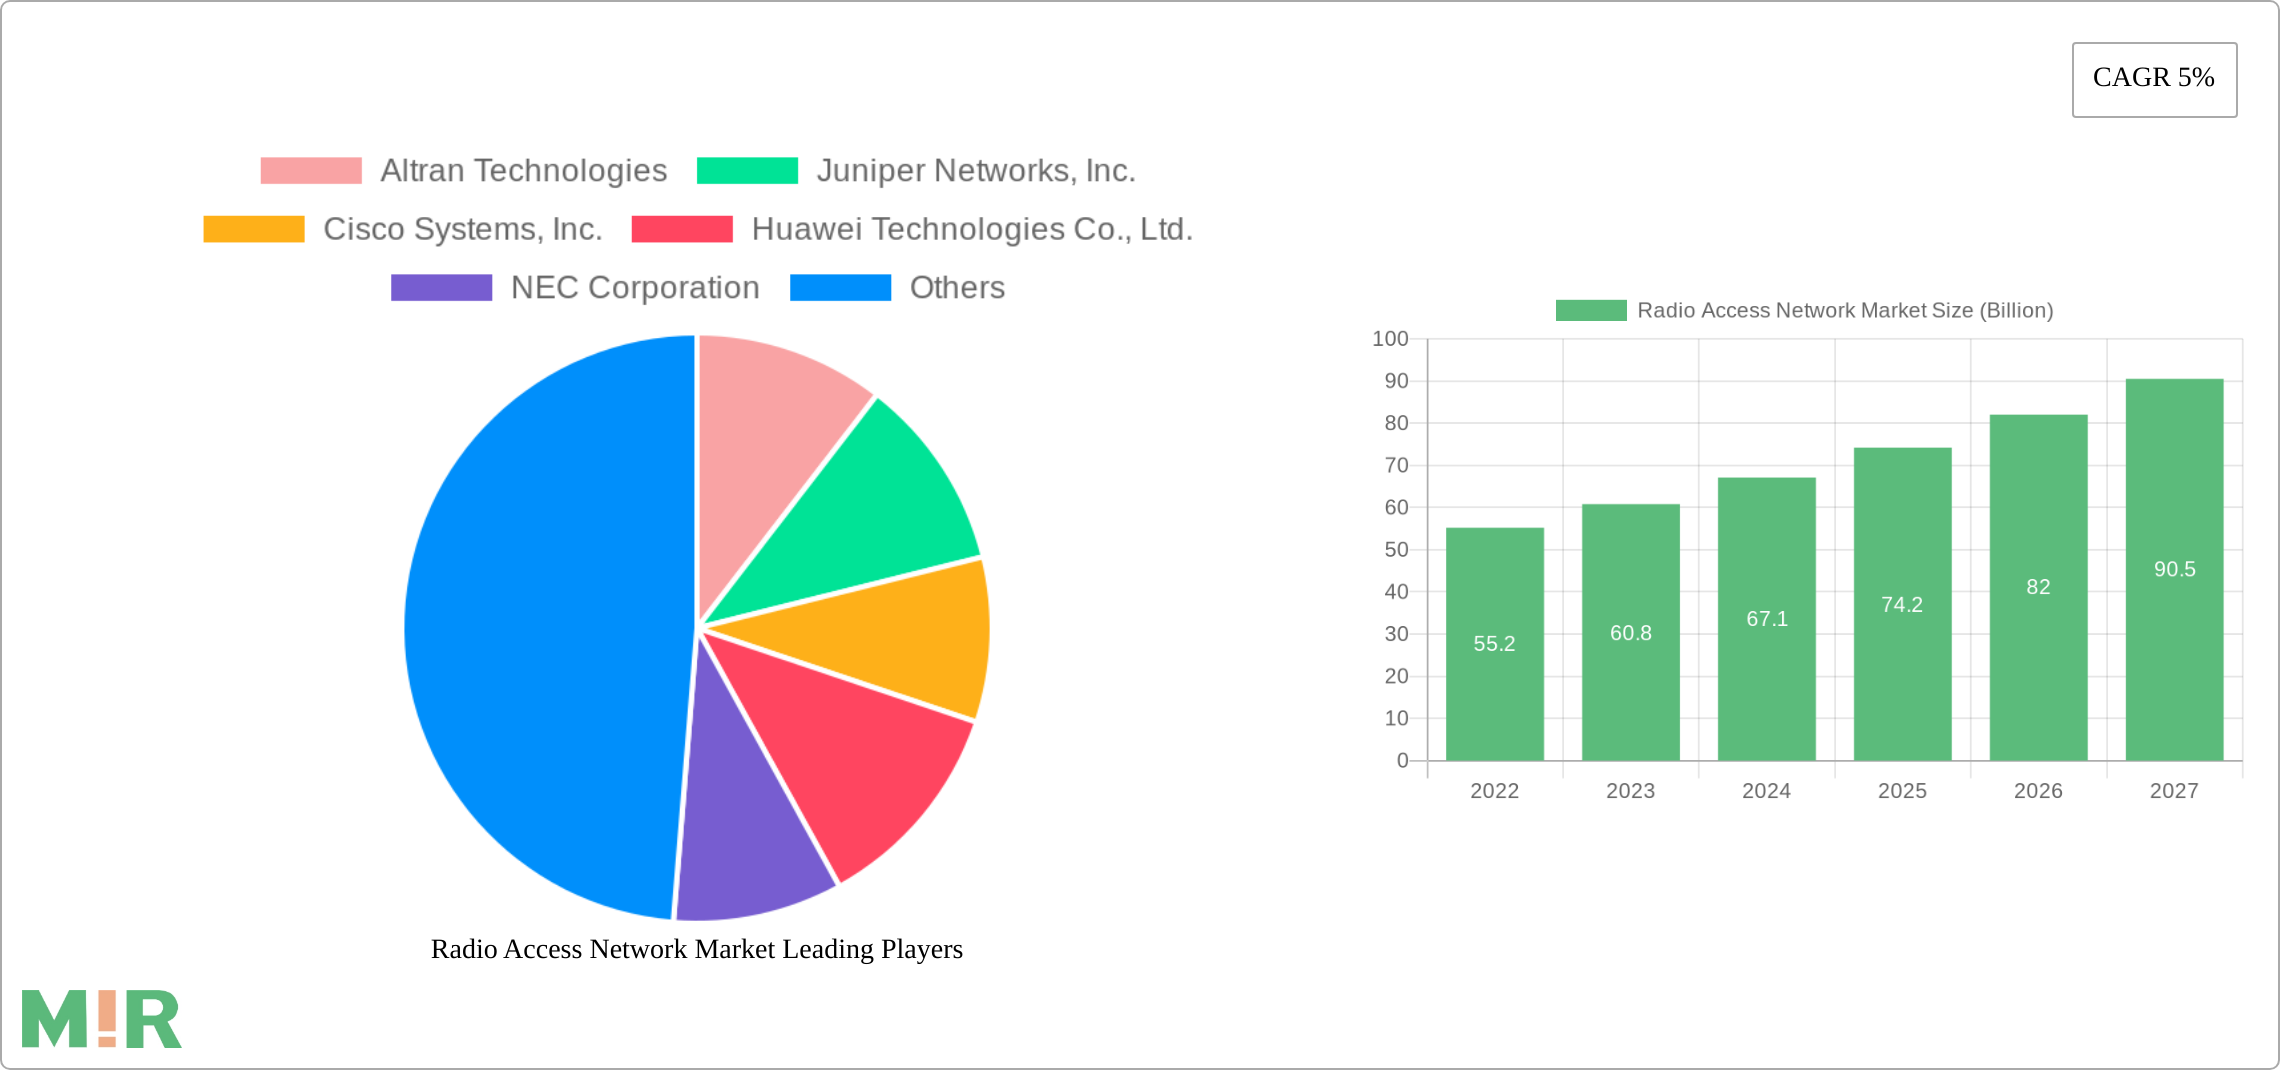
The Radio Access Network (RAN) market is a dynamic and rapidly expanding sector, currently valued at approximately $10 billion and projected to experience robust growth with a Compound Annual Growth Rate (CAGR) of 5%. This expansion is fueled by several converging factors. The proliferation of mobile devices and the escalating demand for high-speed data, driven by increasing internet usage and the adoption of data-intensive applications, are primary catalysts. Furthermore, the ongoing rollout of 5G networks globally is significantly boosting market growth, as operators invest heavily in upgrading their infrastructure to meet the increased capacity and speed requirements of this next-generation technology. The growing adoption of cloud-based RAN solutions, enabling greater scalability, efficiency, and cost optimization, also contributes to this expansion. Finally, the expanding Internet of Things (IoT) ecosystem, with its vast array of connected devices, further fuels the demand for advanced RAN infrastructure. This comprehensive report delves into the various facets of this thriving market, providing in-depth analysis of key trends, regional dynamics, and the competitive landscape.
Radio Access Network Market Concentration & Characteristics
The RAN market exhibits a moderately concentrated structure, with a few major players holding significant market share. However, the landscape is becoming increasingly competitive, with the emergence of smaller, specialized vendors focusing on niche technologies and solutions. Innovation within the RAN market is driven by advancements in software-defined networking (SDN), network function virtualization (NFV), and artificial intelligence (AI), leading to greater network flexibility, automation, and intelligence. Regulatory frameworks, particularly those related to spectrum allocation and network security, significantly influence market dynamics. The presence of alternative connectivity technologies, such as Wi-Fi and satellite communication, presents some level of substitution, though RAN remains the dominant technology for mobile broadband access. End-user concentration varies significantly across regions and deployment scenarios, with larger telecommunication companies wielding significant influence in procurement decisions. Mergers and acquisitions (M&A) activity in the RAN space is moderate, with strategic acquisitions focused on enhancing technological capabilities and expanding market reach. This dynamic interplay between technological innovation, regulatory pressures, and competitive dynamics shapes the evolution of the RAN market.
Radio Access Network Market Trends
The RAN market is characterized by several significant trends shaping its future trajectory. The ongoing global rollout of 5G networks is a dominant force, driving substantial investment in new infrastructure and spurring innovation in areas such as massive MIMO (multiple-input and multiple-output) antennas and advanced spectrum sharing techniques. The increasing adoption of open RAN architectures is gaining momentum, aiming to increase vendor diversity, reduce costs, and enhance network flexibility. Cloud-native RAN solutions are also gaining traction, offering scalable and efficient deployments. Furthermore, the integration of AI and machine learning (ML) is enhancing network optimization, automation, and predictive maintenance. The growing need for enhanced network security and resilience, particularly in the face of increasing cyber threats, is another key driver. Finally, the demand for edge computing is rising, pushing the deployment of RAN architectures closer to end-users to reduce latency and improve performance. These trends are collectively shaping a more efficient, intelligent, and secure RAN ecosystem.

Key Region or Country & Segment to Dominate the Market
- 5G Connectivity Technology: The 5G segment is poised for significant growth and market dominance due to the global rollout of 5G networks and the associated need for advanced RAN infrastructure. This is driven by the demand for higher bandwidth, lower latency, and increased network capacity to support emerging technologies and applications. The investments from telecommunication operators across the globe in deploying 5G networks are substantial, making 5G a key driver of RAN market expansion.
- High-density Urban Areas: High-density urban areas represent a key deployment region due to the high concentration of mobile users and the consequent demand for enhanced network capacity and coverage. The challenges of providing seamless connectivity in densely populated areas make the deployment of advanced RAN technologies essential, and this drives investment and market expansion in this segment.
- North America and APAC: North America, particularly the United States, and the Asia-Pacific (APAC) region, including China, India, and Japan, are anticipated to dominate the market in terms of revenue generation. The significant investments in 5G infrastructure, strong technological advancements, and the large user base in these regions contribute to their market leadership.
Radio Access Network Market Product Insights Report Coverage & Deliverables
This report provides a comprehensive analysis of the RAN market, covering key market trends, regional dynamics, competitive landscape, and future outlook. It includes detailed market sizing and forecasting, segmentation analysis across various parameters, and in-depth profiles of key market players. The deliverables encompass both quantitative and qualitative data, offering valuable insights for stakeholders involved in the RAN ecosystem.
Radio Access Network Market Analysis
The RAN market size, as previously stated, is currently estimated at $10 billion. This market exhibits a significant market share concentration among a few major players, although this is gradually changing with the entry of new players and technological advancements enabling smaller companies to compete. The market is witnessing substantial growth due to the factors mentioned previously. The overall growth trajectory is expected to remain positive, influenced by the continuous adoption of 5G, advancements in RAN technologies, and the increasing demand for high-bandwidth connectivity. Specific market share breakdowns for individual companies are not readily available publicly but the report would contain this crucial information upon completion of the analysis.
Radio Access Network Market Regional Insights
- North America:
- U.S.
- Canada
- Europe:
- UK
- Germany
- France
- Italy
- Spain
- Netherlands
- Russia
- APAC:
- China
- India
- Japan
- Australia and New Zealand
- South Korea
- Southeast Asia
- LAMEA:
- Brazil
- Mexico
- Argentina
- Colombia
- MEA:
- South Africa
- Saudi Arabia
- Israel
- UAE
Each region will have its own unique characteristics influencing RAN market growth. Factors like regulatory environments, levels of 5G adoption, and the density of mobile users will contribute to the varying market sizes and growth rates within each area.
Driving Forces: What's Propelling the Radio Access Network Market
The market's growth is primarily propelled by the increasing demand for high-speed mobile broadband, the global rollout of 5G networks, and the adoption of cloud-native RAN solutions, offering enhanced efficiency and scalability. Additionally, the expanding IoT ecosystem and the need for enhanced network security are vital factors driving market expansion.
Challenges and Restraints in Radio Access Network Market
Challenges include the high initial investment costs associated with deploying advanced RAN technologies, the complexity of integrating new technologies into existing infrastructure, and the need for skilled professionals to manage and maintain these systems. Regulatory hurdles and security concerns also represent significant challenges.
Emerging Trends in Radio Access Network Market
Key emerging trends include the increased adoption of open RAN architectures, the integration of AI and ML for network optimization, and the growing demand for edge computing capabilities. These trends are reshaping the RAN landscape.
Radio Access Network Industry News
- January 2024: Nokia announces a major 5G RAN deal with a leading telecommunications provider in Asia.
- March 2024: Ericsson releases a new software platform designed to enhance the efficiency and performance of 5G RAN networks.
- June 2024: A new partnership between several vendors aims to accelerate the adoption of open RAN technologies. (Specific details omitted for brevity)
Leading Players in the Radio Access Network Market
- Altran Technologies
- Juniper Networks, Inc.
- Cisco Systems, Inc.
- Huawei Technologies Co., Ltd.
- NEC Corporation
- Verizon Communications, Inc.
- HP Enterprises
- Qualcomm Technologies, Inc.
- Telefonaktiebolaget LM Ericsson
- Nokia Networks
- ZTE Corporation
- Samsung Electronics Co., Ltd.
- NetScout
- Wipro Limited
- AT&T Inc.
- Fujitsu
- Intel Corporation
Radio Access Network Market Segmentation
- 1. Component
- 1.1. Communication Infrastructure
- 1.2. Service
- 2. Connectivity Technology
- 2.1. 2G
- 2.2. 3G
- 2.3. 4G/LTE
- 2.4. 5G
- 3. Deployment Region
- 3.1. High-density Urban Area
- 3.2. Suburban and Rural Area
Radio Access Network Market Segmentation By Geography
- 1. North America
- 1.1. U.S.
- 1.2. Canada
- 2. Europe
- 2.1. UK
- 2.2. Germany
- 2.3. France
- 2.4. Italy
- 2.5. Spain
- 2.6. Netherlands
- 2.7. Russia
- 3. APAC
- 3.1. China
- 3.2. India
- 3.3. Japan
- 3.4. Australia and New Zealand
- 3.5. South Korea
- 3.6. Southeast Asia
- 4. LAMEA
- 4.1. Brazil
- 4.2. Mexico
- 4.3. Argentina
- 4.4. Colombia
- 5. MEA
- 5.1. South Africa
- 5.2. Saudi Arabia
- 5.3. Israel
- 5.4. UAE

Radio Access Network Market REPORT HIGHLIGHTS
| Aspects | Details |
|---|---|
| Study Period | 2019-2033 |
| Base Year | 2024 |
| Estimated Year | 2025 |
| Forecast Period | 2025-2033 |
| Historical Period | 2019-2024 |
| Growth Rate | CAGR of 5% from 2019-2033 |
| Segmentation |
|
- 1. Introduction
- 1.1. Research Scope
- 1.2. Market Segmentation
- 1.3. Research Methodology
- 1.4. Definitions and Assumptions
- 2. Executive Summary
- 2.1. Introduction
- 3. Market Dynamics
- 3.1. Introduction
- 3.2. Market Drivers
- 3.2.1 Increasing smartphone penetration
- 3.2.2 Adoption of Network Function Virtualization (NFV) and Software Defined Networking (SDN) technologies
- 3.2.3 5G commercialization
- 3.2.4 Demand for improved network coverage
- 3.2.5 Favorable government initiatives
- 3.3. Market Restrains
- 3.3.1 Lack of standardization in spectrum allocation
- 3.3.2 Interference in cell sites
- 3.3.3 Security related issues
- 3.4. Market Trends
- 4. Market Factor Analysis
- 4.1. Porters Five Forces
- 4.2. Supply/Value Chain
- 4.3. PESTEL analysis
- 4.4. Market Entropy
- 4.5. Patent/Trademark Analysis
- 5. Global Radio Access Network Market Analysis, Insights and Forecast, 2019-2031
- 5.1. Market Analysis, Insights and Forecast - by Component
- 5.1.1. Communication Infrastructure
- 5.1.2. Service
- 5.2. Market Analysis, Insights and Forecast - by Connectivity Technology
- 5.2.1. 2G
- 5.2.2. 3G
- 5.2.3. 4G/LTE
- 5.2.4. 5G
- 5.3. Market Analysis, Insights and Forecast - by Deployment Region
- 5.3.1. High-density Urban Area
- 5.3.2. Suburban and Rural Area
- 5.4. Market Analysis, Insights and Forecast - by Region
- 5.4.1. North America
- 5.4.2. Europe
- 5.4.3. APAC
- 5.4.4. LAMEA
- 5.4.5. MEA
- 5.1. Market Analysis, Insights and Forecast - by Component
- 6. North America Radio Access Network Market Analysis, Insights and Forecast, 2019-2031
- 6.1. Market Analysis, Insights and Forecast - by Component
- 6.1.1. Communication Infrastructure
- 6.1.2. Service
- 6.2. Market Analysis, Insights and Forecast - by Connectivity Technology
- 6.2.1. 2G
- 6.2.2. 3G
- 6.2.3. 4G/LTE
- 6.2.4. 5G
- 6.3. Market Analysis, Insights and Forecast - by Deployment Region
- 6.3.1. High-density Urban Area
- 6.3.2. Suburban and Rural Area
- 6.1. Market Analysis, Insights and Forecast - by Component
- 7. Europe Radio Access Network Market Analysis, Insights and Forecast, 2019-2031
- 7.1. Market Analysis, Insights and Forecast - by Component
- 7.1.1. Communication Infrastructure
- 7.1.2. Service
- 7.2. Market Analysis, Insights and Forecast - by Connectivity Technology
- 7.2.1. 2G
- 7.2.2. 3G
- 7.2.3. 4G/LTE
- 7.2.4. 5G
- 7.3. Market Analysis, Insights and Forecast - by Deployment Region
- 7.3.1. High-density Urban Area
- 7.3.2. Suburban and Rural Area
- 7.1. Market Analysis, Insights and Forecast - by Component
- 8. APAC Radio Access Network Market Analysis, Insights and Forecast, 2019-2031
- 8.1. Market Analysis, Insights and Forecast - by Component
- 8.1.1. Communication Infrastructure
- 8.1.2. Service
- 8.2. Market Analysis, Insights and Forecast - by Connectivity Technology
- 8.2.1. 2G
- 8.2.2. 3G
- 8.2.3. 4G/LTE
- 8.2.4. 5G
- 8.3. Market Analysis, Insights and Forecast - by Deployment Region
- 8.3.1. High-density Urban Area
- 8.3.2. Suburban and Rural Area
- 8.1. Market Analysis, Insights and Forecast - by Component
- 9. LAMEA Radio Access Network Market Analysis, Insights and Forecast, 2019-2031
- 9.1. Market Analysis, Insights and Forecast - by Component
- 9.1.1. Communication Infrastructure
- 9.1.2. Service
- 9.2. Market Analysis, Insights and Forecast - by Connectivity Technology
- 9.2.1. 2G
- 9.2.2. 3G
- 9.2.3. 4G/LTE
- 9.2.4. 5G
- 9.3. Market Analysis, Insights and Forecast - by Deployment Region
- 9.3.1. High-density Urban Area
- 9.3.2. Suburban and Rural Area
- 9.1. Market Analysis, Insights and Forecast - by Component
- 10. MEA Radio Access Network Market Analysis, Insights and Forecast, 2019-2031
- 10.1. Market Analysis, Insights and Forecast - by Component
- 10.1.1. Communication Infrastructure
- 10.1.2. Service
- 10.2. Market Analysis, Insights and Forecast - by Connectivity Technology
- 10.2.1. 2G
- 10.2.2. 3G
- 10.2.3. 4G/LTE
- 10.2.4. 5G
- 10.3. Market Analysis, Insights and Forecast - by Deployment Region
- 10.3.1. High-density Urban Area
- 10.3.2. Suburban and Rural Area
- 10.1. Market Analysis, Insights and Forecast - by Component
- 11. Competitive Analysis
- 11.1. Global Market Share Analysis 2024
- 11.2. Company Profiles
- 11.2.1 Altran Technologies
- 11.2.1.1. Overview
- 11.2.1.2. Products
- 11.2.1.3. SWOT Analysis
- 11.2.1.4. Recent Developments
- 11.2.1.5. Financials (Based on Availability)
- 11.2.2 Juniper Networks Inc.
- 11.2.2.1. Overview
- 11.2.2.2. Products
- 11.2.2.3. SWOT Analysis
- 11.2.2.4. Recent Developments
- 11.2.2.5. Financials (Based on Availability)
- 11.2.3 Cisco Systems Inc.
- 11.2.3.1. Overview
- 11.2.3.2. Products
- 11.2.3.3. SWOT Analysis
- 11.2.3.4. Recent Developments
- 11.2.3.5. Financials (Based on Availability)
- 11.2.4 Huawei Technologies Co. Ltd.
- 11.2.4.1. Overview
- 11.2.4.2. Products
- 11.2.4.3. SWOT Analysis
- 11.2.4.4. Recent Developments
- 11.2.4.5. Financials (Based on Availability)
- 11.2.5 NEC Corporation
- 11.2.5.1. Overview
- 11.2.5.2. Products
- 11.2.5.3. SWOT Analysis
- 11.2.5.4. Recent Developments
- 11.2.5.5. Financials (Based on Availability)
- 11.2.6 Verizon Communications Inc.
- 11.2.6.1. Overview
- 11.2.6.2. Products
- 11.2.6.3. SWOT Analysis
- 11.2.6.4. Recent Developments
- 11.2.6.5. Financials (Based on Availability)
- 11.2.7 HP Enterprises
- 11.2.7.1. Overview
- 11.2.7.2. Products
- 11.2.7.3. SWOT Analysis
- 11.2.7.4. Recent Developments
- 11.2.7.5. Financials (Based on Availability)
- 11.2.8 Qualcomm Technologies Inc.
- 11.2.8.1. Overview
- 11.2.8.2. Products
- 11.2.8.3. SWOT Analysis
- 11.2.8.4. Recent Developments
- 11.2.8.5. Financials (Based on Availability)
- 11.2.9 Telefonaktiebolaget LM Ericsson
- 11.2.9.1. Overview
- 11.2.9.2. Products
- 11.2.9.3. SWOT Analysis
- 11.2.9.4. Recent Developments
- 11.2.9.5. Financials (Based on Availability)
- 11.2.10 Nokia Networks
- 11.2.10.1. Overview
- 11.2.10.2. Products
- 11.2.10.3. SWOT Analysis
- 11.2.10.4. Recent Developments
- 11.2.10.5. Financials (Based on Availability)
- 11.2.11 ZTE Corporation
- 11.2.11.1. Overview
- 11.2.11.2. Products
- 11.2.11.3. SWOT Analysis
- 11.2.11.4. Recent Developments
- 11.2.11.5. Financials (Based on Availability)
- 11.2.12 Samsung Electronics Co. Ltd.
- 11.2.12.1. Overview
- 11.2.12.2. Products
- 11.2.12.3. SWOT Analysis
- 11.2.12.4. Recent Developments
- 11.2.12.5. Financials (Based on Availability)
- 11.2.13 NetScout
- 11.2.13.1. Overview
- 11.2.13.2. Products
- 11.2.13.3. SWOT Analysis
- 11.2.13.4. Recent Developments
- 11.2.13.5. Financials (Based on Availability)
- 11.2.14 Wipro Limited
- 11.2.14.1. Overview
- 11.2.14.2. Products
- 11.2.14.3. SWOT Analysis
- 11.2.14.4. Recent Developments
- 11.2.14.5. Financials (Based on Availability)
- 11.2.15 Radisys Corporation (Reliance Jio)
- 11.2.15.1. Overview
- 11.2.15.2. Products
- 11.2.15.3. SWOT Analysis
- 11.2.15.4. Recent Developments
- 11.2.15.5. Financials (Based on Availability)
- 11.2.16 AT&T Inc.
- 11.2.16.1. Overview
- 11.2.16.2. Products
- 11.2.16.3. SWOT Analysis
- 11.2.16.4. Recent Developments
- 11.2.16.5. Financials (Based on Availability)
- 11.2.17 Corning Incorporated (SpiderCloud Wireless Inc)
- 11.2.17.1. Overview
- 11.2.17.2. Products
- 11.2.17.3. SWOT Analysis
- 11.2.17.4. Recent Developments
- 11.2.17.5. Financials (Based on Availability)
- 11.2.18 CommScope Holding Company Inc.
- 11.2.18.1. Overview
- 11.2.18.2. Products
- 11.2.18.3. SWOT Analysis
- 11.2.18.4. Recent Developments
- 11.2.18.5. Financials (Based on Availability)
- 11.2.19 Altiostar Networks Inc.
- 11.2.19.1. Overview
- 11.2.19.2. Products
- 11.2.19.3. SWOT Analysis
- 11.2.19.4. Recent Developments
- 11.2.19.5. Financials (Based on Availability)
- 11.2.20 Fujitsu
- 11.2.20.1. Overview
- 11.2.20.2. Products
- 11.2.20.3. SWOT Analysis
- 11.2.20.4. Recent Developments
- 11.2.20.5. Financials (Based on Availability)
- 11.2.21 Intel Corporation
- 11.2.21.1. Overview
- 11.2.21.2. Products
- 11.2.21.3. SWOT Analysis
- 11.2.21.4. Recent Developments
- 11.2.21.5. Financials (Based on Availability)
- 11.2.1 Altran Technologies
- Figure 1: Global Radio Access Network Market Revenue Breakdown (Billion, %) by Region 2024 & 2032
- Figure 2: Global Radio Access Network Market Volume Breakdown (K Units, %) by Region 2024 & 2032
- Figure 3: North America Radio Access Network Market Revenue (Billion), by Component 2024 & 2032
- Figure 4: North America Radio Access Network Market Volume (K Units), by Component 2024 & 2032
- Figure 5: North America Radio Access Network Market Revenue Share (%), by Component 2024 & 2032
- Figure 6: North America Radio Access Network Market Volume Share (%), by Component 2024 & 2032
- Figure 7: North America Radio Access Network Market Revenue (Billion), by Connectivity Technology 2024 & 2032
- Figure 8: North America Radio Access Network Market Volume (K Units), by Connectivity Technology 2024 & 2032
- Figure 9: North America Radio Access Network Market Revenue Share (%), by Connectivity Technology 2024 & 2032
- Figure 10: North America Radio Access Network Market Volume Share (%), by Connectivity Technology 2024 & 2032
- Figure 11: North America Radio Access Network Market Revenue (Billion), by Deployment Region 2024 & 2032
- Figure 12: North America Radio Access Network Market Volume (K Units), by Deployment Region 2024 & 2032
- Figure 13: North America Radio Access Network Market Revenue Share (%), by Deployment Region 2024 & 2032
- Figure 14: North America Radio Access Network Market Volume Share (%), by Deployment Region 2024 & 2032
- Figure 15: North America Radio Access Network Market Revenue (Billion), by Country 2024 & 2032
- Figure 16: North America Radio Access Network Market Volume (K Units), by Country 2024 & 2032
- Figure 17: North America Radio Access Network Market Revenue Share (%), by Country 2024 & 2032
- Figure 18: North America Radio Access Network Market Volume Share (%), by Country 2024 & 2032
- Figure 19: Europe Radio Access Network Market Revenue (Billion), by Component 2024 & 2032
- Figure 20: Europe Radio Access Network Market Volume (K Units), by Component 2024 & 2032
- Figure 21: Europe Radio Access Network Market Revenue Share (%), by Component 2024 & 2032
- Figure 22: Europe Radio Access Network Market Volume Share (%), by Component 2024 & 2032
- Figure 23: Europe Radio Access Network Market Revenue (Billion), by Connectivity Technology 2024 & 2032
- Figure 24: Europe Radio Access Network Market Volume (K Units), by Connectivity Technology 2024 & 2032
- Figure 25: Europe Radio Access Network Market Revenue Share (%), by Connectivity Technology 2024 & 2032
- Figure 26: Europe Radio Access Network Market Volume Share (%), by Connectivity Technology 2024 & 2032
- Figure 27: Europe Radio Access Network Market Revenue (Billion), by Deployment Region 2024 & 2032
- Figure 28: Europe Radio Access Network Market Volume (K Units), by Deployment Region 2024 & 2032
- Figure 29: Europe Radio Access Network Market Revenue Share (%), by Deployment Region 2024 & 2032
- Figure 30: Europe Radio Access Network Market Volume Share (%), by Deployment Region 2024 & 2032
- Figure 31: Europe Radio Access Network Market Revenue (Billion), by Country 2024 & 2032
- Figure 32: Europe Radio Access Network Market Volume (K Units), by Country 2024 & 2032
- Figure 33: Europe Radio Access Network Market Revenue Share (%), by Country 2024 & 2032
- Figure 34: Europe Radio Access Network Market Volume Share (%), by Country 2024 & 2032
- Figure 35: APAC Radio Access Network Market Revenue (Billion), by Component 2024 & 2032
- Figure 36: APAC Radio Access Network Market Volume (K Units), by Component 2024 & 2032
- Figure 37: APAC Radio Access Network Market Revenue Share (%), by Component 2024 & 2032
- Figure 38: APAC Radio Access Network Market Volume Share (%), by Component 2024 & 2032
- Figure 39: APAC Radio Access Network Market Revenue (Billion), by Connectivity Technology 2024 & 2032
- Figure 40: APAC Radio Access Network Market Volume (K Units), by Connectivity Technology 2024 & 2032
- Figure 41: APAC Radio Access Network Market Revenue Share (%), by Connectivity Technology 2024 & 2032
- Figure 42: APAC Radio Access Network Market Volume Share (%), by Connectivity Technology 2024 & 2032
- Figure 43: APAC Radio Access Network Market Revenue (Billion), by Deployment Region 2024 & 2032
- Figure 44: APAC Radio Access Network Market Volume (K Units), by Deployment Region 2024 & 2032
- Figure 45: APAC Radio Access Network Market Revenue Share (%), by Deployment Region 2024 & 2032
- Figure 46: APAC Radio Access Network Market Volume Share (%), by Deployment Region 2024 & 2032
- Figure 47: APAC Radio Access Network Market Revenue (Billion), by Country 2024 & 2032
- Figure 48: APAC Radio Access Network Market Volume (K Units), by Country 2024 & 2032
- Figure 49: APAC Radio Access Network Market Revenue Share (%), by Country 2024 & 2032
- Figure 50: APAC Radio Access Network Market Volume Share (%), by Country 2024 & 2032
- Figure 51: LAMEA Radio Access Network Market Revenue (Billion), by Component 2024 & 2032
- Figure 52: LAMEA Radio Access Network Market Volume (K Units), by Component 2024 & 2032
- Figure 53: LAMEA Radio Access Network Market Revenue Share (%), by Component 2024 & 2032
- Figure 54: LAMEA Radio Access Network Market Volume Share (%), by Component 2024 & 2032
- Figure 55: LAMEA Radio Access Network Market Revenue (Billion), by Connectivity Technology 2024 & 2032
- Figure 56: LAMEA Radio Access Network Market Volume (K Units), by Connectivity Technology 2024 & 2032
- Figure 57: LAMEA Radio Access Network Market Revenue Share (%), by Connectivity Technology 2024 & 2032
- Figure 58: LAMEA Radio Access Network Market Volume Share (%), by Connectivity Technology 2024 & 2032
- Figure 59: LAMEA Radio Access Network Market Revenue (Billion), by Deployment Region 2024 & 2032
- Figure 60: LAMEA Radio Access Network Market Volume (K Units), by Deployment Region 2024 & 2032
- Figure 61: LAMEA Radio Access Network Market Revenue Share (%), by Deployment Region 2024 & 2032
- Figure 62: LAMEA Radio Access Network Market Volume Share (%), by Deployment Region 2024 & 2032
- Figure 63: LAMEA Radio Access Network Market Revenue (Billion), by Country 2024 & 2032
- Figure 64: LAMEA Radio Access Network Market Volume (K Units), by Country 2024 & 2032
- Figure 65: LAMEA Radio Access Network Market Revenue Share (%), by Country 2024 & 2032
- Figure 66: LAMEA Radio Access Network Market Volume Share (%), by Country 2024 & 2032
- Figure 67: MEA Radio Access Network Market Revenue (Billion), by Component 2024 & 2032
- Figure 68: MEA Radio Access Network Market Volume (K Units), by Component 2024 & 2032
- Figure 69: MEA Radio Access Network Market Revenue Share (%), by Component 2024 & 2032
- Figure 70: MEA Radio Access Network Market Volume Share (%), by Component 2024 & 2032
- Figure 71: MEA Radio Access Network Market Revenue (Billion), by Connectivity Technology 2024 & 2032
- Figure 72: MEA Radio Access Network Market Volume (K Units), by Connectivity Technology 2024 & 2032
- Figure 73: MEA Radio Access Network Market Revenue Share (%), by Connectivity Technology 2024 & 2032
- Figure 74: MEA Radio Access Network Market Volume Share (%), by Connectivity Technology 2024 & 2032
- Figure 75: MEA Radio Access Network Market Revenue (Billion), by Deployment Region 2024 & 2032
- Figure 76: MEA Radio Access Network Market Volume (K Units), by Deployment Region 2024 & 2032
- Figure 77: MEA Radio Access Network Market Revenue Share (%), by Deployment Region 2024 & 2032
- Figure 78: MEA Radio Access Network Market Volume Share (%), by Deployment Region 2024 & 2032
- Figure 79: MEA Radio Access Network Market Revenue (Billion), by Country 2024 & 2032
- Figure 80: MEA Radio Access Network Market Volume (K Units), by Country 2024 & 2032
- Figure 81: MEA Radio Access Network Market Revenue Share (%), by Country 2024 & 2032
- Figure 82: MEA Radio Access Network Market Volume Share (%), by Country 2024 & 2032
- Table 1: Global Radio Access Network Market Revenue Billion Forecast, by Region 2019 & 2032
- Table 2: Global Radio Access Network Market Volume K Units Forecast, by Region 2019 & 2032
- Table 3: Global Radio Access Network Market Revenue Billion Forecast, by Component 2019 & 2032
- Table 4: Global Radio Access Network Market Volume K Units Forecast, by Component 2019 & 2032
- Table 5: Global Radio Access Network Market Revenue Billion Forecast, by Connectivity Technology 2019 & 2032
- Table 6: Global Radio Access Network Market Volume K Units Forecast, by Connectivity Technology 2019 & 2032
- Table 7: Global Radio Access Network Market Revenue Billion Forecast, by Deployment Region 2019 & 2032
- Table 8: Global Radio Access Network Market Volume K Units Forecast, by Deployment Region 2019 & 2032
- Table 9: Global Radio Access Network Market Revenue Billion Forecast, by Region 2019 & 2032
- Table 10: Global Radio Access Network Market Volume K Units Forecast, by Region 2019 & 2032
- Table 11: Global Radio Access Network Market Revenue Billion Forecast, by Component 2019 & 2032
- Table 12: Global Radio Access Network Market Volume K Units Forecast, by Component 2019 & 2032
- Table 13: Global Radio Access Network Market Revenue Billion Forecast, by Connectivity Technology 2019 & 2032
- Table 14: Global Radio Access Network Market Volume K Units Forecast, by Connectivity Technology 2019 & 2032
- Table 15: Global Radio Access Network Market Revenue Billion Forecast, by Deployment Region 2019 & 2032
- Table 16: Global Radio Access Network Market Volume K Units Forecast, by Deployment Region 2019 & 2032
- Table 17: Global Radio Access Network Market Revenue Billion Forecast, by Country 2019 & 2032
- Table 18: Global Radio Access Network Market Volume K Units Forecast, by Country 2019 & 2032
- Table 19: U.S. Radio Access Network Market Revenue (Billion) Forecast, by Application 2019 & 2032
- Table 20: U.S. Radio Access Network Market Volume (K Units) Forecast, by Application 2019 & 2032
- Table 21: Canada Radio Access Network Market Revenue (Billion) Forecast, by Application 2019 & 2032
- Table 22: Canada Radio Access Network Market Volume (K Units) Forecast, by Application 2019 & 2032
- Table 23: Global Radio Access Network Market Revenue Billion Forecast, by Component 2019 & 2032
- Table 24: Global Radio Access Network Market Volume K Units Forecast, by Component 2019 & 2032
- Table 25: Global Radio Access Network Market Revenue Billion Forecast, by Connectivity Technology 2019 & 2032
- Table 26: Global Radio Access Network Market Volume K Units Forecast, by Connectivity Technology 2019 & 2032
- Table 27: Global Radio Access Network Market Revenue Billion Forecast, by Deployment Region 2019 & 2032
- Table 28: Global Radio Access Network Market Volume K Units Forecast, by Deployment Region 2019 & 2032
- Table 29: Global Radio Access Network Market Revenue Billion Forecast, by Country 2019 & 2032
- Table 30: Global Radio Access Network Market Volume K Units Forecast, by Country 2019 & 2032
- Table 31: UK Radio Access Network Market Revenue (Billion) Forecast, by Application 2019 & 2032
- Table 32: UK Radio Access Network Market Volume (K Units) Forecast, by Application 2019 & 2032
- Table 33: Germany Radio Access Network Market Revenue (Billion) Forecast, by Application 2019 & 2032
- Table 34: Germany Radio Access Network Market Volume (K Units) Forecast, by Application 2019 & 2032
- Table 35: France Radio Access Network Market Revenue (Billion) Forecast, by Application 2019 & 2032
- Table 36: France Radio Access Network Market Volume (K Units) Forecast, by Application 2019 & 2032
- Table 37: Italy Radio Access Network Market Revenue (Billion) Forecast, by Application 2019 & 2032
- Table 38: Italy Radio Access Network Market Volume (K Units) Forecast, by Application 2019 & 2032
- Table 39: Spain Radio Access Network Market Revenue (Billion) Forecast, by Application 2019 & 2032
- Table 40: Spain Radio Access Network Market Volume (K Units) Forecast, by Application 2019 & 2032
- Table 41: Netherlands Radio Access Network Market Revenue (Billion) Forecast, by Application 2019 & 2032
- Table 42: Netherlands Radio Access Network Market Volume (K Units) Forecast, by Application 2019 & 2032
- Table 43: Russia Radio Access Network Market Revenue (Billion) Forecast, by Application 2019 & 2032
- Table 44: Russia Radio Access Network Market Volume (K Units) Forecast, by Application 2019 & 2032
- Table 45: Global Radio Access Network Market Revenue Billion Forecast, by Component 2019 & 2032
- Table 46: Global Radio Access Network Market Volume K Units Forecast, by Component 2019 & 2032
- Table 47: Global Radio Access Network Market Revenue Billion Forecast, by Connectivity Technology 2019 & 2032
- Table 48: Global Radio Access Network Market Volume K Units Forecast, by Connectivity Technology 2019 & 2032
- Table 49: Global Radio Access Network Market Revenue Billion Forecast, by Deployment Region 2019 & 2032
- Table 50: Global Radio Access Network Market Volume K Units Forecast, by Deployment Region 2019 & 2032
- Table 51: Global Radio Access Network Market Revenue Billion Forecast, by Country 2019 & 2032
- Table 52: Global Radio Access Network Market Volume K Units Forecast, by Country 2019 & 2032
- Table 53: China Radio Access Network Market Revenue (Billion) Forecast, by Application 2019 & 2032
- Table 54: China Radio Access Network Market Volume (K Units) Forecast, by Application 2019 & 2032
- Table 55: India Radio Access Network Market Revenue (Billion) Forecast, by Application 2019 & 2032
- Table 56: India Radio Access Network Market Volume (K Units) Forecast, by Application 2019 & 2032
- Table 57: Japan Radio Access Network Market Revenue (Billion) Forecast, by Application 2019 & 2032
- Table 58: Japan Radio Access Network Market Volume (K Units) Forecast, by Application 2019 & 2032
- Table 59: Australia and New Zealand Radio Access Network Market Revenue (Billion) Forecast, by Application 2019 & 2032
- Table 60: Australia and New Zealand Radio Access Network Market Volume (K Units) Forecast, by Application 2019 & 2032
- Table 61: South Korea Radio Access Network Market Revenue (Billion) Forecast, by Application 2019 & 2032
- Table 62: South Korea Radio Access Network Market Volume (K Units) Forecast, by Application 2019 & 2032
- Table 63: Southeast Asia Radio Access Network Market Revenue (Billion) Forecast, by Application 2019 & 2032
- Table 64: Southeast Asia Radio Access Network Market Volume (K Units) Forecast, by Application 2019 & 2032
- Table 65: Global Radio Access Network Market Revenue Billion Forecast, by Component 2019 & 2032
- Table 66: Global Radio Access Network Market Volume K Units Forecast, by Component 2019 & 2032
- Table 67: Global Radio Access Network Market Revenue Billion Forecast, by Connectivity Technology 2019 & 2032
- Table 68: Global Radio Access Network Market Volume K Units Forecast, by Connectivity Technology 2019 & 2032
- Table 69: Global Radio Access Network Market Revenue Billion Forecast, by Deployment Region 2019 & 2032
- Table 70: Global Radio Access Network Market Volume K Units Forecast, by Deployment Region 2019 & 2032
- Table 71: Global Radio Access Network Market Revenue Billion Forecast, by Country 2019 & 2032
- Table 72: Global Radio Access Network Market Volume K Units Forecast, by Country 2019 & 2032
- Table 73: Brazil Radio Access Network Market Revenue (Billion) Forecast, by Application 2019 & 2032
- Table 74: Brazil Radio Access Network Market Volume (K Units) Forecast, by Application 2019 & 2032
- Table 75: Mexico Radio Access Network Market Revenue (Billion) Forecast, by Application 2019 & 2032
- Table 76: Mexico Radio Access Network Market Volume (K Units) Forecast, by Application 2019 & 2032
- Table 77: Argentina Radio Access Network Market Revenue (Billion) Forecast, by Application 2019 & 2032
- Table 78: Argentina Radio Access Network Market Volume (K Units) Forecast, by Application 2019 & 2032
- Table 79: Colombia Radio Access Network Market Revenue (Billion) Forecast, by Application 2019 & 2032
- Table 80: Colombia Radio Access Network Market Volume (K Units) Forecast, by Application 2019 & 2032
- Table 81: Global Radio Access Network Market Revenue Billion Forecast, by Component 2019 & 2032
- Table 82: Global Radio Access Network Market Volume K Units Forecast, by Component 2019 & 2032
- Table 83: Global Radio Access Network Market Revenue Billion Forecast, by Connectivity Technology 2019 & 2032
- Table 84: Global Radio Access Network Market Volume K Units Forecast, by Connectivity Technology 2019 & 2032
- Table 85: Global Radio Access Network Market Revenue Billion Forecast, by Deployment Region 2019 & 2032
- Table 86: Global Radio Access Network Market Volume K Units Forecast, by Deployment Region 2019 & 2032
- Table 87: Global Radio Access Network Market Revenue Billion Forecast, by Country 2019 & 2032
- Table 88: Global Radio Access Network Market Volume K Units Forecast, by Country 2019 & 2032
- Table 89: South Africa Radio Access Network Market Revenue (Billion) Forecast, by Application 2019 & 2032
- Table 90: South Africa Radio Access Network Market Volume (K Units) Forecast, by Application 2019 & 2032
- Table 91: Saudi Arabia Radio Access Network Market Revenue (Billion) Forecast, by Application 2019 & 2032
- Table 92: Saudi Arabia Radio Access Network Market Volume (K Units) Forecast, by Application 2019 & 2032
- Table 93: Israel Radio Access Network Market Revenue (Billion) Forecast, by Application 2019 & 2032
- Table 94: Israel Radio Access Network Market Volume (K Units) Forecast, by Application 2019 & 2032
- Table 95: UAE Radio Access Network Market Revenue (Billion) Forecast, by Application 2019 & 2032
- Table 96: UAE Radio Access Network Market Volume (K Units) Forecast, by Application 2019 & 2032
STEP 1 - Identification of Relevant Samples Size from Population Database


STEP 2 - Approaches for Defining Global Market Size (Value, Volume* & Price*)

Note* : In applicable scenarios
STEP 3 - Data Sources
Primary Research
- Web Analytics
- Survey Reports
- Research Institute
- Latest Research Reports
- Opinion Leaders
Secondary Research
- Annual Reports
- White Paper
- Latest Press Release
- Industry Association
- Paid Database
- Investor Presentations

STEP 4 - Data Triangulation
Involves using different sources of information in order to increase the validity of a study
These sources are likely to be stakeholders in a program - participants, other researchers, program staff, other community members, and so on.
Then we put all data in single framework & apply various statistical tools to find out the dynamic on the market.
During the analysis stage, feedback from the stakeholder groups would be compared to determine areas of agreement as well as areas of divergence
Frequently Asked Questions
Related Reports
See the similar reports


About Market Insights Report
Market Insights Reports offers comprehensive market research reports and analysis, giving businesses important information about their clients, rivals, and sector to help them make well-informed decisions on operations, marketing, and business strategy. We offer a variety of services in addition to market research, data analysis, and strategy planning. In order to find opportunities and learn more about our competitors and the industry at large, we employ competitive analysis. To identify areas for development, we also evaluate our performance against that of our rivals. We can determine the places at which we can offer our clients the most value by performing value chain analysis.
Additionally, clients receive a thorough overview of their industry business environment. We can find trends that help us forecast future possibilities and threats by examining global macroeconomic dynamics and consumer behavior patterns. By analyzing their features and advantages, contrasting them with comparable items on the market, and evaluating both their quantitative and qualitative performance, we comprehensively evaluate our clients' products. This allows us to assist customers in determining how their goods compare to those of their rivals and in creating successful marketing plans. Our group has been successful in gaining a thorough grasp of our clients' requirements and offering them creative solutions. We currently provide services to more than 50 nations in Europe, the Middle East, Africa, Latin America, Asia Pacific, and North America. Because of our global reach, we have been able to establish trusting bonds with our partners and clients in various nations, improving customer service and forging a more cohesive worldwide presence.