Report banner
RF Connectors Market
Updated On

Feb 18 2025

Total Pages

200

RF Connectors Market Growth Opportunities and Market Forecast 2025-2033: A Strategic Analysis

RF Connectors Market by Product Type (BNC connectors, SMA connectors, MCX/MMCX connectors, N-Type connectors, TNC connectors, F-Type connectors, UHF connectors, QMA connectors, Others), by Frequency Range (Low frequency (< 1 GHz), Medium frequency (1-6 GHz), High frequency (> 6 GHz)), by Mounting Type (Edge mount, Through hole, Panel mount, PCB mount, Others), by Material (Brass, Beryllium copper, Stainless steel, Aluminum, Others), by Plating (Gold, Silver, Nickel, Others), by Application (Wireless infrastructure, Test & measurement equipment, Satellite communication, Broadcast equipment, Antenna systems, IoT devices, Medical devices, Others), by End-use Industry (Telecommunications, Aerospace & defense, Consumer electronics, Automotive, Industrial, IT & networking, Healthcare, Others), by North America (U.S., Canada), by Europe (UK, Germany, France, Italy, Spain, Russia), by Asia Pacific (China, India, Japan, South Korea, Australia), by Latin America (Brazil, Mexico), by MEA (UAE, Saudi Arabia, South Africa) Forecast 2025-2033

Publisher Logo

RF Connectors Market Growth Opportunities and Market Forecast 2025-2033: A Strategic Analysis


Key Insights

The size of the RF Connectors Market was valued at USD 32 Billion in 2024 and is projected to reach USD 53.78 Billion by 2033, with an expected CAGR of 7.7% during the forecast period. The RF Connectors Market emphasizes the creation and utilization of connectors designed for transferring radio frequency signals in numerous electronic devices and systems. RF connectors are essential elements in sectors such as telecommunications, aerospace, automotive, consumer electronics, and defense, facilitating the transmission of high-frequency signals in applications like mobile networks, satellite communications, Wi-Fi, GPS, and radar systems. The demand for high-speed wireless communication, the expansion of 5G networks, and the growth of IoT (Internet of Things) devices are all driving the market, necessitating dependable and efficient RF connectors. Moreover, improvements in connector design, materials, and miniaturization are boosting performance, reliability, and durability, which is further driving market expansion. The increasing shift towards wireless connections, along with the demand for better signal quality and minimized electromagnetic interference, is further driving the growth of the RF Connectors Market. As sectors maintain a focus on advanced communication systems, the market is anticipated to see substantial expansion, fueled by advancements in connector technology and the persistent need for strong, high-frequency signal transmission options.

RF Connectors Market Research Report - Market Size, Growth & Forecast

RF Connectors Market Concentration & Characteristics

The RF Connectors Market exhibits a moderately concentrated competitive landscape, with several key players holding a significant market share. The market is characterized by innovation, as manufacturers continuously introduce new products and technologies to meet the evolving needs of end-users. Regulations play a crucial role in shaping the market dynamics, with standards and specifications governing the design, manufacturing, and performance of RF connectors. Product substitutes, such as other types of electrical connectors, may pose some level of competition. End-user concentration is moderate, with a diverse range of industries relying on RF connectors. The level of M&A activity in the market is moderate, with occasional acquisitions and partnerships to enhance product offerings and market reach.

RF Connectors Market Trends

Rising Demand for Wireless Infrastructure: The growing adoption of 5G networks and the expansion of wireless connectivity are driving the demand for RF connectors used in base stations, antennas, and other network equipment.

Increasing Use in Test & Measurement Equipment: RF connectors play a critical role in test & measurement applications, including signal analysis, spectrum monitoring, and network testing. The advancements in electronics and the need for high-precision measurements are fueling the growth of this segment.

Growing Adoption in Satellite Communication: The expansion of satellite-based communication systems for broadcasting, data transmission, and navigation is driving the demand for RF connectors in satellite systems.

Advancements in IoT Devices: The proliferation of IoT devices, such as sensors, actuators, and controllers, creates a need for reliable and high-performance RF connectors to facilitate wireless communication.

RF Connectors Market Growth

Key Region or Country & Segment to Dominate the Market

North America: North America is a leading market for RF Connectors, driven by the presence of major telecommunication and technology companies, extensive wireless infrastructure, and a high demand for advanced test & measurement equipment.

Asia Pacific: The Asia Pacific region is anticipated to exhibit the highest growth rate during the forecast period due to the rapid expansion of wireless infrastructure, increasing adoption of IoT devices, and growing consumer electronics market.

Product Type: BNC connectors are expected to hold the largest market share due to their wide use in various applications, including telecommunications, broadcasting, and test & measurement equipment. SMA connectors are also gaining popularity due to their compact size and high performance.

RF Connectors Market Product Insights Report Coverage & Deliverables

Product Segments:

  • BNC Connectors
  • SMA Connectors
  • MCX/MMCX Connectors
  • N-Type Connectors
  • TNC Connectors
  • F-Type Connectors
  • UHF Connectors
  • QMA Connectors
  • Others

Frequency Range:

  • Low Frequency (<6 GHz)
  • High Frequency (6 GHz to 18 GHz)
  • Ultra-High Frequency (18 GHz to 40 GHz)

Mounting Type:

  • Edge Mount
  • Through Hole
  • Panel Mount
  • PCB Mount
  • Others

Material:

  • Brass
  • Beryllium Copper
  • Stainless Steel
  • Aluminum
  • Others

Plating:

  • Gold
  • Silver
  • Nickel
  • Others

RF Connectors Market Analysis

In terms of market size, the RF Connectors Market is estimated to reach 42.5 Billion by 2028, growing at a CAGR of 7.7% from 2023 to 2028. North America and Asia Pacific are the largest and fastest-growing regions, respectively. BNC connectors hold the largest market share, followed by SMA connectors.

RF Connectors Market Regional Insights

North America:

  • U.S.
  • Canada

Europe:

  • U.K.
  • Germany
  • France
  • Italy
  • Spain
  • Russia

Asia Pacific:

  • China
  • India
  • Japan
  • South Korea
  • Australia

Latin America:

  • Brazil
  • Mexico

MEA:

  • UAE
  • Saudi Arabia
  • South Africa

Driving Forces: What's Propelling the RF Connectors Market

  • Increasing demand for wireless connectivity
  • Expansion of 5G networks
  • Growing adoption of IoT devices
  • Advancements in test & measurement equipment
  • Government initiatives promoting advanced technologies

Challenges and Restraints in RF Connectors Market

  • Product substitution
  • Stringent regulations
  • Fluctuating raw material prices
  • Limited availability of skilled workforce

Emerging Trends in RF Connectors Market

  • Development of high-speed connectors
  • Miniaturization of connectors
  • Integration of advanced technologies
  • Growing demand for rugged and durable connectors

RF Connectors Industry News

  • August 2023: Pasternack, an Infinite Electronics brand, announced a new series of hermetically sealed RF connectors and adapters designed for military and defense applications.
  • September 2021: Radio Frequency Systems (RFS) launched the next generation of its OMNI FIT Premium connector family for RF cables and jumpers, offering improved electrical performance and efficient installations.

Leading Players in the RF Connectors Market

RF Connectors Market Segmentation

  • 1. Product Type
    • 1.1. BNC connectors
    • 1.2. SMA connectors
    • 1.3. MCX/MMCX connectors
    • 1.4. N-Type connectors
    • 1.5. TNC connectors
    • 1.6. F-Type connectors
    • 1.7. UHF connectors
    • 1.8. QMA connectors
    • 1.9. Others
  • 2. Frequency Range
    • 2.1. Low frequency (< 1 GHz)
    • 2.2. Medium frequency (1-6 GHz)
    • 2.3. High frequency (> 6 GHz)
  • 3. Mounting Type
    • 3.1. Edge mount
    • 3.2. Through hole
    • 3.3. Panel mount
    • 3.4. PCB mount
    • 3.5. Others
  • 4. Material
    • 4.1. Brass
    • 4.2. Beryllium copper
    • 4.3. Stainless steel
    • 4.4. Aluminum
    • 4.5. Others
  • 5. Plating
    • 5.1. Gold
    • 5.2. Silver
    • 5.3. Nickel
    • 5.4. Others
  • 6. Application
    • 6.1. Wireless infrastructure
    • 6.2. Test & measurement equipment
    • 6.3. Satellite communication
    • 6.4. Broadcast equipment
    • 6.5. Antenna systems
    • 6.6. IoT devices
    • 6.7. Medical devices
    • 6.8. Others
  • 7. End-use Industry
    • 7.1. Telecommunications
    • 7.2. Aerospace & defense
    • 7.3. Consumer electronics
    • 7.4. Automotive
    • 7.5. Industrial
    • 7.6. IT & networking
    • 7.7. Healthcare
    • 7.8. Others

RF Connectors Market Segmentation By Geography

  • 1. North America
    • 1.1. U.S.
    • 1.2. Canada
  • 2. Europe
    • 2.1. UK
    • 2.2. Germany
    • 2.3. France
    • 2.4. Italy
    • 2.5. Spain
    • 2.6. Russia
  • 3. Asia Pacific
    • 3.1. China
    • 3.2. India
    • 3.3. Japan
    • 3.4. South Korea
    • 3.5. Australia
  • 4. Latin America
    • 4.1. Brazil
    • 4.2. Mexico
  • 5. MEA
    • 5.1. UAE
    • 5.2. Saudi Arabia
    • 5.3. South Africa

RF Connectors Market Regional Share


RF Connectors Market REPORT HIGHLIGHTS

AspectsDetails
Study Period 2019-2033
Base Year 2024
Estimated Year 2025
Forecast Period2025-2033
Historical Period2019-2024
Growth RateCAGR of 7.7% from 2019-2033
Segmentation
    • By Product Type
      • BNC connectors
      • SMA connectors
      • MCX/MMCX connectors
      • N-Type connectors
      • TNC connectors
      • F-Type connectors
      • UHF connectors
      • QMA connectors
      • Others
    • By Frequency Range
      • Low frequency (< 1 GHz)
      • Medium frequency (1-6 GHz)
      • High frequency (> 6 GHz)
    • By Mounting Type
      • Edge mount
      • Through hole
      • Panel mount
      • PCB mount
      • Others
    • By Material
      • Brass
      • Beryllium copper
      • Stainless steel
      • Aluminum
      • Others
    • By Plating
      • Gold
      • Silver
      • Nickel
      • Others
    • By Application
      • Wireless infrastructure
      • Test & measurement equipment
      • Satellite communication
      • Broadcast equipment
      • Antenna systems
      • IoT devices
      • Medical devices
      • Others
    • By End-use Industry
      • Telecommunications
      • Aerospace & defense
      • Consumer electronics
      • Automotive
      • Industrial
      • IT & networking
      • Healthcare
      • Others
  • By Geography
    • North America
      • U.S.
      • Canada
    • Europe
      • UK
      • Germany
      • France
      • Italy
      • Spain
      • Russia
    • Asia Pacific
      • China
      • India
      • Japan
      • South Korea
      • Australia
    • Latin America
      • Brazil
      • Mexico
    • MEA
      • UAE
      • Saudi Arabia
      • South Africa


Table of Contents

  1. 1. Introduction
    • 1.1. Research Scope
    • 1.2. Market Segmentation
    • 1.3. Research Methodology
    • 1.4. Definitions and Assumptions
  2. 2. Executive Summary
    • 2.1. Introduction
  3. 3. Market Dynamics
    • 3.1. Introduction
      • 3.2. Market Drivers
        • 3.2.1 Expansion of 112G PAM4 connectivity into enterprise networks
        • 3.2.2 Increased investment in modern communication networks
        • 3.2.3 Increased demand for reliable connectivity solutions
        • 3.2.4 Adoption in V2X and ADAS technologies
        • 3.2.5 Need for high-performance
        • 3.2.6 rugged connectors
      • 3.3. Market Restrains
        • 3.3.1 Advanced designs require specialized expertise and resources
        • 3.3.2 Intense competition leads to pricing pressures
      • 3.4. Market Trends
  4. 4. Market Factor Analysis
    • 4.1. Porters Five Forces
    • 4.2. Supply/Value Chain
    • 4.3. PESTEL analysis
    • 4.4. Market Entropy
    • 4.5. Patent/Trademark Analysis
  5. 5. Global RF Connectors Market Analysis, Insights and Forecast, 2019-2031
    • 5.1. Market Analysis, Insights and Forecast - by Product Type
      • 5.1.1. BNC connectors
      • 5.1.2. SMA connectors
      • 5.1.3. MCX/MMCX connectors
      • 5.1.4. N-Type connectors
      • 5.1.5. TNC connectors
      • 5.1.6. F-Type connectors
      • 5.1.7. UHF connectors
      • 5.1.8. QMA connectors
      • 5.1.9. Others
    • 5.2. Market Analysis, Insights and Forecast - by Frequency Range
      • 5.2.1. Low frequency (< 1 GHz)
      • 5.2.2. Medium frequency (1-6 GHz)
      • 5.2.3. High frequency (> 6 GHz)
    • 5.3. Market Analysis, Insights and Forecast - by Mounting Type
      • 5.3.1. Edge mount
      • 5.3.2. Through hole
      • 5.3.3. Panel mount
      • 5.3.4. PCB mount
      • 5.3.5. Others
    • 5.4. Market Analysis, Insights and Forecast - by Material
      • 5.4.1. Brass
      • 5.4.2. Beryllium copper
      • 5.4.3. Stainless steel
      • 5.4.4. Aluminum
      • 5.4.5. Others
    • 5.5. Market Analysis, Insights and Forecast - by Plating
      • 5.5.1. Gold
      • 5.5.2. Silver
      • 5.5.3. Nickel
      • 5.5.4. Others
    • 5.6. Market Analysis, Insights and Forecast - by Application
      • 5.6.1. Wireless infrastructure
      • 5.6.2. Test & measurement equipment
      • 5.6.3. Satellite communication
      • 5.6.4. Broadcast equipment
      • 5.6.5. Antenna systems
      • 5.6.6. IoT devices
      • 5.6.7. Medical devices
      • 5.6.8. Others
    • 5.7. Market Analysis, Insights and Forecast - by End-use Industry
      • 5.7.1. Telecommunications
      • 5.7.2. Aerospace & defense
      • 5.7.3. Consumer electronics
      • 5.7.4. Automotive
      • 5.7.5. Industrial
      • 5.7.6. IT & networking
      • 5.7.7. Healthcare
      • 5.7.8. Others
    • 5.8. Market Analysis, Insights and Forecast - by Region
      • 5.8.1. North America
      • 5.8.2. Europe
      • 5.8.3. Asia Pacific
      • 5.8.4. Latin America
      • 5.8.5. MEA
  6. 6. North America RF Connectors Market Analysis, Insights and Forecast, 2019-2031
    • 6.1. Market Analysis, Insights and Forecast - by Product Type
      • 6.1.1. BNC connectors
      • 6.1.2. SMA connectors
      • 6.1.3. MCX/MMCX connectors
      • 6.1.4. N-Type connectors
      • 6.1.5. TNC connectors
      • 6.1.6. F-Type connectors
      • 6.1.7. UHF connectors
      • 6.1.8. QMA connectors
      • 6.1.9. Others
    • 6.2. Market Analysis, Insights and Forecast - by Frequency Range
      • 6.2.1. Low frequency (< 1 GHz)
      • 6.2.2. Medium frequency (1-6 GHz)
      • 6.2.3. High frequency (> 6 GHz)
    • 6.3. Market Analysis, Insights and Forecast - by Mounting Type
      • 6.3.1. Edge mount
      • 6.3.2. Through hole
      • 6.3.3. Panel mount
      • 6.3.4. PCB mount
      • 6.3.5. Others
    • 6.4. Market Analysis, Insights and Forecast - by Material
      • 6.4.1. Brass
      • 6.4.2. Beryllium copper
      • 6.4.3. Stainless steel
      • 6.4.4. Aluminum
      • 6.4.5. Others
    • 6.5. Market Analysis, Insights and Forecast - by Plating
      • 6.5.1. Gold
      • 6.5.2. Silver
      • 6.5.3. Nickel
      • 6.5.4. Others
    • 6.6. Market Analysis, Insights and Forecast - by Application
      • 6.6.1. Wireless infrastructure
      • 6.6.2. Test & measurement equipment
      • 6.6.3. Satellite communication
      • 6.6.4. Broadcast equipment
      • 6.6.5. Antenna systems
      • 6.6.6. IoT devices
      • 6.6.7. Medical devices
      • 6.6.8. Others
    • 6.7. Market Analysis, Insights and Forecast - by End-use Industry
      • 6.7.1. Telecommunications
      • 6.7.2. Aerospace & defense
      • 6.7.3. Consumer electronics
      • 6.7.4. Automotive
      • 6.7.5. Industrial
      • 6.7.6. IT & networking
      • 6.7.7. Healthcare
      • 6.7.8. Others
  7. 7. Europe RF Connectors Market Analysis, Insights and Forecast, 2019-2031
    • 7.1. Market Analysis, Insights and Forecast - by Product Type
      • 7.1.1. BNC connectors
      • 7.1.2. SMA connectors
      • 7.1.3. MCX/MMCX connectors
      • 7.1.4. N-Type connectors
      • 7.1.5. TNC connectors
      • 7.1.6. F-Type connectors
      • 7.1.7. UHF connectors
      • 7.1.8. QMA connectors
      • 7.1.9. Others
    • 7.2. Market Analysis, Insights and Forecast - by Frequency Range
      • 7.2.1. Low frequency (< 1 GHz)
      • 7.2.2. Medium frequency (1-6 GHz)
      • 7.2.3. High frequency (> 6 GHz)
    • 7.3. Market Analysis, Insights and Forecast - by Mounting Type
      • 7.3.1. Edge mount
      • 7.3.2. Through hole
      • 7.3.3. Panel mount
      • 7.3.4. PCB mount
      • 7.3.5. Others
    • 7.4. Market Analysis, Insights and Forecast - by Material
      • 7.4.1. Brass
      • 7.4.2. Beryllium copper
      • 7.4.3. Stainless steel
      • 7.4.4. Aluminum
      • 7.4.5. Others
    • 7.5. Market Analysis, Insights and Forecast - by Plating
      • 7.5.1. Gold
      • 7.5.2. Silver
      • 7.5.3. Nickel
      • 7.5.4. Others
    • 7.6. Market Analysis, Insights and Forecast - by Application
      • 7.6.1. Wireless infrastructure
      • 7.6.2. Test & measurement equipment
      • 7.6.3. Satellite communication
      • 7.6.4. Broadcast equipment
      • 7.6.5. Antenna systems
      • 7.6.6. IoT devices
      • 7.6.7. Medical devices
      • 7.6.8. Others
    • 7.7. Market Analysis, Insights and Forecast - by End-use Industry
      • 7.7.1. Telecommunications
      • 7.7.2. Aerospace & defense
      • 7.7.3. Consumer electronics
      • 7.7.4. Automotive
      • 7.7.5. Industrial
      • 7.7.6. IT & networking
      • 7.7.7. Healthcare
      • 7.7.8. Others
  8. 8. Asia Pacific RF Connectors Market Analysis, Insights and Forecast, 2019-2031
    • 8.1. Market Analysis, Insights and Forecast - by Product Type
      • 8.1.1. BNC connectors
      • 8.1.2. SMA connectors
      • 8.1.3. MCX/MMCX connectors
      • 8.1.4. N-Type connectors
      • 8.1.5. TNC connectors
      • 8.1.6. F-Type connectors
      • 8.1.7. UHF connectors
      • 8.1.8. QMA connectors
      • 8.1.9. Others
    • 8.2. Market Analysis, Insights and Forecast - by Frequency Range
      • 8.2.1. Low frequency (< 1 GHz)
      • 8.2.2. Medium frequency (1-6 GHz)
      • 8.2.3. High frequency (> 6 GHz)
    • 8.3. Market Analysis, Insights and Forecast - by Mounting Type
      • 8.3.1. Edge mount
      • 8.3.2. Through hole
      • 8.3.3. Panel mount
      • 8.3.4. PCB mount
      • 8.3.5. Others
    • 8.4. Market Analysis, Insights and Forecast - by Material
      • 8.4.1. Brass
      • 8.4.2. Beryllium copper
      • 8.4.3. Stainless steel
      • 8.4.4. Aluminum
      • 8.4.5. Others
    • 8.5. Market Analysis, Insights and Forecast - by Plating
      • 8.5.1. Gold
      • 8.5.2. Silver
      • 8.5.3. Nickel
      • 8.5.4. Others
    • 8.6. Market Analysis, Insights and Forecast - by Application
      • 8.6.1. Wireless infrastructure
      • 8.6.2. Test & measurement equipment
      • 8.6.3. Satellite communication
      • 8.6.4. Broadcast equipment
      • 8.6.5. Antenna systems
      • 8.6.6. IoT devices
      • 8.6.7. Medical devices
      • 8.6.8. Others
    • 8.7. Market Analysis, Insights and Forecast - by End-use Industry
      • 8.7.1. Telecommunications
      • 8.7.2. Aerospace & defense
      • 8.7.3. Consumer electronics
      • 8.7.4. Automotive
      • 8.7.5. Industrial
      • 8.7.6. IT & networking
      • 8.7.7. Healthcare
      • 8.7.8. Others
  9. 9. Latin America RF Connectors Market Analysis, Insights and Forecast, 2019-2031
    • 9.1. Market Analysis, Insights and Forecast - by Product Type
      • 9.1.1. BNC connectors
      • 9.1.2. SMA connectors
      • 9.1.3. MCX/MMCX connectors
      • 9.1.4. N-Type connectors
      • 9.1.5. TNC connectors
      • 9.1.6. F-Type connectors
      • 9.1.7. UHF connectors
      • 9.1.8. QMA connectors
      • 9.1.9. Others
    • 9.2. Market Analysis, Insights and Forecast - by Frequency Range
      • 9.2.1. Low frequency (< 1 GHz)
      • 9.2.2. Medium frequency (1-6 GHz)
      • 9.2.3. High frequency (> 6 GHz)
    • 9.3. Market Analysis, Insights and Forecast - by Mounting Type
      • 9.3.1. Edge mount
      • 9.3.2. Through hole
      • 9.3.3. Panel mount
      • 9.3.4. PCB mount
      • 9.3.5. Others
    • 9.4. Market Analysis, Insights and Forecast - by Material
      • 9.4.1. Brass
      • 9.4.2. Beryllium copper
      • 9.4.3. Stainless steel
      • 9.4.4. Aluminum
      • 9.4.5. Others
    • 9.5. Market Analysis, Insights and Forecast - by Plating
      • 9.5.1. Gold
      • 9.5.2. Silver
      • 9.5.3. Nickel
      • 9.5.4. Others
    • 9.6. Market Analysis, Insights and Forecast - by Application
      • 9.6.1. Wireless infrastructure
      • 9.6.2. Test & measurement equipment
      • 9.6.3. Satellite communication
      • 9.6.4. Broadcast equipment
      • 9.6.5. Antenna systems
      • 9.6.6. IoT devices
      • 9.6.7. Medical devices
      • 9.6.8. Others
    • 9.7. Market Analysis, Insights and Forecast - by End-use Industry
      • 9.7.1. Telecommunications
      • 9.7.2. Aerospace & defense
      • 9.7.3. Consumer electronics
      • 9.7.4. Automotive
      • 9.7.5. Industrial
      • 9.7.6. IT & networking
      • 9.7.7. Healthcare
      • 9.7.8. Others
  10. 10. MEA RF Connectors Market Analysis, Insights and Forecast, 2019-2031
    • 10.1. Market Analysis, Insights and Forecast - by Product Type
      • 10.1.1. BNC connectors
      • 10.1.2. SMA connectors
      • 10.1.3. MCX/MMCX connectors
      • 10.1.4. N-Type connectors
      • 10.1.5. TNC connectors
      • 10.1.6. F-Type connectors
      • 10.1.7. UHF connectors
      • 10.1.8. QMA connectors
      • 10.1.9. Others
    • 10.2. Market Analysis, Insights and Forecast - by Frequency Range
      • 10.2.1. Low frequency (< 1 GHz)
      • 10.2.2. Medium frequency (1-6 GHz)
      • 10.2.3. High frequency (> 6 GHz)
    • 10.3. Market Analysis, Insights and Forecast - by Mounting Type
      • 10.3.1. Edge mount
      • 10.3.2. Through hole
      • 10.3.3. Panel mount
      • 10.3.4. PCB mount
      • 10.3.5. Others
    • 10.4. Market Analysis, Insights and Forecast - by Material
      • 10.4.1. Brass
      • 10.4.2. Beryllium copper
      • 10.4.3. Stainless steel
      • 10.4.4. Aluminum
      • 10.4.5. Others
    • 10.5. Market Analysis, Insights and Forecast - by Plating
      • 10.5.1. Gold
      • 10.5.2. Silver
      • 10.5.3. Nickel
      • 10.5.4. Others
    • 10.6. Market Analysis, Insights and Forecast - by Application
      • 10.6.1. Wireless infrastructure
      • 10.6.2. Test & measurement equipment
      • 10.6.3. Satellite communication
      • 10.6.4. Broadcast equipment
      • 10.6.5. Antenna systems
      • 10.6.6. IoT devices
      • 10.6.7. Medical devices
      • 10.6.8. Others
    • 10.7. Market Analysis, Insights and Forecast - by End-use Industry
      • 10.7.1. Telecommunications
      • 10.7.2. Aerospace & defense
      • 10.7.3. Consumer electronics
      • 10.7.4. Automotive
      • 10.7.5. Industrial
      • 10.7.6. IT & networking
      • 10.7.7. Healthcare
      • 10.7.8. Others
  11. 11. Competitive Analysis
    • 11.1. Global Market Share Analysis 2024
      • 11.2. Company Profiles
        • 11.2.1 Amphenol Corporation
          • 11.2.1.1. Overview
          • 11.2.1.2. Products
          • 11.2.1.3. SWOT Analysis
          • 11.2.1.4. Recent Developments
          • 11.2.1.5. Financials (Based on Availability)
        • 11.2.2 Anritsu Corporation
          • 11.2.2.1. Overview
          • 11.2.2.2. Products
          • 11.2.2.3. SWOT Analysis
          • 11.2.2.4. Recent Developments
          • 11.2.2.5. Financials (Based on Availability)
        • 11.2.3 AVX Corporation
          • 11.2.3.1. Overview
          • 11.2.3.2. Products
          • 11.2.3.3. SWOT Analysis
          • 11.2.3.4. Recent Developments
          • 11.2.3.5. Financials (Based on Availability)
        • 11.2.4 Belden Inc.
          • 11.2.4.1. Overview
          • 11.2.4.2. Products
          • 11.2.4.3. SWOT Analysis
          • 11.2.4.4. Recent Developments
          • 11.2.4.5. Financials (Based on Availability)
        • 11.2.5 Bomar Interconnect Products Inc.
          • 11.2.5.1. Overview
          • 11.2.5.2. Products
          • 11.2.5.3. SWOT Analysis
          • 11.2.5.4. Recent Developments
          • 11.2.5.5. Financials (Based on Availability)
        • 11.2.6 Carlisle Interconnect Technologies
          • 11.2.6.1. Overview
          • 11.2.6.2. Products
          • 11.2.6.3. SWOT Analysis
          • 11.2.6.4. Recent Developments
          • 11.2.6.5. Financials (Based on Availability)
        • 11.2.7 Corning Optical Communications
          • 11.2.7.1. Overview
          • 11.2.7.2. Products
          • 11.2.7.3. SWOT Analysis
          • 11.2.7.4. Recent Developments
          • 11.2.7.5. Financials (Based on Availability)
        • 11.2.8 Delta Electronics Inc.
          • 11.2.8.1. Overview
          • 11.2.8.2. Products
          • 11.2.8.3. SWOT Analysis
          • 11.2.8.4. Recent Developments
          • 11.2.8.5. Financials (Based on Availability)
        • 11.2.9 Digi-Key Electronics
          • 11.2.9.1. Overview
          • 11.2.9.2. Products
          • 11.2.9.3. SWOT Analysis
          • 11.2.9.4. Recent Developments
          • 11.2.9.5. Financials (Based on Availability)
        • 11.2.10 Hirose Electric Co. Ltd.
          • 11.2.10.1. Overview
          • 11.2.10.2. Products
          • 11.2.10.3. SWOT Analysis
          • 11.2.10.4. Recent Developments
          • 11.2.10.5. Financials (Based on Availability)
        • 11.2.11 HUBER+SUHNER
          • 11.2.11.1. Overview
          • 11.2.11.2. Products
          • 11.2.11.3. SWOT Analysis
          • 11.2.11.4. Recent Developments
          • 11.2.11.5. Financials (Based on Availability)
        • 11.2.12 JAE (Japan Aviation Electronics Industry Ltd.)
          • 11.2.12.1. Overview
          • 11.2.12.2. Products
          • 11.2.12.3. SWOT Analysis
          • 11.2.12.4. Recent Developments
          • 11.2.12.5. Financials (Based on Availability)
        • 11.2.13 Johanson Technology Inc.
          • 11.2.13.1. Overview
          • 11.2.13.2. Products
          • 11.2.13.3. SWOT Analysis
          • 11.2.13.4. Recent Developments
          • 11.2.13.5. Financials (Based on Availability)
        • 11.2.14 L-com Global Connectivity
          • 11.2.14.1. Overview
          • 11.2.14.2. Products
          • 11.2.14.3. SWOT Analysis
          • 11.2.14.4. Recent Developments
          • 11.2.14.5. Financials (Based on Availability)
        • 11.2.15 Molex LLC
          • 11.2.15.1. Overview
          • 11.2.15.2. Products
          • 11.2.15.3. SWOT Analysis
          • 11.2.15.4. Recent Developments
          • 11.2.15.5. Financials (Based on Availability)
        • 11.2.16 Pasternack Enterprises Inc.
          • 11.2.16.1. Overview
          • 11.2.16.2. Products
          • 11.2.16.3. SWOT Analysis
          • 11.2.16.4. Recent Developments
          • 11.2.16.5. Financials (Based on Availability)
        • 11.2.17 Radiall SA
          • 11.2.17.1. Overview
          • 11.2.17.2. Products
          • 11.2.17.3. SWOT Analysis
          • 11.2.17.4. Recent Developments
          • 11.2.17.5. Financials (Based on Availability)
        • 11.2.18 RF Industries Ltd.
          • 11.2.18.1. Overview
          • 11.2.18.2. Products
          • 11.2.18.3. SWOT Analysis
          • 11.2.18.4. Recent Developments
          • 11.2.18.5. Financials (Based on Availability)
        • 11.2.19 Rosenberger Hochfrequenztechnik GmbH & Co. KG
          • 11.2.19.1. Overview
          • 11.2.19.2. Products
          • 11.2.19.3. SWOT Analysis
          • 11.2.19.4. Recent Developments
          • 11.2.19.5. Financials (Based on Availability)
        • 11.2.20 Samtec Inc.
          • 11.2.20.1. Overview
          • 11.2.20.2. Products
          • 11.2.20.3. SWOT Analysis
          • 11.2.20.4. Recent Developments
          • 11.2.20.5. Financials (Based on Availability)
        • 11.2.21 Smiths Interconnect
          • 11.2.21.1. Overview
          • 11.2.21.2. Products
          • 11.2.21.3. SWOT Analysis
          • 11.2.21.4. Recent Developments
          • 11.2.21.5. Financials (Based on Availability)
        • 11.2.22 TE Connectivity Ltd.
          • 11.2.22.1. Overview
          • 11.2.22.2. Products
          • 11.2.22.3. SWOT Analysis
          • 11.2.22.4. Recent Developments
          • 11.2.22.5. Financials (Based on Availability)
        • 11.2.23 W.L. Gore & Associates Inc.
          • 11.2.23.1. Overview
          • 11.2.23.2. Products
          • 11.2.23.3. SWOT Analysis
          • 11.2.23.4. Recent Developments
          • 11.2.23.5. Financials (Based on Availability)

List of Figures

  1. Figure 1: Global RF Connectors Market Revenue Breakdown (Billion, %) by Region 2024 & 2032
  2. Figure 2: Global RF Connectors Market Volume Breakdown (K Tons, %) by Region 2024 & 2032
  3. Figure 3: North America RF Connectors Market Revenue (Billion), by Product Type 2024 & 2032
  4. Figure 4: North America RF Connectors Market Volume (K Tons), by Product Type 2024 & 2032
  5. Figure 5: North America RF Connectors Market Revenue Share (%), by Product Type 2024 & 2032
  6. Figure 6: North America RF Connectors Market Volume Share (%), by Product Type 2024 & 2032
  7. Figure 7: North America RF Connectors Market Revenue (Billion), by Frequency Range 2024 & 2032
  8. Figure 8: North America RF Connectors Market Volume (K Tons), by Frequency Range 2024 & 2032
  9. Figure 9: North America RF Connectors Market Revenue Share (%), by Frequency Range 2024 & 2032
  10. Figure 10: North America RF Connectors Market Volume Share (%), by Frequency Range 2024 & 2032
  11. Figure 11: North America RF Connectors Market Revenue (Billion), by Mounting Type 2024 & 2032
  12. Figure 12: North America RF Connectors Market Volume (K Tons), by Mounting Type 2024 & 2032
  13. Figure 13: North America RF Connectors Market Revenue Share (%), by Mounting Type 2024 & 2032
  14. Figure 14: North America RF Connectors Market Volume Share (%), by Mounting Type 2024 & 2032
  15. Figure 15: North America RF Connectors Market Revenue (Billion), by Material 2024 & 2032
  16. Figure 16: North America RF Connectors Market Volume (K Tons), by Material 2024 & 2032
  17. Figure 17: North America RF Connectors Market Revenue Share (%), by Material 2024 & 2032
  18. Figure 18: North America RF Connectors Market Volume Share (%), by Material 2024 & 2032
  19. Figure 19: North America RF Connectors Market Revenue (Billion), by Plating 2024 & 2032
  20. Figure 20: North America RF Connectors Market Volume (K Tons), by Plating 2024 & 2032
  21. Figure 21: North America RF Connectors Market Revenue Share (%), by Plating 2024 & 2032
  22. Figure 22: North America RF Connectors Market Volume Share (%), by Plating 2024 & 2032
  23. Figure 23: North America RF Connectors Market Revenue (Billion), by Application 2024 & 2032
  24. Figure 24: North America RF Connectors Market Volume (K Tons), by Application 2024 & 2032
  25. Figure 25: North America RF Connectors Market Revenue Share (%), by Application 2024 & 2032
  26. Figure 26: North America RF Connectors Market Volume Share (%), by Application 2024 & 2032
  27. Figure 27: North America RF Connectors Market Revenue (Billion), by End-use Industry 2024 & 2032
  28. Figure 28: North America RF Connectors Market Volume (K Tons), by End-use Industry 2024 & 2032
  29. Figure 29: North America RF Connectors Market Revenue Share (%), by End-use Industry 2024 & 2032
  30. Figure 30: North America RF Connectors Market Volume Share (%), by End-use Industry 2024 & 2032
  31. Figure 31: North America RF Connectors Market Revenue (Billion), by Country 2024 & 2032
  32. Figure 32: North America RF Connectors Market Volume (K Tons), by Country 2024 & 2032
  33. Figure 33: North America RF Connectors Market Revenue Share (%), by Country 2024 & 2032
  34. Figure 34: North America RF Connectors Market Volume Share (%), by Country 2024 & 2032
  35. Figure 35: Europe RF Connectors Market Revenue (Billion), by Product Type 2024 & 2032
  36. Figure 36: Europe RF Connectors Market Volume (K Tons), by Product Type 2024 & 2032
  37. Figure 37: Europe RF Connectors Market Revenue Share (%), by Product Type 2024 & 2032
  38. Figure 38: Europe RF Connectors Market Volume Share (%), by Product Type 2024 & 2032
  39. Figure 39: Europe RF Connectors Market Revenue (Billion), by Frequency Range 2024 & 2032
  40. Figure 40: Europe RF Connectors Market Volume (K Tons), by Frequency Range 2024 & 2032
  41. Figure 41: Europe RF Connectors Market Revenue Share (%), by Frequency Range 2024 & 2032
  42. Figure 42: Europe RF Connectors Market Volume Share (%), by Frequency Range 2024 & 2032
  43. Figure 43: Europe RF Connectors Market Revenue (Billion), by Mounting Type 2024 & 2032
  44. Figure 44: Europe RF Connectors Market Volume (K Tons), by Mounting Type 2024 & 2032
  45. Figure 45: Europe RF Connectors Market Revenue Share (%), by Mounting Type 2024 & 2032
  46. Figure 46: Europe RF Connectors Market Volume Share (%), by Mounting Type 2024 & 2032
  47. Figure 47: Europe RF Connectors Market Revenue (Billion), by Material 2024 & 2032
  48. Figure 48: Europe RF Connectors Market Volume (K Tons), by Material 2024 & 2032
  49. Figure 49: Europe RF Connectors Market Revenue Share (%), by Material 2024 & 2032
  50. Figure 50: Europe RF Connectors Market Volume Share (%), by Material 2024 & 2032
  51. Figure 51: Europe RF Connectors Market Revenue (Billion), by Plating 2024 & 2032
  52. Figure 52: Europe RF Connectors Market Volume (K Tons), by Plating 2024 & 2032
  53. Figure 53: Europe RF Connectors Market Revenue Share (%), by Plating 2024 & 2032
  54. Figure 54: Europe RF Connectors Market Volume Share (%), by Plating 2024 & 2032
  55. Figure 55: Europe RF Connectors Market Revenue (Billion), by Application 2024 & 2032
  56. Figure 56: Europe RF Connectors Market Volume (K Tons), by Application 2024 & 2032
  57. Figure 57: Europe RF Connectors Market Revenue Share (%), by Application 2024 & 2032
  58. Figure 58: Europe RF Connectors Market Volume Share (%), by Application 2024 & 2032
  59. Figure 59: Europe RF Connectors Market Revenue (Billion), by End-use Industry 2024 & 2032
  60. Figure 60: Europe RF Connectors Market Volume (K Tons), by End-use Industry 2024 & 2032
  61. Figure 61: Europe RF Connectors Market Revenue Share (%), by End-use Industry 2024 & 2032
  62. Figure 62: Europe RF Connectors Market Volume Share (%), by End-use Industry 2024 & 2032
  63. Figure 63: Europe RF Connectors Market Revenue (Billion), by Country 2024 & 2032
  64. Figure 64: Europe RF Connectors Market Volume (K Tons), by Country 2024 & 2032
  65. Figure 65: Europe RF Connectors Market Revenue Share (%), by Country 2024 & 2032
  66. Figure 66: Europe RF Connectors Market Volume Share (%), by Country 2024 & 2032
  67. Figure 67: Asia Pacific RF Connectors Market Revenue (Billion), by Product Type 2024 & 2032
  68. Figure 68: Asia Pacific RF Connectors Market Volume (K Tons), by Product Type 2024 & 2032
  69. Figure 69: Asia Pacific RF Connectors Market Revenue Share (%), by Product Type 2024 & 2032
  70. Figure 70: Asia Pacific RF Connectors Market Volume Share (%), by Product Type 2024 & 2032
  71. Figure 71: Asia Pacific RF Connectors Market Revenue (Billion), by Frequency Range 2024 & 2032
  72. Figure 72: Asia Pacific RF Connectors Market Volume (K Tons), by Frequency Range 2024 & 2032
  73. Figure 73: Asia Pacific RF Connectors Market Revenue Share (%), by Frequency Range 2024 & 2032
  74. Figure 74: Asia Pacific RF Connectors Market Volume Share (%), by Frequency Range 2024 & 2032
  75. Figure 75: Asia Pacific RF Connectors Market Revenue (Billion), by Mounting Type 2024 & 2032
  76. Figure 76: Asia Pacific RF Connectors Market Volume (K Tons), by Mounting Type 2024 & 2032
  77. Figure 77: Asia Pacific RF Connectors Market Revenue Share (%), by Mounting Type 2024 & 2032
  78. Figure 78: Asia Pacific RF Connectors Market Volume Share (%), by Mounting Type 2024 & 2032
  79. Figure 79: Asia Pacific RF Connectors Market Revenue (Billion), by Material 2024 & 2032
  80. Figure 80: Asia Pacific RF Connectors Market Volume (K Tons), by Material 2024 & 2032
  81. Figure 81: Asia Pacific RF Connectors Market Revenue Share (%), by Material 2024 & 2032
  82. Figure 82: Asia Pacific RF Connectors Market Volume Share (%), by Material 2024 & 2032
  83. Figure 83: Asia Pacific RF Connectors Market Revenue (Billion), by Plating 2024 & 2032
  84. Figure 84: Asia Pacific RF Connectors Market Volume (K Tons), by Plating 2024 & 2032
  85. Figure 85: Asia Pacific RF Connectors Market Revenue Share (%), by Plating 2024 & 2032
  86. Figure 86: Asia Pacific RF Connectors Market Volume Share (%), by Plating 2024 & 2032
  87. Figure 87: Asia Pacific RF Connectors Market Revenue (Billion), by Application 2024 & 2032
  88. Figure 88: Asia Pacific RF Connectors Market Volume (K Tons), by Application 2024 & 2032
  89. Figure 89: Asia Pacific RF Connectors Market Revenue Share (%), by Application 2024 & 2032
  90. Figure 90: Asia Pacific RF Connectors Market Volume Share (%), by Application 2024 & 2032
  91. Figure 91: Asia Pacific RF Connectors Market Revenue (Billion), by End-use Industry 2024 & 2032
  92. Figure 92: Asia Pacific RF Connectors Market Volume (K Tons), by End-use Industry 2024 & 2032
  93. Figure 93: Asia Pacific RF Connectors Market Revenue Share (%), by End-use Industry 2024 & 2032
  94. Figure 94: Asia Pacific RF Connectors Market Volume Share (%), by End-use Industry 2024 & 2032
  95. Figure 95: Asia Pacific RF Connectors Market Revenue (Billion), by Country 2024 & 2032
  96. Figure 96: Asia Pacific RF Connectors Market Volume (K Tons), by Country 2024 & 2032
  97. Figure 97: Asia Pacific RF Connectors Market Revenue Share (%), by Country 2024 & 2032
  98. Figure 98: Asia Pacific RF Connectors Market Volume Share (%), by Country 2024 & 2032
  99. Figure 99: Latin America RF Connectors Market Revenue (Billion), by Product Type 2024 & 2032
  100. Figure 100: Latin America RF Connectors Market Volume (K Tons), by Product Type 2024 & 2032
  101. Figure 101: Latin America RF Connectors Market Revenue Share (%), by Product Type 2024 & 2032
  102. Figure 102: Latin America RF Connectors Market Volume Share (%), by Product Type 2024 & 2032
  103. Figure 103: Latin America RF Connectors Market Revenue (Billion), by Frequency Range 2024 & 2032
  104. Figure 104: Latin America RF Connectors Market Volume (K Tons), by Frequency Range 2024 & 2032
  105. Figure 105: Latin America RF Connectors Market Revenue Share (%), by Frequency Range 2024 & 2032
  106. Figure 106: Latin America RF Connectors Market Volume Share (%), by Frequency Range 2024 & 2032
  107. Figure 107: Latin America RF Connectors Market Revenue (Billion), by Mounting Type 2024 & 2032
  108. Figure 108: Latin America RF Connectors Market Volume (K Tons), by Mounting Type 2024 & 2032
  109. Figure 109: Latin America RF Connectors Market Revenue Share (%), by Mounting Type 2024 & 2032
  110. Figure 110: Latin America RF Connectors Market Volume Share (%), by Mounting Type 2024 & 2032
  111. Figure 111: Latin America RF Connectors Market Revenue (Billion), by Material 2024 & 2032
  112. Figure 112: Latin America RF Connectors Market Volume (K Tons), by Material 2024 & 2032
  113. Figure 113: Latin America RF Connectors Market Revenue Share (%), by Material 2024 & 2032
  114. Figure 114: Latin America RF Connectors Market Volume Share (%), by Material 2024 & 2032
  115. Figure 115: Latin America RF Connectors Market Revenue (Billion), by Plating 2024 & 2032
  116. Figure 116: Latin America RF Connectors Market Volume (K Tons), by Plating 2024 & 2032
  117. Figure 117: Latin America RF Connectors Market Revenue Share (%), by Plating 2024 & 2032
  118. Figure 118: Latin America RF Connectors Market Volume Share (%), by Plating 2024 & 2032
  119. Figure 119: Latin America RF Connectors Market Revenue (Billion), by Application 2024 & 2032
  120. Figure 120: Latin America RF Connectors Market Volume (K Tons), by Application 2024 & 2032
  121. Figure 121: Latin America RF Connectors Market Revenue Share (%), by Application 2024 & 2032
  122. Figure 122: Latin America RF Connectors Market Volume Share (%), by Application 2024 & 2032
  123. Figure 123: Latin America RF Connectors Market Revenue (Billion), by End-use Industry 2024 & 2032
  124. Figure 124: Latin America RF Connectors Market Volume (K Tons), by End-use Industry 2024 & 2032
  125. Figure 125: Latin America RF Connectors Market Revenue Share (%), by End-use Industry 2024 & 2032
  126. Figure 126: Latin America RF Connectors Market Volume Share (%), by End-use Industry 2024 & 2032
  127. Figure 127: Latin America RF Connectors Market Revenue (Billion), by Country 2024 & 2032
  128. Figure 128: Latin America RF Connectors Market Volume (K Tons), by Country 2024 & 2032
  129. Figure 129: Latin America RF Connectors Market Revenue Share (%), by Country 2024 & 2032
  130. Figure 130: Latin America RF Connectors Market Volume Share (%), by Country 2024 & 2032
  131. Figure 131: MEA RF Connectors Market Revenue (Billion), by Product Type 2024 & 2032
  132. Figure 132: MEA RF Connectors Market Volume (K Tons), by Product Type 2024 & 2032
  133. Figure 133: MEA RF Connectors Market Revenue Share (%), by Product Type 2024 & 2032
  134. Figure 134: MEA RF Connectors Market Volume Share (%), by Product Type 2024 & 2032
  135. Figure 135: MEA RF Connectors Market Revenue (Billion), by Frequency Range 2024 & 2032
  136. Figure 136: MEA RF Connectors Market Volume (K Tons), by Frequency Range 2024 & 2032
  137. Figure 137: MEA RF Connectors Market Revenue Share (%), by Frequency Range 2024 & 2032
  138. Figure 138: MEA RF Connectors Market Volume Share (%), by Frequency Range 2024 & 2032
  139. Figure 139: MEA RF Connectors Market Revenue (Billion), by Mounting Type 2024 & 2032
  140. Figure 140: MEA RF Connectors Market Volume (K Tons), by Mounting Type 2024 & 2032
  141. Figure 141: MEA RF Connectors Market Revenue Share (%), by Mounting Type 2024 & 2032
  142. Figure 142: MEA RF Connectors Market Volume Share (%), by Mounting Type 2024 & 2032
  143. Figure 143: MEA RF Connectors Market Revenue (Billion), by Material 2024 & 2032
  144. Figure 144: MEA RF Connectors Market Volume (K Tons), by Material 2024 & 2032
  145. Figure 145: MEA RF Connectors Market Revenue Share (%), by Material 2024 & 2032
  146. Figure 146: MEA RF Connectors Market Volume Share (%), by Material 2024 & 2032
  147. Figure 147: MEA RF Connectors Market Revenue (Billion), by Plating 2024 & 2032
  148. Figure 148: MEA RF Connectors Market Volume (K Tons), by Plating 2024 & 2032
  149. Figure 149: MEA RF Connectors Market Revenue Share (%), by Plating 2024 & 2032
  150. Figure 150: MEA RF Connectors Market Volume Share (%), by Plating 2024 & 2032
  151. Figure 151: MEA RF Connectors Market Revenue (Billion), by Application 2024 & 2032
  152. Figure 152: MEA RF Connectors Market Volume (K Tons), by Application 2024 & 2032
  153. Figure 153: MEA RF Connectors Market Revenue Share (%), by Application 2024 & 2032
  154. Figure 154: MEA RF Connectors Market Volume Share (%), by Application 2024 & 2032
  155. Figure 155: MEA RF Connectors Market Revenue (Billion), by End-use Industry 2024 & 2032
  156. Figure 156: MEA RF Connectors Market Volume (K Tons), by End-use Industry 2024 & 2032
  157. Figure 157: MEA RF Connectors Market Revenue Share (%), by End-use Industry 2024 & 2032
  158. Figure 158: MEA RF Connectors Market Volume Share (%), by End-use Industry 2024 & 2032
  159. Figure 159: MEA RF Connectors Market Revenue (Billion), by Country 2024 & 2032
  160. Figure 160: MEA RF Connectors Market Volume (K Tons), by Country 2024 & 2032
  161. Figure 161: MEA RF Connectors Market Revenue Share (%), by Country 2024 & 2032
  162. Figure 162: MEA RF Connectors Market Volume Share (%), by Country 2024 & 2032

List of Tables

  1. Table 1: Global RF Connectors Market Revenue Billion Forecast, by Region 2019 & 2032
  2. Table 2: Global RF Connectors Market Volume K Tons Forecast, by Region 2019 & 2032
  3. Table 3: Global RF Connectors Market Revenue Billion Forecast, by Product Type 2019 & 2032
  4. Table 4: Global RF Connectors Market Volume K Tons Forecast, by Product Type 2019 & 2032
  5. Table 5: Global RF Connectors Market Revenue Billion Forecast, by Frequency Range 2019 & 2032
  6. Table 6: Global RF Connectors Market Volume K Tons Forecast, by Frequency Range 2019 & 2032
  7. Table 7: Global RF Connectors Market Revenue Billion Forecast, by Mounting Type 2019 & 2032
  8. Table 8: Global RF Connectors Market Volume K Tons Forecast, by Mounting Type 2019 & 2032
  9. Table 9: Global RF Connectors Market Revenue Billion Forecast, by Material 2019 & 2032
  10. Table 10: Global RF Connectors Market Volume K Tons Forecast, by Material 2019 & 2032
  11. Table 11: Global RF Connectors Market Revenue Billion Forecast, by Plating 2019 & 2032
  12. Table 12: Global RF Connectors Market Volume K Tons Forecast, by Plating 2019 & 2032
  13. Table 13: Global RF Connectors Market Revenue Billion Forecast, by Application 2019 & 2032
  14. Table 14: Global RF Connectors Market Volume K Tons Forecast, by Application 2019 & 2032
  15. Table 15: Global RF Connectors Market Revenue Billion Forecast, by End-use Industry 2019 & 2032
  16. Table 16: Global RF Connectors Market Volume K Tons Forecast, by End-use Industry 2019 & 2032
  17. Table 17: Global RF Connectors Market Revenue Billion Forecast, by Region 2019 & 2032
  18. Table 18: Global RF Connectors Market Volume K Tons Forecast, by Region 2019 & 2032
  19. Table 19: Global RF Connectors Market Revenue Billion Forecast, by Product Type 2019 & 2032
  20. Table 20: Global RF Connectors Market Volume K Tons Forecast, by Product Type 2019 & 2032
  21. Table 21: Global RF Connectors Market Revenue Billion Forecast, by Frequency Range 2019 & 2032
  22. Table 22: Global RF Connectors Market Volume K Tons Forecast, by Frequency Range 2019 & 2032
  23. Table 23: Global RF Connectors Market Revenue Billion Forecast, by Mounting Type 2019 & 2032
  24. Table 24: Global RF Connectors Market Volume K Tons Forecast, by Mounting Type 2019 & 2032
  25. Table 25: Global RF Connectors Market Revenue Billion Forecast, by Material 2019 & 2032
  26. Table 26: Global RF Connectors Market Volume K Tons Forecast, by Material 2019 & 2032
  27. Table 27: Global RF Connectors Market Revenue Billion Forecast, by Plating 2019 & 2032
  28. Table 28: Global RF Connectors Market Volume K Tons Forecast, by Plating 2019 & 2032
  29. Table 29: Global RF Connectors Market Revenue Billion Forecast, by Application 2019 & 2032
  30. Table 30: Global RF Connectors Market Volume K Tons Forecast, by Application 2019 & 2032
  31. Table 31: Global RF Connectors Market Revenue Billion Forecast, by End-use Industry 2019 & 2032
  32. Table 32: Global RF Connectors Market Volume K Tons Forecast, by End-use Industry 2019 & 2032
  33. Table 33: Global RF Connectors Market Revenue Billion Forecast, by Country 2019 & 2032
  34. Table 34: Global RF Connectors Market Volume K Tons Forecast, by Country 2019 & 2032
  35. Table 35: U.S. RF Connectors Market Revenue (Billion) Forecast, by Application 2019 & 2032
  36. Table 36: U.S. RF Connectors Market Volume (K Tons) Forecast, by Application 2019 & 2032
  37. Table 37: Canada RF Connectors Market Revenue (Billion) Forecast, by Application 2019 & 2032
  38. Table 38: Canada RF Connectors Market Volume (K Tons) Forecast, by Application 2019 & 2032
  39. Table 39: Global RF Connectors Market Revenue Billion Forecast, by Product Type 2019 & 2032
  40. Table 40: Global RF Connectors Market Volume K Tons Forecast, by Product Type 2019 & 2032
  41. Table 41: Global RF Connectors Market Revenue Billion Forecast, by Frequency Range 2019 & 2032
  42. Table 42: Global RF Connectors Market Volume K Tons Forecast, by Frequency Range 2019 & 2032
  43. Table 43: Global RF Connectors Market Revenue Billion Forecast, by Mounting Type 2019 & 2032
  44. Table 44: Global RF Connectors Market Volume K Tons Forecast, by Mounting Type 2019 & 2032
  45. Table 45: Global RF Connectors Market Revenue Billion Forecast, by Material 2019 & 2032
  46. Table 46: Global RF Connectors Market Volume K Tons Forecast, by Material 2019 & 2032
  47. Table 47: Global RF Connectors Market Revenue Billion Forecast, by Plating 2019 & 2032
  48. Table 48: Global RF Connectors Market Volume K Tons Forecast, by Plating 2019 & 2032
  49. Table 49: Global RF Connectors Market Revenue Billion Forecast, by Application 2019 & 2032
  50. Table 50: Global RF Connectors Market Volume K Tons Forecast, by Application 2019 & 2032
  51. Table 51: Global RF Connectors Market Revenue Billion Forecast, by End-use Industry 2019 & 2032
  52. Table 52: Global RF Connectors Market Volume K Tons Forecast, by End-use Industry 2019 & 2032
  53. Table 53: Global RF Connectors Market Revenue Billion Forecast, by Country 2019 & 2032
  54. Table 54: Global RF Connectors Market Volume K Tons Forecast, by Country 2019 & 2032
  55. Table 55: UK RF Connectors Market Revenue (Billion) Forecast, by Application 2019 & 2032
  56. Table 56: UK RF Connectors Market Volume (K Tons) Forecast, by Application 2019 & 2032
  57. Table 57: Germany RF Connectors Market Revenue (Billion) Forecast, by Application 2019 & 2032
  58. Table 58: Germany RF Connectors Market Volume (K Tons) Forecast, by Application 2019 & 2032
  59. Table 59: France RF Connectors Market Revenue (Billion) Forecast, by Application 2019 & 2032
  60. Table 60: France RF Connectors Market Volume (K Tons) Forecast, by Application 2019 & 2032
  61. Table 61: Italy RF Connectors Market Revenue (Billion) Forecast, by Application 2019 & 2032
  62. Table 62: Italy RF Connectors Market Volume (K Tons) Forecast, by Application 2019 & 2032
  63. Table 63: Spain RF Connectors Market Revenue (Billion) Forecast, by Application 2019 & 2032
  64. Table 64: Spain RF Connectors Market Volume (K Tons) Forecast, by Application 2019 & 2032
  65. Table 65: Russia RF Connectors Market Revenue (Billion) Forecast, by Application 2019 & 2032
  66. Table 66: Russia RF Connectors Market Volume (K Tons) Forecast, by Application 2019 & 2032
  67. Table 67: Global RF Connectors Market Revenue Billion Forecast, by Product Type 2019 & 2032
  68. Table 68: Global RF Connectors Market Volume K Tons Forecast, by Product Type 2019 & 2032
  69. Table 69: Global RF Connectors Market Revenue Billion Forecast, by Frequency Range 2019 & 2032
  70. Table 70: Global RF Connectors Market Volume K Tons Forecast, by Frequency Range 2019 & 2032
  71. Table 71: Global RF Connectors Market Revenue Billion Forecast, by Mounting Type 2019 & 2032
  72. Table 72: Global RF Connectors Market Volume K Tons Forecast, by Mounting Type 2019 & 2032
  73. Table 73: Global RF Connectors Market Revenue Billion Forecast, by Material 2019 & 2032
  74. Table 74: Global RF Connectors Market Volume K Tons Forecast, by Material 2019 & 2032
  75. Table 75: Global RF Connectors Market Revenue Billion Forecast, by Plating 2019 & 2032
  76. Table 76: Global RF Connectors Market Volume K Tons Forecast, by Plating 2019 & 2032
  77. Table 77: Global RF Connectors Market Revenue Billion Forecast, by Application 2019 & 2032
  78. Table 78: Global RF Connectors Market Volume K Tons Forecast, by Application 2019 & 2032
  79. Table 79: Global RF Connectors Market Revenue Billion Forecast, by End-use Industry 2019 & 2032
  80. Table 80: Global RF Connectors Market Volume K Tons Forecast, by End-use Industry 2019 & 2032
  81. Table 81: Global RF Connectors Market Revenue Billion Forecast, by Country 2019 & 2032
  82. Table 82: Global RF Connectors Market Volume K Tons Forecast, by Country 2019 & 2032
  83. Table 83: China RF Connectors Market Revenue (Billion) Forecast, by Application 2019 & 2032
  84. Table 84: China RF Connectors Market Volume (K Tons) Forecast, by Application 2019 & 2032
  85. Table 85: India RF Connectors Market Revenue (Billion) Forecast, by Application 2019 & 2032
  86. Table 86: India RF Connectors Market Volume (K Tons) Forecast, by Application 2019 & 2032
  87. Table 87: Japan RF Connectors Market Revenue (Billion) Forecast, by Application 2019 & 2032
  88. Table 88: Japan RF Connectors Market Volume (K Tons) Forecast, by Application 2019 & 2032
  89. Table 89: South Korea RF Connectors Market Revenue (Billion) Forecast, by Application 2019 & 2032
  90. Table 90: South Korea RF Connectors Market Volume (K Tons) Forecast, by Application 2019 & 2032
  91. Table 91: Australia RF Connectors Market Revenue (Billion) Forecast, by Application 2019 & 2032
  92. Table 92: Australia RF Connectors Market Volume (K Tons) Forecast, by Application 2019 & 2032
  93. Table 93: Global RF Connectors Market Revenue Billion Forecast, by Product Type 2019 & 2032
  94. Table 94: Global RF Connectors Market Volume K Tons Forecast, by Product Type 2019 & 2032
  95. Table 95: Global RF Connectors Market Revenue Billion Forecast, by Frequency Range 2019 & 2032
  96. Table 96: Global RF Connectors Market Volume K Tons Forecast, by Frequency Range 2019 & 2032
  97. Table 97: Global RF Connectors Market Revenue Billion Forecast, by Mounting Type 2019 & 2032
  98. Table 98: Global RF Connectors Market Volume K Tons Forecast, by Mounting Type 2019 & 2032
  99. Table 99: Global RF Connectors Market Revenue Billion Forecast, by Material 2019 & 2032
  100. Table 100: Global RF Connectors Market Volume K Tons Forecast, by Material 2019 & 2032
  101. Table 101: Global RF Connectors Market Revenue Billion Forecast, by Plating 2019 & 2032
  102. Table 102: Global RF Connectors Market Volume K Tons Forecast, by Plating 2019 & 2032
  103. Table 103: Global RF Connectors Market Revenue Billion Forecast, by Application 2019 & 2032
  104. Table 104: Global RF Connectors Market Volume K Tons Forecast, by Application 2019 & 2032
  105. Table 105: Global RF Connectors Market Revenue Billion Forecast, by End-use Industry 2019 & 2032
  106. Table 106: Global RF Connectors Market Volume K Tons Forecast, by End-use Industry 2019 & 2032
  107. Table 107: Global RF Connectors Market Revenue Billion Forecast, by Country 2019 & 2032
  108. Table 108: Global RF Connectors Market Volume K Tons Forecast, by Country 2019 & 2032
  109. Table 109: Brazil RF Connectors Market Revenue (Billion) Forecast, by Application 2019 & 2032
  110. Table 110: Brazil RF Connectors Market Volume (K Tons) Forecast, by Application 2019 & 2032
  111. Table 111: Mexico RF Connectors Market Revenue (Billion) Forecast, by Application 2019 & 2032
  112. Table 112: Mexico RF Connectors Market Volume (K Tons) Forecast, by Application 2019 & 2032
  113. Table 113: Global RF Connectors Market Revenue Billion Forecast, by Product Type 2019 & 2032
  114. Table 114: Global RF Connectors Market Volume K Tons Forecast, by Product Type 2019 & 2032
  115. Table 115: Global RF Connectors Market Revenue Billion Forecast, by Frequency Range 2019 & 2032
  116. Table 116: Global RF Connectors Market Volume K Tons Forecast, by Frequency Range 2019 & 2032
  117. Table 117: Global RF Connectors Market Revenue Billion Forecast, by Mounting Type 2019 & 2032
  118. Table 118: Global RF Connectors Market Volume K Tons Forecast, by Mounting Type 2019 & 2032
  119. Table 119: Global RF Connectors Market Revenue Billion Forecast, by Material 2019 & 2032
  120. Table 120: Global RF Connectors Market Volume K Tons Forecast, by Material 2019 & 2032
  121. Table 121: Global RF Connectors Market Revenue Billion Forecast, by Plating 2019 & 2032
  122. Table 122: Global RF Connectors Market Volume K Tons Forecast, by Plating 2019 & 2032
  123. Table 123: Global RF Connectors Market Revenue Billion Forecast, by Application 2019 & 2032
  124. Table 124: Global RF Connectors Market Volume K Tons Forecast, by Application 2019 & 2032
  125. Table 125: Global RF Connectors Market Revenue Billion Forecast, by End-use Industry 2019 & 2032
  126. Table 126: Global RF Connectors Market Volume K Tons Forecast, by End-use Industry 2019 & 2032
  127. Table 127: Global RF Connectors Market Revenue Billion Forecast, by Country 2019 & 2032
  128. Table 128: Global RF Connectors Market Volume K Tons Forecast, by Country 2019 & 2032
  129. Table 129: UAE RF Connectors Market Revenue (Billion) Forecast, by Application 2019 & 2032
  130. Table 130: UAE RF Connectors Market Volume (K Tons) Forecast, by Application 2019 & 2032
  131. Table 131: Saudi Arabia RF Connectors Market Revenue (Billion) Forecast, by Application 2019 & 2032
  132. Table 132: Saudi Arabia RF Connectors Market Volume (K Tons) Forecast, by Application 2019 & 2032
  133. Table 133: South Africa RF Connectors Market Revenue (Billion) Forecast, by Application 2019 & 2032
  134. Table 134: South Africa RF Connectors Market Volume (K Tons) Forecast, by Application 2019 & 2032


STEP 1 - Identification of Relevant Samples Size from Population Database

Step Chart
bar chart
method chart

STEP 2 - Approaches for Defining Global Market Size (Value, Volume* & Price*)

approach chart
Top-down and bottom-up approaches are used to validate the global market size and estimate the market size for manufactures, regional segemnts, product and application.

Note* : In applicable scenarios

STEP 3 - Data Sources

Primary Research

  • Web Analytics
  • Survey Reports
  • Research Institute
  • Latest Research Reports
  • Opinion Leaders

Secondary Research

  • Annual Reports
  • White Paper
  • Latest Press Release
  • Industry Association
  • Paid Database
  • Investor Presentations
approach chart

STEP 4 - Data Triangulation

Involves using different sources of information in order to increase the validity of a study

These sources are likely to be stakeholders in a program - participants, other researchers, program staff, other community members, and so on.

Then we put all data in single framework & apply various statistical tools to find out the dynamic on the market.

During the analysis stage, feedback from the stakeholder groups would be compared to determine areas of agreement as well as areas of divergence

Additionally after gathering mix and scattered data from wide range of sources, data is triangull- ated and correlated to come up with estimated figures which are further validated through primary mediums, or industry experts, opinion leader.

Frequently Asked Questions

1. What is the projected Compound Annual Growth Rate (CAGR) of the RF Connectors Market?

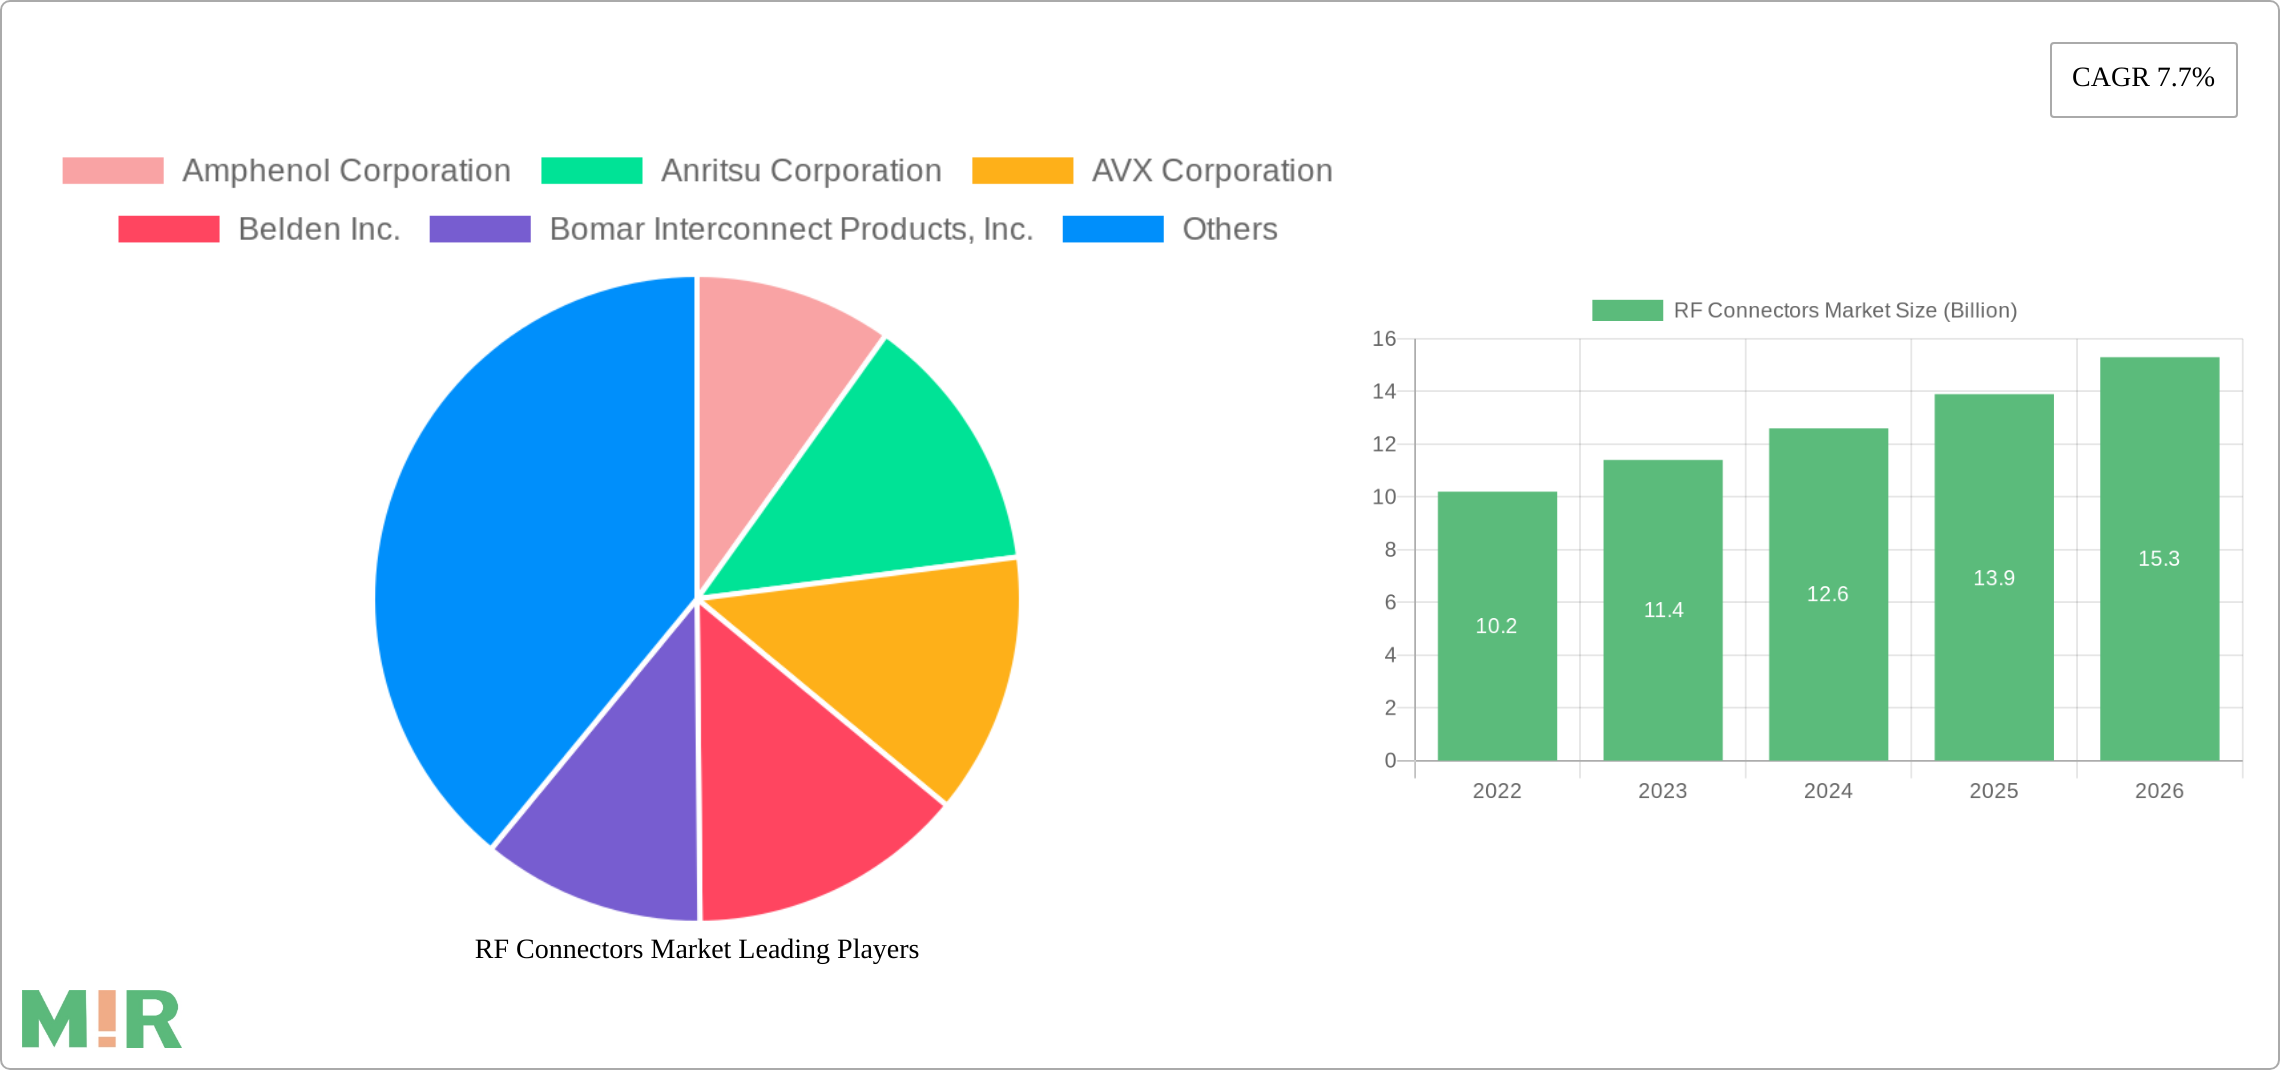
The projected CAGR is approximately 7.7%.

2. Which companies are prominent players in the RF Connectors Market?

Key companies in the market include Amphenol Corporation, Anritsu Corporation, AVX Corporation, Belden Inc., Bomar Interconnect Products, Inc., Carlisle Interconnect Technologies, Corning Optical Communications, Delta Electronics, Inc., Digi-Key Electronics, Hirose Electric Co., Ltd., HUBER+SUHNER, JAE (Japan Aviation Electronics Industry, Ltd.), Johanson Technology, Inc., L-com Global Connectivity, Molex, LLC, Pasternack Enterprises Inc., Radiall SA, RF Industries, Ltd., Rosenberger Hochfrequenztechnik GmbH & Co. KG, Samtec Inc., Smiths Interconnect, TE Connectivity Ltd., W.L. Gore & Associates, Inc..

3. What are the main segments of the RF Connectors Market?

The market segments include Product Type, Frequency Range, Mounting Type, Material, Plating, Application, End-use Industry.

4. Can you provide details about the market size?

The market size is estimated to be USD 32 Billion as of 2022.

5. What are some drivers contributing to market growth?

Expansion of 112G PAM4 connectivity into enterprise networks. Increased investment in modern communication networks. Increased demand for reliable connectivity solutions. Adoption in V2X and ADAS technologies. Need for high-performance. rugged connectors.

6. What are the notable trends driving market growth?

N/A

7. Are there any restraints impacting market growth?

Advanced designs require specialized expertise and resources. Intense competition leads to pricing pressures.

8. Can you provide examples of recent developments in the market?

In August 2023, Pasternack, an Infinite Electronics brand and a leading provider of RF, microwave and millimeter-wave products, has announced a new series of hermetically sealed RF connectors and adapters designed to meet the stringent requirements of military and defense applications.

9. What pricing options are available for accessing the report?

Pricing options include single-user, multi-user, and enterprise licenses priced at USD 4,850, USD 5,350, and USD 8,350 respectively.

10. Is the market size provided in terms of value or volume?

The market size is provided in terms of value, measured in Billion and volume, measured in K Tons.

11. Are there any specific market keywords associated with the report?

Yes, the market keyword associated with the report is "RF Connectors Market," which aids in identifying and referencing the specific market segment covered.

12. How do I determine which pricing option suits my needs best?

The pricing options vary based on user requirements and access needs. Individual users may opt for single-user licenses, while businesses requiring broader access may choose multi-user or enterprise licenses for cost-effective access to the report.

13. Are there any additional resources or data provided in the RF Connectors Market report?

While the report offers comprehensive insights, it's advisable to review the specific contents or supplementary materials provided to ascertain if additional resources or data are available.

14. How can I stay updated on further developments or reports in the RF Connectors Market?

To stay informed about further developments, trends, and reports in the RF Connectors Market, consider subscribing to industry newsletters, following relevant companies and organizations, or regularly checking reputable industry news sources and publications.

Discover the Latest Market Insight Reports

Access in-depth insights on industries, companies, trends, and global markets. Our expertly curated reports provide the most relevant data and analysis in a condensed, easy-to-read format.

shop image 1

About Market Insights Report

Market Insights Reports offers comprehensive market research reports and analysis, giving businesses important information about their clients, rivals, and sector to help them make well-informed decisions on operations, marketing, and business strategy. We offer a variety of services in addition to market research, data analysis, and strategy planning. In order to find opportunities and learn more about our competitors and the industry at large, we employ competitive analysis. To identify areas for development, we also evaluate our performance against that of our rivals. We can determine the places at which we can offer our clients the most value by performing value chain analysis.

Additionally, clients receive a thorough overview of their industry business environment. We can find trends that help us forecast future possibilities and threats by examining global macroeconomic dynamics and consumer behavior patterns. By analyzing their features and advantages, contrasting them with comparable items on the market, and evaluating both their quantitative and qualitative performance, we comprehensively evaluate our clients' products. This allows us to assist customers in determining how their goods compare to those of their rivals and in creating successful marketing plans. Our group has been successful in gaining a thorough grasp of our clients' requirements and offering them creative solutions. We currently provide services to more than 50 nations in Europe, the Middle East, Africa, Latin America, Asia Pacific, and North America. Because of our global reach, we have been able to establish trusting bonds with our partners and clients in various nations, improving customer service and forging a more cohesive worldwide presence.

We use cookies to enhance your experience.

By clicking "Accept All", you consent to the use of all cookies.

Customize your preferences or read our Cookie Policy.