Report banner
Smart Sensor Market
Updated On

Feb 22 2025

Total Pages

200

Smart Sensor Market Dynamics and Forecasts: 2025-2033 Strategic Insights

Smart Sensor Market by Technology (MEM, CMOS, Others), by Network (Wired, Wireless), by Application (Commercial/Industrial Building, Residential Building/Smart Homes, Consumer Electronics, Automotive, Oil & Gas, Aerospace & Defense, Others), by North America (U.S., Canada), by Europe (Germany, UK, France, Italy, Russia, Rest of Europe), by Asia Pacific (China, Japan, India, South Korea, Thailand, Rest of Asia Pacific), by Latin America (Brazil, Mexico, Argentina, Rest of Latin America), by MEA (GCC, South Africa, Rest of MEA) Forecast 2025-2033

Publisher Logo

Smart Sensor Market Dynamics and Forecasts: 2025-2033 Strategic Insights


Key Insights

The size of the Smart Sensor Market was valued at USD 45.4 Billion in 2024 and is projected to reach USD 126.01 Billion by 2033, with an expected CAGR of 15.7% during the forecast period.This growth is driven by the increasing adoption of smart sensors across industries, fueled by their benefits such as enhanced safety, improved efficiency, seamless connectivity, and cost reduction. The rising integration of Artificial Intelligence (AI) and the Internet of Things (IoT) has further accelerated demand, enabling real-time data collection, predictive maintenance, and automation. Government initiatives promoting smart cities and buildings also contribute to market expansion, as these sensors play a crucial role in energy-efficient infrastructure and environmental monitoring. Industries such as automotive, healthcare, consumer electronics, and industrial automation are rapidly incorporating smart sensor technologies to enhance performance and user experience. With continuous technological advancements and increasing awareness of energy efficiency, the smart sensor market is expected to witness sustained growth over the coming years.

Smart Sensor Market Research Report - Market Size, Growth & Forecast

Smart Sensor Market Concentration & Characteristics

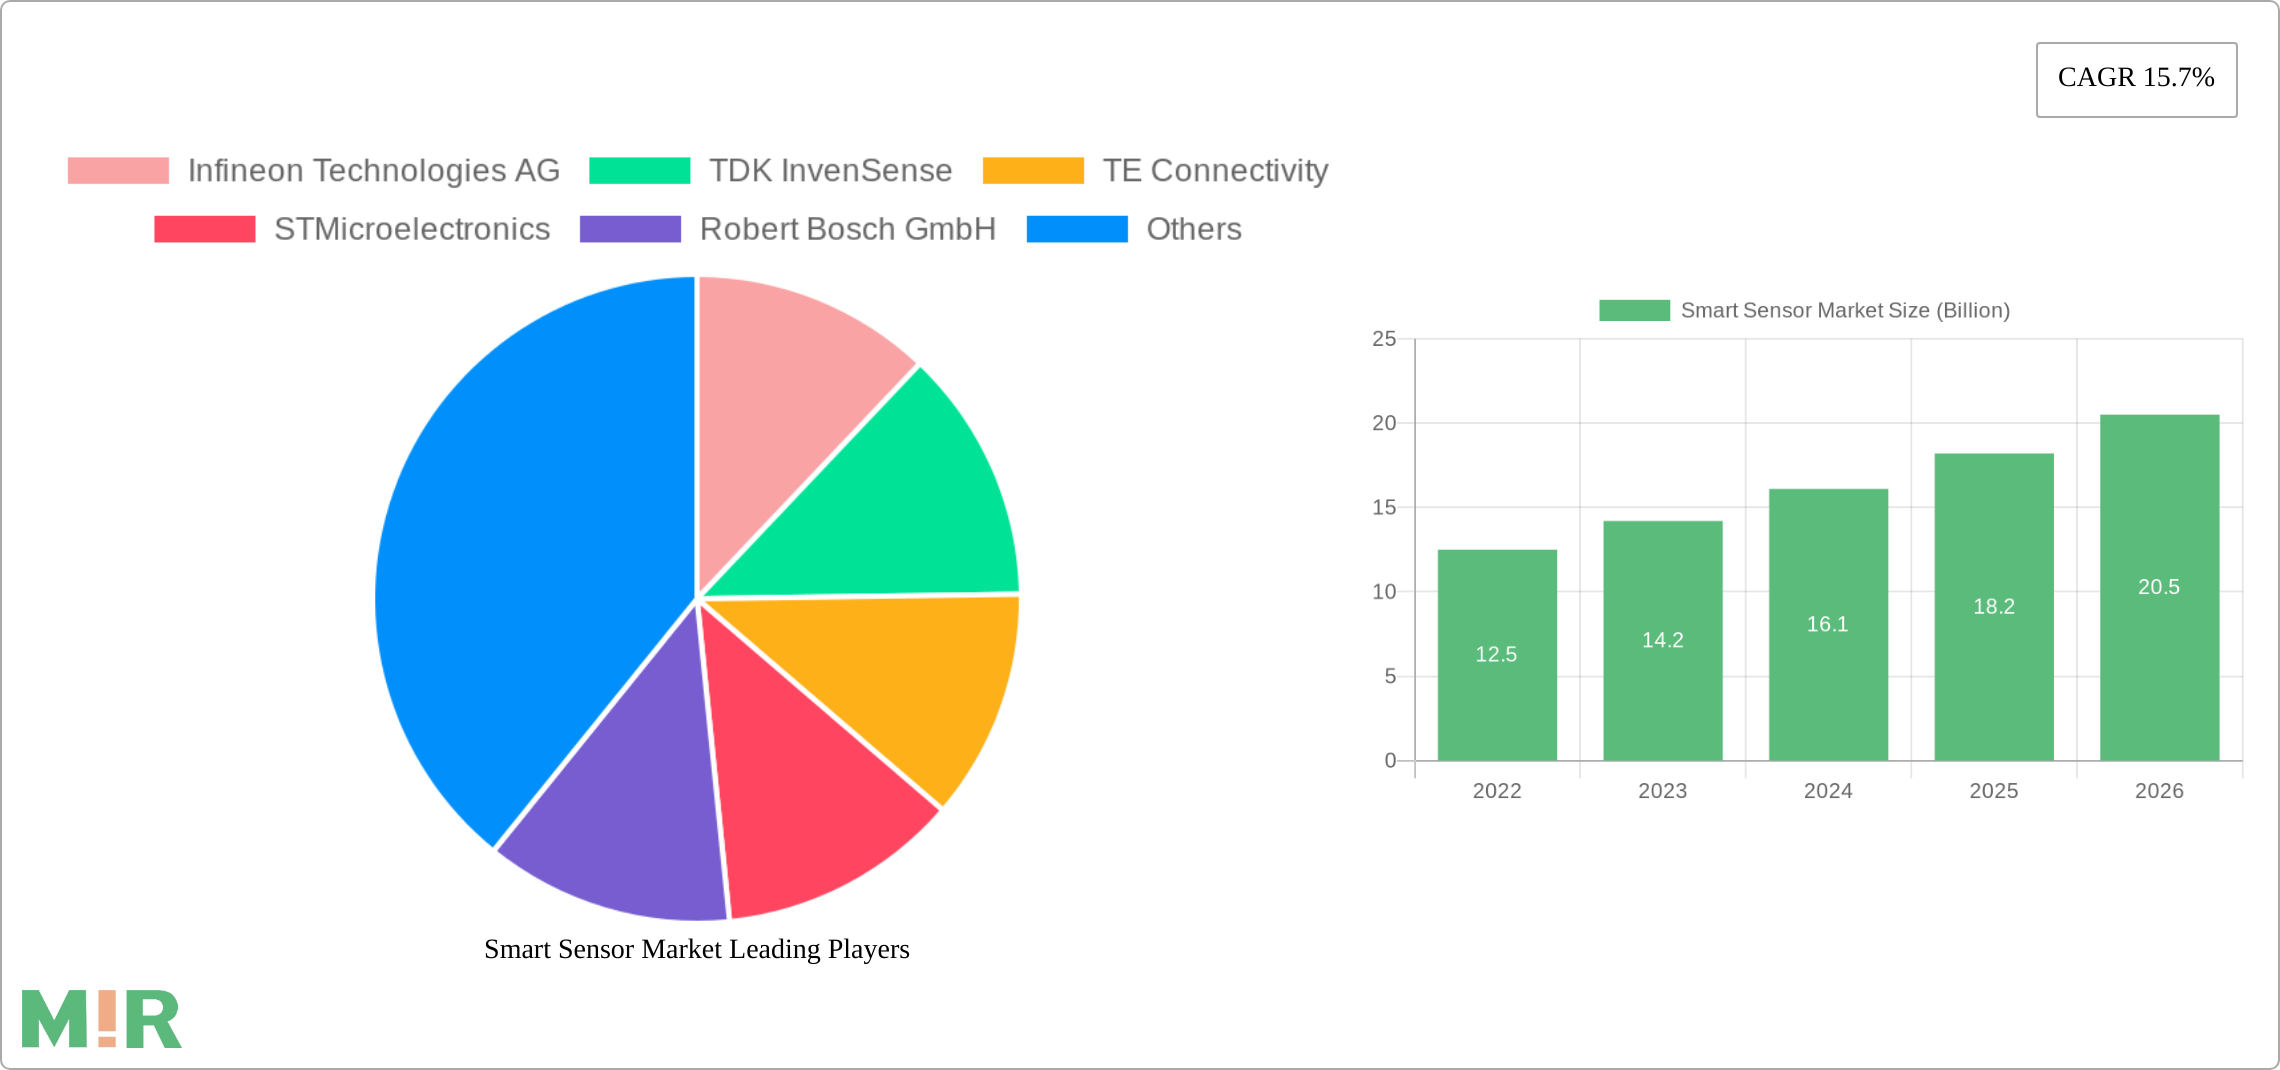
The Smart Sensor Market is characterized by a fragmented competitive landscape with numerous global and regional players. Key players in the market include Infineon Technologies AG, TDK InvenSense, TE Connectivity, STMicroelectronics, Robert Bosch GmbH, Emerson Electric Co., and NXP Semiconductors N.V. These companies are investing heavily in research and development to introduce innovative products and technologies.

The market is also influenced by factors such as government regulations, product substitutes, end-user concentration, and merger and acquisition activities. Regulations related to data privacy and security, environmental concerns, and industry standards can impact the market landscape. Product substitutes, such as traditional sensors, may pose competition, while the growing adoption of smart sensors in various industries is expected to reduce the market share of substitutes. End-user concentration in industries like automotive, consumer electronics, and industrial automation can influence market dynamics. M&A activities in the market can lead to consolidation, product portfolio expansion, and enhanced market share.

Smart Sensor Market Trends

Key market insights include the rising demand for smart sensors in the automotive sector, driven by the adoption of ADAS and autonomous vehicles. The increasing popularity of smart homes and connected devices is also contributing to market growth, as smart sensors enable home automation, security, and energy management. Furthermore, advancements in AI and IoT technologies are enhancing the capabilities of smart sensors, leading to the development of more intelligent and efficient sensor systems.

Smart Sensor Market Growth

Key Region or Country & Segment to Dominate the Market

The Asia Pacific region is anticipated to dominate the Smart Sensor Market due to the presence of rapidly growing economies, such as China and India, where there is a surge in demand for smart cities and industries. The MEMS segment is projected to hold a significant share of the market due to its cost-effectiveness, low power consumption, and extensive use in various applications.

Smart Sensor Market Product Insights Report Coverage & Deliverables

The Smart Sensor Market Product Insights Report provides comprehensive coverage of the market, including detailed analysis of products, technologies, applications, and industry trends. The report offers valuable insights into market size, market share, and growth rates for various product segments. It also includes competitive analysis, SWOT analysis, and Porter's Five Forces analysis to provide a thorough understanding of the market dynamics.

Smart Sensor Market Analysis

The Smart Sensor Market has witnessed steady growth in recent years and is expected to continue its upward trajectory. The market size is projected to reach approximately 45.4 Billion by 2032, exhibiting a CAGR of 15.7% from 2023 to 2032. The market share is anticipated to be dominated by MEMS and CMOS technologies, with MEMS sensors accounting for a larger share due to their cost-effectiveness and low power consumption.

Smart Sensor Market Regional Insights

  • North America: The United States and Canada are key markets for smart sensors due to the presence of major automotive, consumer electronics, and industrial automation companies.
  • Europe: Germany, the United Kingdom, and France are significant markets, driven by government initiatives and the increasing adoption of smart sensors in various industries.
  • Asia Pacific: China, Japan, and India are rapidly growing markets for smart sensors, fueled by infrastructure development, smart city initiatives, and growing demand from the automotive and consumer electronics sectors.
  • Latin America: Brazil and Mexico are key markets in Latin America, with growing demand for smart sensors in industries such as oil and gas and automotive.
  • MEA: The Gulf Cooperation Council (GCC) countries, particularly Saudi Arabia and the United Arab Emirates, are witnessing significant growth in the smart sensor market due to investments in smart infrastructure and urban development.

Driving Forces: What's Propelling the Smart Sensor Market

  • Technological Advancements: The evolution of AI, IoT, and cloud computing is enhancing the capabilities of smart sensors, leading to the development of more intelligent and efficient sensor systems.
  • Increased Demand for Smart Devices: The growing adoption of smart devices, such as smartphones, smart homes, and wearable devices, is driving the demand for smart sensors.
  • Government Initiatives: Governments worldwide are promoting smart city initiatives and encouraging the adoption of smart technologies, including smart sensors.

Challenges and Restraints in Smart Sensor Market

  • High Cost: The development and integration of smart sensors can be expensive, especially in complex systems.
  • Data Privacy and Security Concerns: Smart sensors collect and transmit data, raising concerns about privacy and security.
  • Standardization Issues: The lack of standardized communication protocols and data formats can hinder the interoperability of smart sensors from different manufacturers.

Emerging Trends in Smart Sensor Market

  • Sensor Fusion: Combining data from multiple sensors to create a more comprehensive and accurate representation of the environment.
  • Edge Computing: Processing data at the sensor level, reducing latency and improving efficiency.
  • Predictive Analytics: Using AI and machine learning to analyze sensor data and predict future events.

Smart Sensor Industry News

In October 2021, ABB introduced its new FusionAir Smart Sensor, a touch-free room sensor that helps improve indoor air quality by monitoring temperature, humidity, carbon dioxide, and volatile organic compounds (VOCs).

Leading Players in the Smart Sensor Market

Smart Sensor Market Segmentation

  • 1. Technology
    • 1.1. MEMS
    • 1.2. CMOS
    • 1.3. Others
  • 2. Network
    • 2.1. Wired
    • 2.2. Wireless
  • 3. Application
    • 3.1. Commercial/Industrial Building
    • 3.2. Residential Building/Smart Homes
    • 3.3. Consumer Electronics
    • 3.4. Automotive
    • 3.5. Oil & Gas
    • 3.6. Aerospace & Defense
    • 3.7. Others

Smart ensor Market Segmentation By Geography

  • 1. North America
    • 1.1. U.S.
    • 1.2. Canada
  • 2. Europe
    • 2.1. Germany
    • 2.2. UK
    • 2.3. France
    • 2.4. Italy
    • 2.5. Russia
    • 2.6. Rest of Europe
  • 3. Asia Pacific
    • 3.1. China
    • 3.2. Japan
    • 3.3. India
    • 3.4. South Korea
    • 3.5. Thailand
    • 3.6. Rest of Asia Pacific
  • 4. Latin America
    • 4.1. Brazil
    • 4.2. Mexico
    • 4.3. Argentina
    • 4.4. Rest of Latin America
  • 5. MEA
    • 5.1. GCC
    • 5.2. South Africa
    • 5.3. Rest of MEA

Smart Sensor Market Regional Share


Smart Sensor Market REPORT HIGHLIGHTS

AspectsDetails
Study Period 2019-2033
Base Year 2024
Estimated Year 2025
Forecast Period2025-2033
Historical Period2019-2024
Growth RateCAGR of 15.7% from 2019-2033
Segmentation
    • By Technology
      • MEM
      • CMOS
      • Others
    • By Network
      • Wired
      • Wireless
    • By Application
      • Commercial/Industrial Building
      • Residential Building/Smart Homes
      • Consumer Electronics
      • Automotive
      • Oil & Gas
      • Aerospace & Defense
      • Others
  • By Geography
    • North America
      • U.S.
      • Canada
    • Europe
      • Germany
      • UK
      • France
      • Italy
      • Russia
      • Rest of Europe
    • Asia Pacific
      • China
      • Japan
      • India
      • South Korea
      • Thailand
      • Rest of Asia Pacific
    • Latin America
      • Brazil
      • Mexico
      • Argentina
      • Rest of Latin America
    • MEA
      • GCC
      • South Africa
      • Rest of MEA


Table of Contents

  1. 1. Introduction
    • 1.1. Research Scope
    • 1.2. Market Segmentation
    • 1.3. Research Methodology
    • 1.4. Definitions and Assumptions
  2. 2. Executive Summary
    • 2.1. Introduction
  3. 3. Market Dynamics
    • 3.1. Introduction
      • 3.2. Market Drivers
        • 3.2.1 Surging demand for smart wearables in the healthcare sector
        • 3.2.2 Rising electrification in automobiles
        • 3.2.3 Growing investments in the oil & gas industry
        • 3.2.4 Rising trend of industrial automation and Industry 4.0
        • 3.2.5 Propelling demand for advanced security systems in smart homes
      • 3.3. Market Restrains
        • 3.3.1 Low Availability of raw materials for smart sensors
        • 3.3.2 High maintenance cost of smart sensors
      • 3.4. Market Trends
        • 3.4.1 Key market insights include the rising demand for smart sensors in the automotive sector
        • 3.4.2 driven by the adoption of ADAS and autonomous vehicles. The increasing popularity of smart homes and connected devices is also contributing to market growth
        • 3.4.3 as smart sensors enable home automation
        • 3.4.4 security
        • 3.4.5 and energy management. Furthermore
        • 3.4.6 advancements in AI and IoT technologies are enhancing the capabilities of smart sensors
        • 3.4.7 leading to the development of more intelligent and efficient sensor systems.
  4. 4. Market Factor Analysis
    • 4.1. Porters Five Forces
    • 4.2. Supply/Value Chain
    • 4.3. PESTEL analysis
    • 4.4. Market Entropy
    • 4.5. Patent/Trademark Analysis
  5. 5. Global Smart Sensor Market Analysis, Insights and Forecast, 2019-2031
    • 5.1. Market Analysis, Insights and Forecast - by Technology
      • 5.1.1. MEM
      • 5.1.2. CMOS
      • 5.1.3. Others
    • 5.2. Market Analysis, Insights and Forecast - by Network
      • 5.2.1. Wired
      • 5.2.2. Wireless
    • 5.3. Market Analysis, Insights and Forecast - by Application
      • 5.3.1. Commercial/Industrial Building
      • 5.3.2. Residential Building/Smart Homes
      • 5.3.3. Consumer Electronics
      • 5.3.4. Automotive
      • 5.3.5. Oil & Gas
      • 5.3.6. Aerospace & Defense
      • 5.3.7. Others
    • 5.4. Market Analysis, Insights and Forecast - by Region
      • 5.4.1. North America
      • 5.4.2. Europe
      • 5.4.3. Asia Pacific
      • 5.4.4. Latin America
      • 5.4.5. MEA
  6. 6. North America Smart Sensor Market Analysis, Insights and Forecast, 2019-2031
    • 6.1. Market Analysis, Insights and Forecast - by Technology
      • 6.1.1. MEM
      • 6.1.2. CMOS
      • 6.1.3. Others
    • 6.2. Market Analysis, Insights and Forecast - by Network
      • 6.2.1. Wired
      • 6.2.2. Wireless
    • 6.3. Market Analysis, Insights and Forecast - by Application
      • 6.3.1. Commercial/Industrial Building
      • 6.3.2. Residential Building/Smart Homes
      • 6.3.3. Consumer Electronics
      • 6.3.4. Automotive
      • 6.3.5. Oil & Gas
      • 6.3.6. Aerospace & Defense
      • 6.3.7. Others
  7. 7. Europe Smart Sensor Market Analysis, Insights and Forecast, 2019-2031
    • 7.1. Market Analysis, Insights and Forecast - by Technology
      • 7.1.1. MEM
      • 7.1.2. CMOS
      • 7.1.3. Others
    • 7.2. Market Analysis, Insights and Forecast - by Network
      • 7.2.1. Wired
      • 7.2.2. Wireless
    • 7.3. Market Analysis, Insights and Forecast - by Application
      • 7.3.1. Commercial/Industrial Building
      • 7.3.2. Residential Building/Smart Homes
      • 7.3.3. Consumer Electronics
      • 7.3.4. Automotive
      • 7.3.5. Oil & Gas
      • 7.3.6. Aerospace & Defense
      • 7.3.7. Others
  8. 8. Asia Pacific Smart Sensor Market Analysis, Insights and Forecast, 2019-2031
    • 8.1. Market Analysis, Insights and Forecast - by Technology
      • 8.1.1. MEM
      • 8.1.2. CMOS
      • 8.1.3. Others
    • 8.2. Market Analysis, Insights and Forecast - by Network
      • 8.2.1. Wired
      • 8.2.2. Wireless
    • 8.3. Market Analysis, Insights and Forecast - by Application
      • 8.3.1. Commercial/Industrial Building
      • 8.3.2. Residential Building/Smart Homes
      • 8.3.3. Consumer Electronics
      • 8.3.4. Automotive
      • 8.3.5. Oil & Gas
      • 8.3.6. Aerospace & Defense
      • 8.3.7. Others
  9. 9. Latin America Smart Sensor Market Analysis, Insights and Forecast, 2019-2031
    • 9.1. Market Analysis, Insights and Forecast - by Technology
      • 9.1.1. MEM
      • 9.1.2. CMOS
      • 9.1.3. Others
    • 9.2. Market Analysis, Insights and Forecast - by Network
      • 9.2.1. Wired
      • 9.2.2. Wireless
    • 9.3. Market Analysis, Insights and Forecast - by Application
      • 9.3.1. Commercial/Industrial Building
      • 9.3.2. Residential Building/Smart Homes
      • 9.3.3. Consumer Electronics
      • 9.3.4. Automotive
      • 9.3.5. Oil & Gas
      • 9.3.6. Aerospace & Defense
      • 9.3.7. Others
  10. 10. MEA Smart Sensor Market Analysis, Insights and Forecast, 2019-2031
    • 10.1. Market Analysis, Insights and Forecast - by Technology
      • 10.1.1. MEM
      • 10.1.2. CMOS
      • 10.1.3. Others
    • 10.2. Market Analysis, Insights and Forecast - by Network
      • 10.2.1. Wired
      • 10.2.2. Wireless
    • 10.3. Market Analysis, Insights and Forecast - by Application
      • 10.3.1. Commercial/Industrial Building
      • 10.3.2. Residential Building/Smart Homes
      • 10.3.3. Consumer Electronics
      • 10.3.4. Automotive
      • 10.3.5. Oil & Gas
      • 10.3.6. Aerospace & Defense
      • 10.3.7. Others
  11. 11. Competitive Analysis
    • 11.1. Global Market Share Analysis 2024
      • 11.2. Company Profiles
        • 11.2.1 Infineon Technologies AG
          • 11.2.1.1. Overview
          • 11.2.1.2. Products
          • 11.2.1.3. SWOT Analysis
          • 11.2.1.4. Recent Developments
          • 11.2.1.5. Financials (Based on Availability)
        • 11.2.2 TDK InvenSense
          • 11.2.2.1. Overview
          • 11.2.2.2. Products
          • 11.2.2.3. SWOT Analysis
          • 11.2.2.4. Recent Developments
          • 11.2.2.5. Financials (Based on Availability)
        • 11.2.3 TE Connectivity
          • 11.2.3.1. Overview
          • 11.2.3.2. Products
          • 11.2.3.3. SWOT Analysis
          • 11.2.3.4. Recent Developments
          • 11.2.3.5. Financials (Based on Availability)
        • 11.2.4 STMicroelectronics
          • 11.2.4.1. Overview
          • 11.2.4.2. Products
          • 11.2.4.3. SWOT Analysis
          • 11.2.4.4. Recent Developments
          • 11.2.4.5. Financials (Based on Availability)
        • 11.2.5 Robert Bosch GmbH
          • 11.2.5.1. Overview
          • 11.2.5.2. Products
          • 11.2.5.3. SWOT Analysis
          • 11.2.5.4. Recent Developments
          • 11.2.5.5. Financials (Based on Availability)
        • 11.2.6 Emerson Electric Co.
          • 11.2.6.1. Overview
          • 11.2.6.2. Products
          • 11.2.6.3. SWOT Analysis
          • 11.2.6.4. Recent Developments
          • 11.2.6.5. Financials (Based on Availability)
        • 11.2.7 NXP Semiconductors N.V
          • 11.2.7.1. Overview
          • 11.2.7.2. Products
          • 11.2.7.3. SWOT Analysis
          • 11.2.7.4. Recent Developments
          • 11.2.7.5. Financials (Based on Availability)

List of Figures

  1. Figure 1: Global Smart Sensor Market Revenue Breakdown (Billion, %) by Region 2024 & 2032
  2. Figure 2: Global Smart Sensor Market Volume Breakdown (units, %) by Region 2024 & 2032
  3. Figure 3: North America Smart Sensor Market Revenue (Billion), by Technology 2024 & 2032
  4. Figure 4: North America Smart Sensor Market Volume (units), by Technology 2024 & 2032
  5. Figure 5: North America Smart Sensor Market Revenue Share (%), by Technology 2024 & 2032
  6. Figure 6: North America Smart Sensor Market Volume Share (%), by Technology 2024 & 2032
  7. Figure 7: North America Smart Sensor Market Revenue (Billion), by Network 2024 & 2032
  8. Figure 8: North America Smart Sensor Market Volume (units), by Network 2024 & 2032
  9. Figure 9: North America Smart Sensor Market Revenue Share (%), by Network 2024 & 2032
  10. Figure 10: North America Smart Sensor Market Volume Share (%), by Network 2024 & 2032
  11. Figure 11: North America Smart Sensor Market Revenue (Billion), by Application 2024 & 2032
  12. Figure 12: North America Smart Sensor Market Volume (units), by Application 2024 & 2032
  13. Figure 13: North America Smart Sensor Market Revenue Share (%), by Application 2024 & 2032
  14. Figure 14: North America Smart Sensor Market Volume Share (%), by Application 2024 & 2032
  15. Figure 15: North America Smart Sensor Market Revenue (Billion), by Country 2024 & 2032
  16. Figure 16: North America Smart Sensor Market Volume (units), by Country 2024 & 2032
  17. Figure 17: North America Smart Sensor Market Revenue Share (%), by Country 2024 & 2032
  18. Figure 18: North America Smart Sensor Market Volume Share (%), by Country 2024 & 2032
  19. Figure 19: Europe Smart Sensor Market Revenue (Billion), by Technology 2024 & 2032
  20. Figure 20: Europe Smart Sensor Market Volume (units), by Technology 2024 & 2032
  21. Figure 21: Europe Smart Sensor Market Revenue Share (%), by Technology 2024 & 2032
  22. Figure 22: Europe Smart Sensor Market Volume Share (%), by Technology 2024 & 2032
  23. Figure 23: Europe Smart Sensor Market Revenue (Billion), by Network 2024 & 2032
  24. Figure 24: Europe Smart Sensor Market Volume (units), by Network 2024 & 2032
  25. Figure 25: Europe Smart Sensor Market Revenue Share (%), by Network 2024 & 2032
  26. Figure 26: Europe Smart Sensor Market Volume Share (%), by Network 2024 & 2032
  27. Figure 27: Europe Smart Sensor Market Revenue (Billion), by Application 2024 & 2032
  28. Figure 28: Europe Smart Sensor Market Volume (units), by Application 2024 & 2032
  29. Figure 29: Europe Smart Sensor Market Revenue Share (%), by Application 2024 & 2032
  30. Figure 30: Europe Smart Sensor Market Volume Share (%), by Application 2024 & 2032
  31. Figure 31: Europe Smart Sensor Market Revenue (Billion), by Country 2024 & 2032
  32. Figure 32: Europe Smart Sensor Market Volume (units), by Country 2024 & 2032
  33. Figure 33: Europe Smart Sensor Market Revenue Share (%), by Country 2024 & 2032
  34. Figure 34: Europe Smart Sensor Market Volume Share (%), by Country 2024 & 2032
  35. Figure 35: Asia Pacific Smart Sensor Market Revenue (Billion), by Technology 2024 & 2032
  36. Figure 36: Asia Pacific Smart Sensor Market Volume (units), by Technology 2024 & 2032
  37. Figure 37: Asia Pacific Smart Sensor Market Revenue Share (%), by Technology 2024 & 2032
  38. Figure 38: Asia Pacific Smart Sensor Market Volume Share (%), by Technology 2024 & 2032
  39. Figure 39: Asia Pacific Smart Sensor Market Revenue (Billion), by Network 2024 & 2032
  40. Figure 40: Asia Pacific Smart Sensor Market Volume (units), by Network 2024 & 2032
  41. Figure 41: Asia Pacific Smart Sensor Market Revenue Share (%), by Network 2024 & 2032
  42. Figure 42: Asia Pacific Smart Sensor Market Volume Share (%), by Network 2024 & 2032
  43. Figure 43: Asia Pacific Smart Sensor Market Revenue (Billion), by Application 2024 & 2032
  44. Figure 44: Asia Pacific Smart Sensor Market Volume (units), by Application 2024 & 2032
  45. Figure 45: Asia Pacific Smart Sensor Market Revenue Share (%), by Application 2024 & 2032
  46. Figure 46: Asia Pacific Smart Sensor Market Volume Share (%), by Application 2024 & 2032
  47. Figure 47: Asia Pacific Smart Sensor Market Revenue (Billion), by Country 2024 & 2032
  48. Figure 48: Asia Pacific Smart Sensor Market Volume (units), by Country 2024 & 2032
  49. Figure 49: Asia Pacific Smart Sensor Market Revenue Share (%), by Country 2024 & 2032
  50. Figure 50: Asia Pacific Smart Sensor Market Volume Share (%), by Country 2024 & 2032
  51. Figure 51: Latin America Smart Sensor Market Revenue (Billion), by Technology 2024 & 2032
  52. Figure 52: Latin America Smart Sensor Market Volume (units), by Technology 2024 & 2032
  53. Figure 53: Latin America Smart Sensor Market Revenue Share (%), by Technology 2024 & 2032
  54. Figure 54: Latin America Smart Sensor Market Volume Share (%), by Technology 2024 & 2032
  55. Figure 55: Latin America Smart Sensor Market Revenue (Billion), by Network 2024 & 2032
  56. Figure 56: Latin America Smart Sensor Market Volume (units), by Network 2024 & 2032
  57. Figure 57: Latin America Smart Sensor Market Revenue Share (%), by Network 2024 & 2032
  58. Figure 58: Latin America Smart Sensor Market Volume Share (%), by Network 2024 & 2032
  59. Figure 59: Latin America Smart Sensor Market Revenue (Billion), by Application 2024 & 2032
  60. Figure 60: Latin America Smart Sensor Market Volume (units), by Application 2024 & 2032
  61. Figure 61: Latin America Smart Sensor Market Revenue Share (%), by Application 2024 & 2032
  62. Figure 62: Latin America Smart Sensor Market Volume Share (%), by Application 2024 & 2032
  63. Figure 63: Latin America Smart Sensor Market Revenue (Billion), by Country 2024 & 2032
  64. Figure 64: Latin America Smart Sensor Market Volume (units), by Country 2024 & 2032
  65. Figure 65: Latin America Smart Sensor Market Revenue Share (%), by Country 2024 & 2032
  66. Figure 66: Latin America Smart Sensor Market Volume Share (%), by Country 2024 & 2032
  67. Figure 67: MEA Smart Sensor Market Revenue (Billion), by Technology 2024 & 2032
  68. Figure 68: MEA Smart Sensor Market Volume (units), by Technology 2024 & 2032
  69. Figure 69: MEA Smart Sensor Market Revenue Share (%), by Technology 2024 & 2032
  70. Figure 70: MEA Smart Sensor Market Volume Share (%), by Technology 2024 & 2032
  71. Figure 71: MEA Smart Sensor Market Revenue (Billion), by Network 2024 & 2032
  72. Figure 72: MEA Smart Sensor Market Volume (units), by Network 2024 & 2032
  73. Figure 73: MEA Smart Sensor Market Revenue Share (%), by Network 2024 & 2032
  74. Figure 74: MEA Smart Sensor Market Volume Share (%), by Network 2024 & 2032
  75. Figure 75: MEA Smart Sensor Market Revenue (Billion), by Application 2024 & 2032
  76. Figure 76: MEA Smart Sensor Market Volume (units), by Application 2024 & 2032
  77. Figure 77: MEA Smart Sensor Market Revenue Share (%), by Application 2024 & 2032
  78. Figure 78: MEA Smart Sensor Market Volume Share (%), by Application 2024 & 2032
  79. Figure 79: MEA Smart Sensor Market Revenue (Billion), by Country 2024 & 2032
  80. Figure 80: MEA Smart Sensor Market Volume (units), by Country 2024 & 2032
  81. Figure 81: MEA Smart Sensor Market Revenue Share (%), by Country 2024 & 2032
  82. Figure 82: MEA Smart Sensor Market Volume Share (%), by Country 2024 & 2032

List of Tables

  1. Table 1: Global Smart Sensor Market Revenue Billion Forecast, by Region 2019 & 2032
  2. Table 2: Global Smart Sensor Market Volume units Forecast, by Region 2019 & 2032
  3. Table 3: Global Smart Sensor Market Revenue Billion Forecast, by Technology 2019 & 2032
  4. Table 4: Global Smart Sensor Market Volume units Forecast, by Technology 2019 & 2032
  5. Table 5: Global Smart Sensor Market Revenue Billion Forecast, by Network 2019 & 2032
  6. Table 6: Global Smart Sensor Market Volume units Forecast, by Network 2019 & 2032
  7. Table 7: Global Smart Sensor Market Revenue Billion Forecast, by Application 2019 & 2032
  8. Table 8: Global Smart Sensor Market Volume units Forecast, by Application 2019 & 2032
  9. Table 9: Global Smart Sensor Market Revenue Billion Forecast, by Region 2019 & 2032
  10. Table 10: Global Smart Sensor Market Volume units Forecast, by Region 2019 & 2032
  11. Table 11: Global Smart Sensor Market Revenue Billion Forecast, by Technology 2019 & 2032
  12. Table 12: Global Smart Sensor Market Volume units Forecast, by Technology 2019 & 2032
  13. Table 13: Global Smart Sensor Market Revenue Billion Forecast, by Network 2019 & 2032
  14. Table 14: Global Smart Sensor Market Volume units Forecast, by Network 2019 & 2032
  15. Table 15: Global Smart Sensor Market Revenue Billion Forecast, by Application 2019 & 2032
  16. Table 16: Global Smart Sensor Market Volume units Forecast, by Application 2019 & 2032
  17. Table 17: Global Smart Sensor Market Revenue Billion Forecast, by Country 2019 & 2032
  18. Table 18: Global Smart Sensor Market Volume units Forecast, by Country 2019 & 2032
  19. Table 19: U.S. Smart Sensor Market Revenue (Billion) Forecast, by Application 2019 & 2032
  20. Table 20: U.S. Smart Sensor Market Volume (units) Forecast, by Application 2019 & 2032
  21. Table 21: Canada Smart Sensor Market Revenue (Billion) Forecast, by Application 2019 & 2032
  22. Table 22: Canada Smart Sensor Market Volume (units) Forecast, by Application 2019 & 2032
  23. Table 23: Global Smart Sensor Market Revenue Billion Forecast, by Technology 2019 & 2032
  24. Table 24: Global Smart Sensor Market Volume units Forecast, by Technology 2019 & 2032
  25. Table 25: Global Smart Sensor Market Revenue Billion Forecast, by Network 2019 & 2032
  26. Table 26: Global Smart Sensor Market Volume units Forecast, by Network 2019 & 2032
  27. Table 27: Global Smart Sensor Market Revenue Billion Forecast, by Application 2019 & 2032
  28. Table 28: Global Smart Sensor Market Volume units Forecast, by Application 2019 & 2032
  29. Table 29: Global Smart Sensor Market Revenue Billion Forecast, by Country 2019 & 2032
  30. Table 30: Global Smart Sensor Market Volume units Forecast, by Country 2019 & 2032
  31. Table 31: Germany Smart Sensor Market Revenue (Billion) Forecast, by Application 2019 & 2032
  32. Table 32: Germany Smart Sensor Market Volume (units) Forecast, by Application 2019 & 2032
  33. Table 33: UK Smart Sensor Market Revenue (Billion) Forecast, by Application 2019 & 2032
  34. Table 34: UK Smart Sensor Market Volume (units) Forecast, by Application 2019 & 2032
  35. Table 35: France Smart Sensor Market Revenue (Billion) Forecast, by Application 2019 & 2032
  36. Table 36: France Smart Sensor Market Volume (units) Forecast, by Application 2019 & 2032
  37. Table 37: Italy Smart Sensor Market Revenue (Billion) Forecast, by Application 2019 & 2032
  38. Table 38: Italy Smart Sensor Market Volume (units) Forecast, by Application 2019 & 2032
  39. Table 39: Russia Smart Sensor Market Revenue (Billion) Forecast, by Application 2019 & 2032
  40. Table 40: Russia Smart Sensor Market Volume (units) Forecast, by Application 2019 & 2032
  41. Table 41: Rest of Europe Smart Sensor Market Revenue (Billion) Forecast, by Application 2019 & 2032
  42. Table 42: Rest of Europe Smart Sensor Market Volume (units) Forecast, by Application 2019 & 2032
  43. Table 43: Global Smart Sensor Market Revenue Billion Forecast, by Technology 2019 & 2032
  44. Table 44: Global Smart Sensor Market Volume units Forecast, by Technology 2019 & 2032
  45. Table 45: Global Smart Sensor Market Revenue Billion Forecast, by Network 2019 & 2032
  46. Table 46: Global Smart Sensor Market Volume units Forecast, by Network 2019 & 2032
  47. Table 47: Global Smart Sensor Market Revenue Billion Forecast, by Application 2019 & 2032
  48. Table 48: Global Smart Sensor Market Volume units Forecast, by Application 2019 & 2032
  49. Table 49: Global Smart Sensor Market Revenue Billion Forecast, by Country 2019 & 2032
  50. Table 50: Global Smart Sensor Market Volume units Forecast, by Country 2019 & 2032
  51. Table 51: China Smart Sensor Market Revenue (Billion) Forecast, by Application 2019 & 2032
  52. Table 52: China Smart Sensor Market Volume (units) Forecast, by Application 2019 & 2032
  53. Table 53: Japan Smart Sensor Market Revenue (Billion) Forecast, by Application 2019 & 2032
  54. Table 54: Japan Smart Sensor Market Volume (units) Forecast, by Application 2019 & 2032
  55. Table 55: India Smart Sensor Market Revenue (Billion) Forecast, by Application 2019 & 2032
  56. Table 56: India Smart Sensor Market Volume (units) Forecast, by Application 2019 & 2032
  57. Table 57: South Korea Smart Sensor Market Revenue (Billion) Forecast, by Application 2019 & 2032
  58. Table 58: South Korea Smart Sensor Market Volume (units) Forecast, by Application 2019 & 2032
  59. Table 59: Thailand Smart Sensor Market Revenue (Billion) Forecast, by Application 2019 & 2032
  60. Table 60: Thailand Smart Sensor Market Volume (units) Forecast, by Application 2019 & 2032
  61. Table 61: Rest of Asia Pacific Smart Sensor Market Revenue (Billion) Forecast, by Application 2019 & 2032
  62. Table 62: Rest of Asia Pacific Smart Sensor Market Volume (units) Forecast, by Application 2019 & 2032
  63. Table 63: Global Smart Sensor Market Revenue Billion Forecast, by Technology 2019 & 2032
  64. Table 64: Global Smart Sensor Market Volume units Forecast, by Technology 2019 & 2032
  65. Table 65: Global Smart Sensor Market Revenue Billion Forecast, by Network 2019 & 2032
  66. Table 66: Global Smart Sensor Market Volume units Forecast, by Network 2019 & 2032
  67. Table 67: Global Smart Sensor Market Revenue Billion Forecast, by Application 2019 & 2032
  68. Table 68: Global Smart Sensor Market Volume units Forecast, by Application 2019 & 2032
  69. Table 69: Global Smart Sensor Market Revenue Billion Forecast, by Country 2019 & 2032
  70. Table 70: Global Smart Sensor Market Volume units Forecast, by Country 2019 & 2032
  71. Table 71: Brazil Smart Sensor Market Revenue (Billion) Forecast, by Application 2019 & 2032
  72. Table 72: Brazil Smart Sensor Market Volume (units) Forecast, by Application 2019 & 2032
  73. Table 73: Mexico Smart Sensor Market Revenue (Billion) Forecast, by Application 2019 & 2032
  74. Table 74: Mexico Smart Sensor Market Volume (units) Forecast, by Application 2019 & 2032
  75. Table 75: Argentina Smart Sensor Market Revenue (Billion) Forecast, by Application 2019 & 2032
  76. Table 76: Argentina Smart Sensor Market Volume (units) Forecast, by Application 2019 & 2032
  77. Table 77: Rest of Latin America Smart Sensor Market Revenue (Billion) Forecast, by Application 2019 & 2032
  78. Table 78: Rest of Latin America Smart Sensor Market Volume (units) Forecast, by Application 2019 & 2032
  79. Table 79: Global Smart Sensor Market Revenue Billion Forecast, by Technology 2019 & 2032
  80. Table 80: Global Smart Sensor Market Volume units Forecast, by Technology 2019 & 2032
  81. Table 81: Global Smart Sensor Market Revenue Billion Forecast, by Network 2019 & 2032
  82. Table 82: Global Smart Sensor Market Volume units Forecast, by Network 2019 & 2032
  83. Table 83: Global Smart Sensor Market Revenue Billion Forecast, by Application 2019 & 2032
  84. Table 84: Global Smart Sensor Market Volume units Forecast, by Application 2019 & 2032
  85. Table 85: Global Smart Sensor Market Revenue Billion Forecast, by Country 2019 & 2032
  86. Table 86: Global Smart Sensor Market Volume units Forecast, by Country 2019 & 2032
  87. Table 87: GCC Smart Sensor Market Revenue (Billion) Forecast, by Application 2019 & 2032
  88. Table 88: GCC Smart Sensor Market Volume (units) Forecast, by Application 2019 & 2032
  89. Table 89: South Africa Smart Sensor Market Revenue (Billion) Forecast, by Application 2019 & 2032
  90. Table 90: South Africa Smart Sensor Market Volume (units) Forecast, by Application 2019 & 2032
  91. Table 91: Rest of MEA Smart Sensor Market Revenue (Billion) Forecast, by Application 2019 & 2032
  92. Table 92: Rest of MEA Smart Sensor Market Volume (units) Forecast, by Application 2019 & 2032


STEP 1 - Identification of Relevant Samples Size from Population Database

Step Chart
bar chart
method chart

STEP 2 - Approaches for Defining Global Market Size (Value, Volume* & Price*)

approach chart
Top-down and bottom-up approaches are used to validate the global market size and estimate the market size for manufactures, regional segemnts, product and application.

Note* : In applicable scenarios

STEP 3 - Data Sources

Primary Research

  • Web Analytics
  • Survey Reports
  • Research Institute
  • Latest Research Reports
  • Opinion Leaders

Secondary Research

  • Annual Reports
  • White Paper
  • Latest Press Release
  • Industry Association
  • Paid Database
  • Investor Presentations
approach chart

STEP 4 - Data Triangulation

Involves using different sources of information in order to increase the validity of a study

These sources are likely to be stakeholders in a program - participants, other researchers, program staff, other community members, and so on.

Then we put all data in single framework & apply various statistical tools to find out the dynamic on the market.

During the analysis stage, feedback from the stakeholder groups would be compared to determine areas of agreement as well as areas of divergence

Additionally after gathering mix and scattered data from wide range of sources, data is triangull- ated and correlated to come up with estimated figures which are further validated through primary mediums, or industry experts, opinion leader.

Frequently Asked Questions

1. What is the projected Compound Annual Growth Rate (CAGR) of the Smart Sensor Market?

The projected CAGR is approximately 15.7%.

2. Which companies are prominent players in the Smart Sensor Market?

Key companies in the market include Infineon Technologies AG, TDK InvenSense, TE Connectivity, STMicroelectronics, Robert Bosch GmbH, Emerson Electric Co., NXP Semiconductors N.V.

3. What are the main segments of the Smart Sensor Market?

The market segments include Technology, Network, Application.

4. Can you provide details about the market size?

The market size is estimated to be USD 45.4 Billion as of 2022.

5. What are some drivers contributing to market growth?

Surging demand for smart wearables in the healthcare sector. Rising electrification in automobiles. Growing investments in the oil & gas industry. Rising trend of industrial automation and Industry 4.0. Propelling demand for advanced security systems in smart homes.

6. What are the notable trends driving market growth?

Key market insights include the rising demand for smart sensors in the automotive sector. driven by the adoption of ADAS and autonomous vehicles. The increasing popularity of smart homes and connected devices is also contributing to market growth. as smart sensors enable home automation. security. and energy management. Furthermore. advancements in AI and IoT technologies are enhancing the capabilities of smart sensors. leading to the development of more intelligent and efficient sensor systems..

7. Are there any restraints impacting market growth?

Low Availability of raw materials for smart sensors. High maintenance cost of smart sensors.

8. Can you provide examples of recent developments in the market?

In October 2021, ABB introduced its new FusionAir Smart Sensor, a touch-free room sensor to lessen indoor air pollution. This room control sensors can monitor the temperature, humidity, carbon dioxide (CO2), and volatile organic compounds (VOCs), which enhance indoor air quality overall and lower the danger of exposure to viruses. This sensor offers healthy, surroundings for users while addressing growing concerns about indoor air quality.

9. What pricing options are available for accessing the report?

Pricing options include single-user, multi-user, and enterprise licenses priced at USD 4,850, USD 5,350, and USD 8,350 respectively.

10. Is the market size provided in terms of value or volume?

The market size is provided in terms of value, measured in Billion and volume, measured in units.

11. Are there any specific market keywords associated with the report?

Yes, the market keyword associated with the report is "Smart Sensor Market," which aids in identifying and referencing the specific market segment covered.

12. How do I determine which pricing option suits my needs best?

The pricing options vary based on user requirements and access needs. Individual users may opt for single-user licenses, while businesses requiring broader access may choose multi-user or enterprise licenses for cost-effective access to the report.

13. Are there any additional resources or data provided in the Smart Sensor Market report?

While the report offers comprehensive insights, it's advisable to review the specific contents or supplementary materials provided to ascertain if additional resources or data are available.

14. How can I stay updated on further developments or reports in the Smart Sensor Market?

To stay informed about further developments, trends, and reports in the Smart Sensor Market, consider subscribing to industry newsletters, following relevant companies and organizations, or regularly checking reputable industry news sources and publications.

Related Reports

See the similar reports

Discover the Latest Market Insight Reports

Access in-depth insights on industries, companies, trends, and global markets. Our expertly curated reports provide the most relevant data and analysis in a condensed, easy-to-read format.

shop image 1

About Market Insights Report

Market Insights Reports offers comprehensive market research reports and analysis, giving businesses important information about their clients, rivals, and sector to help them make well-informed decisions on operations, marketing, and business strategy. We offer a variety of services in addition to market research, data analysis, and strategy planning. In order to find opportunities and learn more about our competitors and the industry at large, we employ competitive analysis. To identify areas for development, we also evaluate our performance against that of our rivals. We can determine the places at which we can offer our clients the most value by performing value chain analysis.

Additionally, clients receive a thorough overview of their industry business environment. We can find trends that help us forecast future possibilities and threats by examining global macroeconomic dynamics and consumer behavior patterns. By analyzing their features and advantages, contrasting them with comparable items on the market, and evaluating both their quantitative and qualitative performance, we comprehensively evaluate our clients' products. This allows us to assist customers in determining how their goods compare to those of their rivals and in creating successful marketing plans. Our group has been successful in gaining a thorough grasp of our clients' requirements and offering them creative solutions. We currently provide services to more than 50 nations in Europe, the Middle East, Africa, Latin America, Asia Pacific, and North America. Because of our global reach, we have been able to establish trusting bonds with our partners and clients in various nations, improving customer service and forging a more cohesive worldwide presence.

We use cookies to enhance your experience.

By clicking "Accept All", you consent to the use of all cookies.

Customize your preferences or read our Cookie Policy.