
.jpg&w=3840&q=100)
Market
Insights
Reports delivered globally, covering a wide range of industries and sectors.
Clients who trust our expertise and rely on our insights for business decisions.
Managed Reports, ensuring seamless updates and premium service.
Satisfied Customers, committed to delivering exceptional value and quality.
Smart Tag Packaging Market Strategic Roadmap: Analysis and Forecasts 2025-2033
Smart Tag Packaging Market by Type (Radio-Frequency Identification (RFID) Tags, Near-Field Communication (NFC) Tags, Quick Response (QR) Codes, Others), by Application (Interactive Packaging, Food Safety and Quality Assurance, Traceability and Authentication, Environmental Monitoring, Others), by End Use (Healthcare, Automotive, Aerospace, Logistics and Supply Chain, Others), by North America (U.S., Canada), by Europe (Germany, UK, France, Italy, Russia, Rest of Europe), by Asia Pacific (China, Japan, India, Australia, Rest of Asia Pacific), by Latin America (Brazil, Mexico, Rest of Latin America), by MEA (South Africa, Saudi Arabia, UAE, Rest of MEA) Forecast 2025-2033
Smart Tag Packaging Market Strategic Roadmap: Analysis and Forecasts 2025-2033
Key Insights
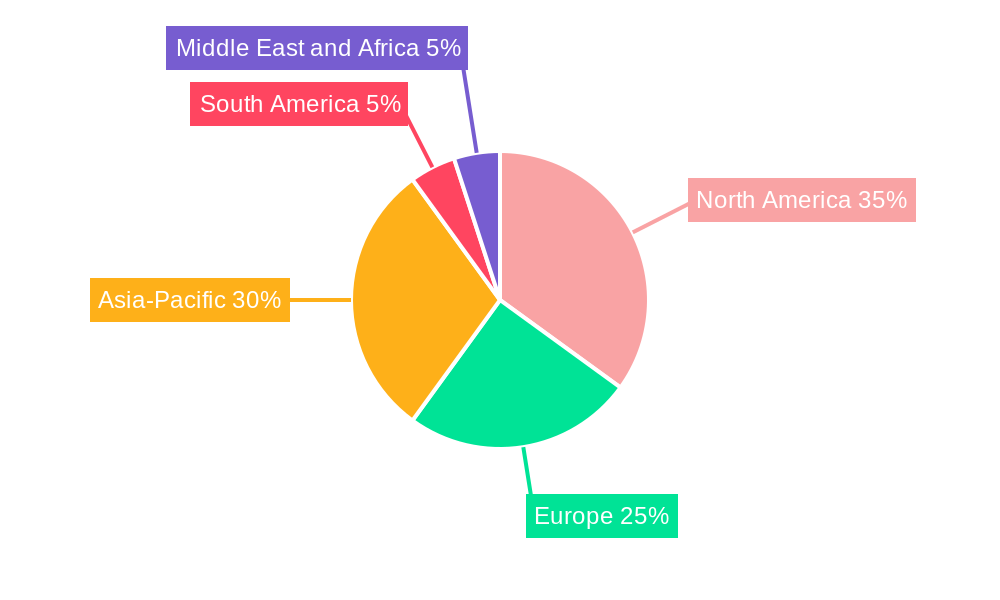
The size of the Smart Tag Packaging Market was valued at USD 9 Million in 2024 and is projected to reach USD 19.90 Million by 2033, with an expected CAGR of 12% during the forecast period. The Smart Tag Packaging Market focuses on the utilization of advanced, tech-enabled labels and tags incorporated into packaging to improve product monitoring, security, and consumer interaction. These intelligent tags encompass technologies like RFID (Radio Frequency Identification), NFC (Near Field Communication), QR codes, and sensors that can track and gather information regarding the product’s location, temperature, humidity, and state during transport and storage. The market is fueled by the rising need for better supply chain visibility, anti-counterfeiting strategies, and enhanced consumer experiences. Smart tags facilitate real-time tracking, assisting businesses in enhancing inventory control, combating fraud, and maintaining product quality during the logistics process. Moreover, they provide interactive options enabling consumers to obtain product details, promotional deals, or authenticity checks directly via their smartphones. As e-commerce continues to grow, the demand for secure, traceable, and efficient packaging solutions is driving the growth of this market. As industries focus on sustainability, innovation, and solutions centered around consumers, the Smart Tag Packaging Market is projected to expand considerably in the near future.

Smart Tag Packaging Market Concentration & Characteristics
The Smart Tag Packaging Market is highly concentrated with a few major players controlling a significant share of the market. The market is characterized by innovation, with companies continuously developing new and improved products to meet the evolving needs of end-users. Government regulations and product substitutes are key factors influencing the market's characteristics. The end-user concentration is high, with a few major industries accounting for a majority of the market share. The level of M&A activity in the market is moderate, with companies acquiring smaller players to expand their product portfolio or geographic reach.
Smart Tag Packaging Market Trends
The Smart Tag Packaging Market is witnessing several key trends, including the growing adoption of RFID technology, the increasing use of smart tags for traceability and authentication, and the emergence of sustainable smart tag packaging solutions. RFID tags are becoming increasingly popular due to their ability to provide real-time data on the location and condition of products. Smart tags are also being used to enhance traceability and authentication, ensuring product safety and preventing counterfeiting. In addition, the growing emphasis on sustainability is driving the development of smart tag packaging solutions that are eco-friendly and biodegradable.

Key Region or Country & Segment to Dominate the Market
The Asia-Pacific region is expected to dominate the Smart Tag Packaging Market over the forecast period. The growing population and increasing disposable income in the region are major factors driving the market growth. Interactive Packaging and Food Safety and Quality Assurance are the key applications expected to drive the market in the region.
Smart Tag Packaging Market Product Insights Report Coverage & Deliverables
The Smart Tag Packaging Market Product Insights Report provides comprehensive coverage of the market, including market size, market share, and growth forecasts. The report also includes an analysis of key market trends, drivers, and challenges. The report deliverables include market size and share analysis, segment analysis, competitive landscape analysis, and company profiles.
Smart Tag Packaging Market Analysis
The Smart Tag Packaging Market is expected to grow from $9 Million in 2023 to $21 Million by 2030, at a CAGR of 12%. The growth is attributed to the increasing demand for smart packaging solutions from end-use industries such as healthcare, automotive, aerospace, logistics and supply chain. The market is expected to witness significant growth in the Asia-Pacific region, driven by the rising population and increasing disposable income.
Smart Tag Packaging Market Regional Insights
North America
- U.S.
- Canada
Europe
- Germany
- UK
- France
- Italy
- Russia
- Rest of Europe
Asia Pacific
- China
- Japan
- India
- Australia
- Rest of Asia Pacific
Latin America
- Brazil
- Mexico
- Rest of Latin America
MEA
- South Africa
- Saudi Arabia
- UAE
- Rest of MEA
Driving Forces: What's Propelling the Smart Tag Packaging Market
- Growing demand for smart packaging solutions from end-use industries
- Increasing population and disposable income in developing regions
- Government initiatives promoting the use of smart packaging
- Technological advancements and innovation in smart tag packaging
Challenges and Restraints in Smart Tag Packaging Market
- High cost of smart tag packaging solutions
- Lack of awareness about the benefits of smart tag packaging
- Technical complexities associated with smart tag packaging
- Concerns about data security and privacy
Emerging Trends in Smart Tag Packaging Market
- Adoption of RFID technology
- Increasing use of smart tags for traceability and authentication
- Emergence of sustainable smart tag packaging solutions
- Growth of the e-commerce industry
- Integration of smart tags with IoT devices
Smart Tag Packaging Industry News
- July 2022: Paragon ID, the European leader in ID solutions & technologies used in the mass transit & smart cities, e-ID, track & trace, and payment markets, acquired 100% of the capital of Tracktio, a provider of asset tracking and Real-time Location System (RTLS) solutions dedicated to industries operating in complex or hazardous environments.
Leading Players in the Smart Tag Packaging Market
- Smartrac Technology Group (Part of Avery Dennison)
- Checkpoint Systems (A Division of CCL Industries)
- Sato Holdings Corporation
- Zebra Technologies Corporation
- Alien Technology
- Impinj, Inc.
Smart Tag Packaging Market Segmentation
- 1. Type
- 1.1. Radio-Frequency Identification (RFID) Tags
- 1.2. Near-Field Communication (NFC) Tags
- 1.3. Quick Response (QR) Codes
- 1.4. Others
- 2. Application
- 2.1. Interactive Packaging
- 2.2. Food Safety and Quality Assurance
- 2.3. Traceability and Authentication
- 2.4. Environmental Monitoring
- 2.5. Others
- 3. End Use
- 3.1. Healthcare
- 3.2. Automotive
- 3.3. Aerospace
- 3.4. Logistics and Supply Chain
- 3.5. Others
Smart Tag Packaging Market Segmentation By Geography
- 1. North America
- 1.1. U.S.
- 1.2. Canada
- 2. Europe
- 2.1. Germany
- 2.2. UK
- 2.3. France
- 2.4. Italy
- 2.5. Russia
- 2.6. Rest of Europe
- 3. Asia Pacific
- 3.1. China
- 3.2. Japan
- 3.3. India
- 3.4. Australia
- 3.5. Rest of Asia Pacific
- 4. Latin America
- 4.1. Brazil
- 4.2. Mexico
- 4.3. Rest of Latin America
- 5. MEA
- 5.1. South Africa
- 5.2. Saudi Arabia
- 5.3. UAE
- 5.4. Rest of MEA
Smart Tag Packaging Market REPORT HIGHLIGHTS
| Aspects | Details |
|---|---|
| Study Period | 2019-2033 |
| Base Year | 2024 |
| Estimated Year | 2025 |
| Forecast Period | 2025-2033 |
| Historical Period | 2019-2024 |
| Growth Rate | CAGR of 12% from 2019-2033 |
| Segmentation |
|
- 1. Introduction
- 1.1. Research Scope
- 1.2. Market Segmentation
- 1.3. Research Methodology
- 1.4. Definitions and Assumptions
- 2. Executive Summary
- 2.1. Introduction
- 3. Market Dynamics
- 3.1. Introduction
- 3.2. Market Drivers
- 3.2.1 Increasing demand for smart packaging solutions
- 3.2.2 Growing awareness about the benefits of smart tag packaging
- 3.2.3 Technological advancements in smart tag technology
- 3.2.4 Government regulations and initiatives
- 3.2.5 Rising focus on sustainability
- 3.3. Market Restrains
- 3.3.1 Expensive than traditional packaging
- 3.3.2 Complex technology
- 3.4. Market Trends
- 4. Market Factor Analysis
- 4.1. Porters Five Forces
- 4.2. Supply/Value Chain
- 4.3. PESTEL analysis
- 4.4. Market Entropy
- 4.5. Patent/Trademark Analysis
- 5. Global Smart Tag Packaging Market Analysis, Insights and Forecast, 2019-2031
- 5.1. Market Analysis, Insights and Forecast - by Type
- 5.1.1. Radio-Frequency Identification (RFID) Tags
- 5.1.2. Near-Field Communication (NFC) Tags
- 5.1.3. Quick Response (QR) Codes
- 5.1.4. Others
- 5.2. Market Analysis, Insights and Forecast - by Application
- 5.2.1. Interactive Packaging
- 5.2.2. Food Safety and Quality Assurance
- 5.2.3. Traceability and Authentication
- 5.2.4. Environmental Monitoring
- 5.2.5. Others
- 5.3. Market Analysis, Insights and Forecast - by End Use
- 5.3.1. Healthcare
- 5.3.2. Automotive
- 5.3.3. Aerospace
- 5.3.4. Logistics and Supply Chain
- 5.3.5. Others
- 5.4. Market Analysis, Insights and Forecast - by Region
- 5.4.1. North America
- 5.4.2. Europe
- 5.4.3. Asia Pacific
- 5.4.4. Latin America
- 5.4.5. MEA
- 5.1. Market Analysis, Insights and Forecast - by Type
- 6. North America Smart Tag Packaging Market Analysis, Insights and Forecast, 2019-2031
- 6.1. Market Analysis, Insights and Forecast - by Type
- 6.1.1. Radio-Frequency Identification (RFID) Tags
- 6.1.2. Near-Field Communication (NFC) Tags
- 6.1.3. Quick Response (QR) Codes
- 6.1.4. Others
- 6.2. Market Analysis, Insights and Forecast - by Application
- 6.2.1. Interactive Packaging
- 6.2.2. Food Safety and Quality Assurance
- 6.2.3. Traceability and Authentication
- 6.2.4. Environmental Monitoring
- 6.2.5. Others
- 6.3. Market Analysis, Insights and Forecast - by End Use
- 6.3.1. Healthcare
- 6.3.2. Automotive
- 6.3.3. Aerospace
- 6.3.4. Logistics and Supply Chain
- 6.3.5. Others
- 6.1. Market Analysis, Insights and Forecast - by Type
- 7. Europe Smart Tag Packaging Market Analysis, Insights and Forecast, 2019-2031
- 7.1. Market Analysis, Insights and Forecast - by Type
- 7.1.1. Radio-Frequency Identification (RFID) Tags
- 7.1.2. Near-Field Communication (NFC) Tags
- 7.1.3. Quick Response (QR) Codes
- 7.1.4. Others
- 7.2. Market Analysis, Insights and Forecast - by Application
- 7.2.1. Interactive Packaging
- 7.2.2. Food Safety and Quality Assurance
- 7.2.3. Traceability and Authentication
- 7.2.4. Environmental Monitoring
- 7.2.5. Others
- 7.3. Market Analysis, Insights and Forecast - by End Use
- 7.3.1. Healthcare
- 7.3.2. Automotive
- 7.3.3. Aerospace
- 7.3.4. Logistics and Supply Chain
- 7.3.5. Others
- 7.1. Market Analysis, Insights and Forecast - by Type
- 8. Asia Pacific Smart Tag Packaging Market Analysis, Insights and Forecast, 2019-2031
- 8.1. Market Analysis, Insights and Forecast - by Type
- 8.1.1. Radio-Frequency Identification (RFID) Tags
- 8.1.2. Near-Field Communication (NFC) Tags
- 8.1.3. Quick Response (QR) Codes
- 8.1.4. Others
- 8.2. Market Analysis, Insights and Forecast - by Application
- 8.2.1. Interactive Packaging
- 8.2.2. Food Safety and Quality Assurance
- 8.2.3. Traceability and Authentication
- 8.2.4. Environmental Monitoring
- 8.2.5. Others
- 8.3. Market Analysis, Insights and Forecast - by End Use
- 8.3.1. Healthcare
- 8.3.2. Automotive
- 8.3.3. Aerospace
- 8.3.4. Logistics and Supply Chain
- 8.3.5. Others
- 8.1. Market Analysis, Insights and Forecast - by Type
- 9. Latin America Smart Tag Packaging Market Analysis, Insights and Forecast, 2019-2031
- 9.1. Market Analysis, Insights and Forecast - by Type
- 9.1.1. Radio-Frequency Identification (RFID) Tags
- 9.1.2. Near-Field Communication (NFC) Tags
- 9.1.3. Quick Response (QR) Codes
- 9.1.4. Others
- 9.2. Market Analysis, Insights and Forecast - by Application
- 9.2.1. Interactive Packaging
- 9.2.2. Food Safety and Quality Assurance
- 9.2.3. Traceability and Authentication
- 9.2.4. Environmental Monitoring
- 9.2.5. Others
- 9.3. Market Analysis, Insights and Forecast - by End Use
- 9.3.1. Healthcare
- 9.3.2. Automotive
- 9.3.3. Aerospace
- 9.3.4. Logistics and Supply Chain
- 9.3.5. Others
- 9.1. Market Analysis, Insights and Forecast - by Type
- 10. MEA Smart Tag Packaging Market Analysis, Insights and Forecast, 2019-2031
- 10.1. Market Analysis, Insights and Forecast - by Type
- 10.1.1. Radio-Frequency Identification (RFID) Tags
- 10.1.2. Near-Field Communication (NFC) Tags
- 10.1.3. Quick Response (QR) Codes
- 10.1.4. Others
- 10.2. Market Analysis, Insights and Forecast - by Application
- 10.2.1. Interactive Packaging
- 10.2.2. Food Safety and Quality Assurance
- 10.2.3. Traceability and Authentication
- 10.2.4. Environmental Monitoring
- 10.2.5. Others
- 10.3. Market Analysis, Insights and Forecast - by End Use
- 10.3.1. Healthcare
- 10.3.2. Automotive
- 10.3.3. Aerospace
- 10.3.4. Logistics and Supply Chain
- 10.3.5. Others
- 10.1. Market Analysis, Insights and Forecast - by Type
- 11. Competitive Analysis
- 11.1. Global Market Share Analysis 2024
- 11.2. Company Profiles
- 11.2.1 Smartrac Technology Group (Part of Avery Dennison)
- 11.2.1.1. Overview
- 11.2.1.2. Products
- 11.2.1.3. SWOT Analysis
- 11.2.1.4. Recent Developments
- 11.2.1.5. Financials (Based on Availability)
- 11.2.2 Checkpoint Systems (A Division of CCL Industries)
- 11.2.2.1. Overview
- 11.2.2.2. Products
- 11.2.2.3. SWOT Analysis
- 11.2.2.4. Recent Developments
- 11.2.2.5. Financials (Based on Availability)
- 11.2.3 Sato Holdings Corporation
- 11.2.3.1. Overview
- 11.2.3.2. Products
- 11.2.3.3. SWOT Analysis
- 11.2.3.4. Recent Developments
- 11.2.3.5. Financials (Based on Availability)
- 11.2.4 Zebra Technologies Corporation
- 11.2.4.1. Overview
- 11.2.4.2. Products
- 11.2.4.3. SWOT Analysis
- 11.2.4.4. Recent Developments
- 11.2.4.5. Financials (Based on Availability)
- 11.2.5 Alien Technology
- 11.2.5.1. Overview
- 11.2.5.2. Products
- 11.2.5.3. SWOT Analysis
- 11.2.5.4. Recent Developments
- 11.2.5.5. Financials (Based on Availability)
- 11.2.6 Impinj Inc.
- 11.2.6.1. Overview
- 11.2.6.2. Products
- 11.2.6.3. SWOT Analysis
- 11.2.6.4. Recent Developments
- 11.2.6.5. Financials (Based on Availability)
- 11.2.1 Smartrac Technology Group (Part of Avery Dennison)
- Figure 1: Global Smart Tag Packaging Market Revenue Breakdown (Million, %) by Region 2024 & 2032
- Figure 2: Global Smart Tag Packaging Market Volume Breakdown (K Tons, %) by Region 2024 & 2032
- Figure 3: North America Smart Tag Packaging Market Revenue (Million), by Type 2024 & 2032
- Figure 4: North America Smart Tag Packaging Market Volume (K Tons), by Type 2024 & 2032
- Figure 5: North America Smart Tag Packaging Market Revenue Share (%), by Type 2024 & 2032
- Figure 6: North America Smart Tag Packaging Market Volume Share (%), by Type 2024 & 2032
- Figure 7: North America Smart Tag Packaging Market Revenue (Million), by Application 2024 & 2032
- Figure 8: North America Smart Tag Packaging Market Volume (K Tons), by Application 2024 & 2032
- Figure 9: North America Smart Tag Packaging Market Revenue Share (%), by Application 2024 & 2032
- Figure 10: North America Smart Tag Packaging Market Volume Share (%), by Application 2024 & 2032
- Figure 11: North America Smart Tag Packaging Market Revenue (Million), by End Use 2024 & 2032
- Figure 12: North America Smart Tag Packaging Market Volume (K Tons), by End Use 2024 & 2032
- Figure 13: North America Smart Tag Packaging Market Revenue Share (%), by End Use 2024 & 2032
- Figure 14: North America Smart Tag Packaging Market Volume Share (%), by End Use 2024 & 2032
- Figure 15: North America Smart Tag Packaging Market Revenue (Million), by Country 2024 & 2032
- Figure 16: North America Smart Tag Packaging Market Volume (K Tons), by Country 2024 & 2032
- Figure 17: North America Smart Tag Packaging Market Revenue Share (%), by Country 2024 & 2032
- Figure 18: North America Smart Tag Packaging Market Volume Share (%), by Country 2024 & 2032
- Figure 19: Europe Smart Tag Packaging Market Revenue (Million), by Type 2024 & 2032
- Figure 20: Europe Smart Tag Packaging Market Volume (K Tons), by Type 2024 & 2032
- Figure 21: Europe Smart Tag Packaging Market Revenue Share (%), by Type 2024 & 2032
- Figure 22: Europe Smart Tag Packaging Market Volume Share (%), by Type 2024 & 2032
- Figure 23: Europe Smart Tag Packaging Market Revenue (Million), by Application 2024 & 2032
- Figure 24: Europe Smart Tag Packaging Market Volume (K Tons), by Application 2024 & 2032
- Figure 25: Europe Smart Tag Packaging Market Revenue Share (%), by Application 2024 & 2032
- Figure 26: Europe Smart Tag Packaging Market Volume Share (%), by Application 2024 & 2032
- Figure 27: Europe Smart Tag Packaging Market Revenue (Million), by End Use 2024 & 2032
- Figure 28: Europe Smart Tag Packaging Market Volume (K Tons), by End Use 2024 & 2032
- Figure 29: Europe Smart Tag Packaging Market Revenue Share (%), by End Use 2024 & 2032
- Figure 30: Europe Smart Tag Packaging Market Volume Share (%), by End Use 2024 & 2032
- Figure 31: Europe Smart Tag Packaging Market Revenue (Million), by Country 2024 & 2032
- Figure 32: Europe Smart Tag Packaging Market Volume (K Tons), by Country 2024 & 2032
- Figure 33: Europe Smart Tag Packaging Market Revenue Share (%), by Country 2024 & 2032
- Figure 34: Europe Smart Tag Packaging Market Volume Share (%), by Country 2024 & 2032
- Figure 35: Asia Pacific Smart Tag Packaging Market Revenue (Million), by Type 2024 & 2032
- Figure 36: Asia Pacific Smart Tag Packaging Market Volume (K Tons), by Type 2024 & 2032
- Figure 37: Asia Pacific Smart Tag Packaging Market Revenue Share (%), by Type 2024 & 2032
- Figure 38: Asia Pacific Smart Tag Packaging Market Volume Share (%), by Type 2024 & 2032
- Figure 39: Asia Pacific Smart Tag Packaging Market Revenue (Million), by Application 2024 & 2032
- Figure 40: Asia Pacific Smart Tag Packaging Market Volume (K Tons), by Application 2024 & 2032
- Figure 41: Asia Pacific Smart Tag Packaging Market Revenue Share (%), by Application 2024 & 2032
- Figure 42: Asia Pacific Smart Tag Packaging Market Volume Share (%), by Application 2024 & 2032
- Figure 43: Asia Pacific Smart Tag Packaging Market Revenue (Million), by End Use 2024 & 2032
- Figure 44: Asia Pacific Smart Tag Packaging Market Volume (K Tons), by End Use 2024 & 2032
- Figure 45: Asia Pacific Smart Tag Packaging Market Revenue Share (%), by End Use 2024 & 2032
- Figure 46: Asia Pacific Smart Tag Packaging Market Volume Share (%), by End Use 2024 & 2032
- Figure 47: Asia Pacific Smart Tag Packaging Market Revenue (Million), by Country 2024 & 2032
- Figure 48: Asia Pacific Smart Tag Packaging Market Volume (K Tons), by Country 2024 & 2032
- Figure 49: Asia Pacific Smart Tag Packaging Market Revenue Share (%), by Country 2024 & 2032
- Figure 50: Asia Pacific Smart Tag Packaging Market Volume Share (%), by Country 2024 & 2032
- Figure 51: Latin America Smart Tag Packaging Market Revenue (Million), by Type 2024 & 2032
- Figure 52: Latin America Smart Tag Packaging Market Volume (K Tons), by Type 2024 & 2032
- Figure 53: Latin America Smart Tag Packaging Market Revenue Share (%), by Type 2024 & 2032
- Figure 54: Latin America Smart Tag Packaging Market Volume Share (%), by Type 2024 & 2032
- Figure 55: Latin America Smart Tag Packaging Market Revenue (Million), by Application 2024 & 2032
- Figure 56: Latin America Smart Tag Packaging Market Volume (K Tons), by Application 2024 & 2032
- Figure 57: Latin America Smart Tag Packaging Market Revenue Share (%), by Application 2024 & 2032
- Figure 58: Latin America Smart Tag Packaging Market Volume Share (%), by Application 2024 & 2032
- Figure 59: Latin America Smart Tag Packaging Market Revenue (Million), by End Use 2024 & 2032
- Figure 60: Latin America Smart Tag Packaging Market Volume (K Tons), by End Use 2024 & 2032
- Figure 61: Latin America Smart Tag Packaging Market Revenue Share (%), by End Use 2024 & 2032
- Figure 62: Latin America Smart Tag Packaging Market Volume Share (%), by End Use 2024 & 2032
- Figure 63: Latin America Smart Tag Packaging Market Revenue (Million), by Country 2024 & 2032
- Figure 64: Latin America Smart Tag Packaging Market Volume (K Tons), by Country 2024 & 2032
- Figure 65: Latin America Smart Tag Packaging Market Revenue Share (%), by Country 2024 & 2032
- Figure 66: Latin America Smart Tag Packaging Market Volume Share (%), by Country 2024 & 2032
- Figure 67: MEA Smart Tag Packaging Market Revenue (Million), by Type 2024 & 2032
- Figure 68: MEA Smart Tag Packaging Market Volume (K Tons), by Type 2024 & 2032
- Figure 69: MEA Smart Tag Packaging Market Revenue Share (%), by Type 2024 & 2032
- Figure 70: MEA Smart Tag Packaging Market Volume Share (%), by Type 2024 & 2032
- Figure 71: MEA Smart Tag Packaging Market Revenue (Million), by Application 2024 & 2032
- Figure 72: MEA Smart Tag Packaging Market Volume (K Tons), by Application 2024 & 2032
- Figure 73: MEA Smart Tag Packaging Market Revenue Share (%), by Application 2024 & 2032
- Figure 74: MEA Smart Tag Packaging Market Volume Share (%), by Application 2024 & 2032
- Figure 75: MEA Smart Tag Packaging Market Revenue (Million), by End Use 2024 & 2032
- Figure 76: MEA Smart Tag Packaging Market Volume (K Tons), by End Use 2024 & 2032
- Figure 77: MEA Smart Tag Packaging Market Revenue Share (%), by End Use 2024 & 2032
- Figure 78: MEA Smart Tag Packaging Market Volume Share (%), by End Use 2024 & 2032
- Figure 79: MEA Smart Tag Packaging Market Revenue (Million), by Country 2024 & 2032
- Figure 80: MEA Smart Tag Packaging Market Volume (K Tons), by Country 2024 & 2032
- Figure 81: MEA Smart Tag Packaging Market Revenue Share (%), by Country 2024 & 2032
- Figure 82: MEA Smart Tag Packaging Market Volume Share (%), by Country 2024 & 2032
- Table 1: Global Smart Tag Packaging Market Revenue Million Forecast, by Region 2019 & 2032
- Table 2: Global Smart Tag Packaging Market Volume K Tons Forecast, by Region 2019 & 2032
- Table 3: Global Smart Tag Packaging Market Revenue Million Forecast, by Type 2019 & 2032
- Table 4: Global Smart Tag Packaging Market Volume K Tons Forecast, by Type 2019 & 2032
- Table 5: Global Smart Tag Packaging Market Revenue Million Forecast, by Application 2019 & 2032
- Table 6: Global Smart Tag Packaging Market Volume K Tons Forecast, by Application 2019 & 2032
- Table 7: Global Smart Tag Packaging Market Revenue Million Forecast, by End Use 2019 & 2032
- Table 8: Global Smart Tag Packaging Market Volume K Tons Forecast, by End Use 2019 & 2032
- Table 9: Global Smart Tag Packaging Market Revenue Million Forecast, by Region 2019 & 2032
- Table 10: Global Smart Tag Packaging Market Volume K Tons Forecast, by Region 2019 & 2032
- Table 11: Global Smart Tag Packaging Market Revenue Million Forecast, by Type 2019 & 2032
- Table 12: Global Smart Tag Packaging Market Volume K Tons Forecast, by Type 2019 & 2032
- Table 13: Global Smart Tag Packaging Market Revenue Million Forecast, by Application 2019 & 2032
- Table 14: Global Smart Tag Packaging Market Volume K Tons Forecast, by Application 2019 & 2032
- Table 15: Global Smart Tag Packaging Market Revenue Million Forecast, by End Use 2019 & 2032
- Table 16: Global Smart Tag Packaging Market Volume K Tons Forecast, by End Use 2019 & 2032
- Table 17: Global Smart Tag Packaging Market Revenue Million Forecast, by Country 2019 & 2032
- Table 18: Global Smart Tag Packaging Market Volume K Tons Forecast, by Country 2019 & 2032
- Table 19: U.S. Smart Tag Packaging Market Revenue (Million) Forecast, by Application 2019 & 2032
- Table 20: U.S. Smart Tag Packaging Market Volume (K Tons) Forecast, by Application 2019 & 2032
- Table 21: Canada Smart Tag Packaging Market Revenue (Million) Forecast, by Application 2019 & 2032
- Table 22: Canada Smart Tag Packaging Market Volume (K Tons) Forecast, by Application 2019 & 2032
- Table 23: Global Smart Tag Packaging Market Revenue Million Forecast, by Type 2019 & 2032
- Table 24: Global Smart Tag Packaging Market Volume K Tons Forecast, by Type 2019 & 2032
- Table 25: Global Smart Tag Packaging Market Revenue Million Forecast, by Application 2019 & 2032
- Table 26: Global Smart Tag Packaging Market Volume K Tons Forecast, by Application 2019 & 2032
- Table 27: Global Smart Tag Packaging Market Revenue Million Forecast, by End Use 2019 & 2032
- Table 28: Global Smart Tag Packaging Market Volume K Tons Forecast, by End Use 2019 & 2032
- Table 29: Global Smart Tag Packaging Market Revenue Million Forecast, by Country 2019 & 2032
- Table 30: Global Smart Tag Packaging Market Volume K Tons Forecast, by Country 2019 & 2032
- Table 31: Germany Smart Tag Packaging Market Revenue (Million) Forecast, by Application 2019 & 2032
- Table 32: Germany Smart Tag Packaging Market Volume (K Tons) Forecast, by Application 2019 & 2032
- Table 33: UK Smart Tag Packaging Market Revenue (Million) Forecast, by Application 2019 & 2032
- Table 34: UK Smart Tag Packaging Market Volume (K Tons) Forecast, by Application 2019 & 2032
- Table 35: France Smart Tag Packaging Market Revenue (Million) Forecast, by Application 2019 & 2032
- Table 36: France Smart Tag Packaging Market Volume (K Tons) Forecast, by Application 2019 & 2032
- Table 37: Italy Smart Tag Packaging Market Revenue (Million) Forecast, by Application 2019 & 2032
- Table 38: Italy Smart Tag Packaging Market Volume (K Tons) Forecast, by Application 2019 & 2032
- Table 39: Russia Smart Tag Packaging Market Revenue (Million) Forecast, by Application 2019 & 2032
- Table 40: Russia Smart Tag Packaging Market Volume (K Tons) Forecast, by Application 2019 & 2032
- Table 41: Rest of Europe Smart Tag Packaging Market Revenue (Million) Forecast, by Application 2019 & 2032
- Table 42: Rest of Europe Smart Tag Packaging Market Volume (K Tons) Forecast, by Application 2019 & 2032
- Table 43: Global Smart Tag Packaging Market Revenue Million Forecast, by Type 2019 & 2032
- Table 44: Global Smart Tag Packaging Market Volume K Tons Forecast, by Type 2019 & 2032
- Table 45: Global Smart Tag Packaging Market Revenue Million Forecast, by Application 2019 & 2032
- Table 46: Global Smart Tag Packaging Market Volume K Tons Forecast, by Application 2019 & 2032
- Table 47: Global Smart Tag Packaging Market Revenue Million Forecast, by End Use 2019 & 2032
- Table 48: Global Smart Tag Packaging Market Volume K Tons Forecast, by End Use 2019 & 2032
- Table 49: Global Smart Tag Packaging Market Revenue Million Forecast, by Country 2019 & 2032
- Table 50: Global Smart Tag Packaging Market Volume K Tons Forecast, by Country 2019 & 2032
- Table 51: China Smart Tag Packaging Market Revenue (Million) Forecast, by Application 2019 & 2032
- Table 52: China Smart Tag Packaging Market Volume (K Tons) Forecast, by Application 2019 & 2032
- Table 53: Japan Smart Tag Packaging Market Revenue (Million) Forecast, by Application 2019 & 2032
- Table 54: Japan Smart Tag Packaging Market Volume (K Tons) Forecast, by Application 2019 & 2032
- Table 55: India Smart Tag Packaging Market Revenue (Million) Forecast, by Application 2019 & 2032
- Table 56: India Smart Tag Packaging Market Volume (K Tons) Forecast, by Application 2019 & 2032
- Table 57: Australia Smart Tag Packaging Market Revenue (Million) Forecast, by Application 2019 & 2032
- Table 58: Australia Smart Tag Packaging Market Volume (K Tons) Forecast, by Application 2019 & 2032
- Table 59: Rest of Asia Pacific Smart Tag Packaging Market Revenue (Million) Forecast, by Application 2019 & 2032
- Table 60: Rest of Asia Pacific Smart Tag Packaging Market Volume (K Tons) Forecast, by Application 2019 & 2032
- Table 61: Global Smart Tag Packaging Market Revenue Million Forecast, by Type 2019 & 2032
- Table 62: Global Smart Tag Packaging Market Volume K Tons Forecast, by Type 2019 & 2032
- Table 63: Global Smart Tag Packaging Market Revenue Million Forecast, by Application 2019 & 2032
- Table 64: Global Smart Tag Packaging Market Volume K Tons Forecast, by Application 2019 & 2032
- Table 65: Global Smart Tag Packaging Market Revenue Million Forecast, by End Use 2019 & 2032
- Table 66: Global Smart Tag Packaging Market Volume K Tons Forecast, by End Use 2019 & 2032
- Table 67: Global Smart Tag Packaging Market Revenue Million Forecast, by Country 2019 & 2032
- Table 68: Global Smart Tag Packaging Market Volume K Tons Forecast, by Country 2019 & 2032
- Table 69: Brazil Smart Tag Packaging Market Revenue (Million) Forecast, by Application 2019 & 2032
- Table 70: Brazil Smart Tag Packaging Market Volume (K Tons) Forecast, by Application 2019 & 2032
- Table 71: Mexico Smart Tag Packaging Market Revenue (Million) Forecast, by Application 2019 & 2032
- Table 72: Mexico Smart Tag Packaging Market Volume (K Tons) Forecast, by Application 2019 & 2032
- Table 73: Rest of Latin America Smart Tag Packaging Market Revenue (Million) Forecast, by Application 2019 & 2032
- Table 74: Rest of Latin America Smart Tag Packaging Market Volume (K Tons) Forecast, by Application 2019 & 2032
- Table 75: Global Smart Tag Packaging Market Revenue Million Forecast, by Type 2019 & 2032
- Table 76: Global Smart Tag Packaging Market Volume K Tons Forecast, by Type 2019 & 2032
- Table 77: Global Smart Tag Packaging Market Revenue Million Forecast, by Application 2019 & 2032
- Table 78: Global Smart Tag Packaging Market Volume K Tons Forecast, by Application 2019 & 2032
- Table 79: Global Smart Tag Packaging Market Revenue Million Forecast, by End Use 2019 & 2032
- Table 80: Global Smart Tag Packaging Market Volume K Tons Forecast, by End Use 2019 & 2032
- Table 81: Global Smart Tag Packaging Market Revenue Million Forecast, by Country 2019 & 2032
- Table 82: Global Smart Tag Packaging Market Volume K Tons Forecast, by Country 2019 & 2032
- Table 83: South Africa Smart Tag Packaging Market Revenue (Million) Forecast, by Application 2019 & 2032
- Table 84: South Africa Smart Tag Packaging Market Volume (K Tons) Forecast, by Application 2019 & 2032
- Table 85: Saudi Arabia Smart Tag Packaging Market Revenue (Million) Forecast, by Application 2019 & 2032
- Table 86: Saudi Arabia Smart Tag Packaging Market Volume (K Tons) Forecast, by Application 2019 & 2032
- Table 87: UAE Smart Tag Packaging Market Revenue (Million) Forecast, by Application 2019 & 2032
- Table 88: UAE Smart Tag Packaging Market Volume (K Tons) Forecast, by Application 2019 & 2032
- Table 89: Rest of MEA Smart Tag Packaging Market Revenue (Million) Forecast, by Application 2019 & 2032
- Table 90: Rest of MEA Smart Tag Packaging Market Volume (K Tons) Forecast, by Application 2019 & 2032
STEP 1 - Identification of Relevant Samples Size from Population Database


STEP 2 - Approaches for Defining Global Market Size (Value, Volume* & Price*)

Note* : In applicable scenarios
STEP 3 - Data Sources
Primary Research
- Web Analytics
- Survey Reports
- Research Institute
- Latest Research Reports
- Opinion Leaders
Secondary Research
- Annual Reports
- White Paper
- Latest Press Release
- Industry Association
- Paid Database
- Investor Presentations

STEP 4 - Data Triangulation
Involves using different sources of information in order to increase the validity of a study
These sources are likely to be stakeholders in a program - participants, other researchers, program staff, other community members, and so on.
Then we put all data in single framework & apply various statistical tools to find out the dynamic on the market.
During the analysis stage, feedback from the stakeholder groups would be compared to determine areas of agreement as well as areas of divergence
Frequently Asked Questions
Related Reports
See the similar reports


About Market Insights Report
Market Insights Reports offers comprehensive market research reports and analysis, giving businesses important information about their clients, rivals, and sector to help them make well-informed decisions on operations, marketing, and business strategy. We offer a variety of services in addition to market research, data analysis, and strategy planning. In order to find opportunities and learn more about our competitors and the industry at large, we employ competitive analysis. To identify areas for development, we also evaluate our performance against that of our rivals. We can determine the places at which we can offer our clients the most value by performing value chain analysis.
Additionally, clients receive a thorough overview of their industry business environment. We can find trends that help us forecast future possibilities and threats by examining global macroeconomic dynamics and consumer behavior patterns. By analyzing their features and advantages, contrasting them with comparable items on the market, and evaluating both their quantitative and qualitative performance, we comprehensively evaluate our clients' products. This allows us to assist customers in determining how their goods compare to those of their rivals and in creating successful marketing plans. Our group has been successful in gaining a thorough grasp of our clients' requirements and offering them creative solutions. We currently provide services to more than 50 nations in Europe, the Middle East, Africa, Latin America, Asia Pacific, and North America. Because of our global reach, we have been able to establish trusting bonds with our partners and clients in various nations, improving customer service and forging a more cohesive worldwide presence.