Report banner
Spectrum Analyzer Market
Updated On

Feb 18 2025

Total Pages

220

Spectrum Analyzer Market 2025-2033 Market Analysis: Trends, Dynamics, and Growth Opportunities

Spectrum Analyzer Market by Frequency Range (<6 GHz, 6 GHz–18 GHz, >18 GHz), by Form Factor (Handled Spectrum Analyzer, Portable Spectrum Analyzer, Benchtop Spectrum Analyzer), by Network Technology (Wired, Wireless), by End User (Residential Automotive & Transportation, IT & Telecommunication, Medical & Healthcare, Semiconductor & Electronics, Industrial & Energy, Others), by North America (U.S., Canada), by Europe (Germany, UK, France, Italy, Spain, Rest of Europe), by Asia Pacific (China, Japan, India, South Korea, ANZ, Rest of Asia Pacific), by Latin America (Brazil, Mexico, Rest of Latin America), by MEA (UAE, Saudi Arabia, South Africa, Rest of MEA) Forecast 2025-2033

Publisher Logo

Spectrum Analyzer Market 2025-2033 Market Analysis: Trends, Dynamics, and Growth Opportunities


Key Insights

The size of the Spectrum Analyzer Market was valued at USD 1.5 Billion in 2024 and is projected to reach USD 2.74 Billion by 2033, with an expected CAGR of 9% during the forecast period. The Spectrum Analyzer Market has experienced significant growth in recent years, a trend that is expected to continue in the coming years. This surge in demand is primarily driven by advancements in wireless communication technologies, which are essential for the growing number of IoT and wireless devices. The increasing adoption of digital broadcasting and the need for efficient spectrum management are also key factors contributing to the market’s expansion. Spectrum analyzers play a crucial role in optimizing the use of wireless spectrum, making them indispensable tools for ensuring the efficiency and reliability of communication systems. Additionally, government regulations and initiatives aimed at managing spectrum resources and minimizing interference are further fueling the market's growth. As the demand for wireless connectivity continues to rise across industries, the spectrum analyzer market is poised for sustained growth, with increasing applications in telecommunications, defense, and other sectors relying on secure and efficient wireless communication.

Spectrum Analyzer Market Research Report - Market Size, Growth & Forecast

Spectrum Analyzer Market Concentration & Characteristics

The Spectrum Analyzer Market is concentrated in terms of revenue generation. Key players hold a significant share of the market, while a fragmented layer of small and medium-sized players cater to niche markets. The market is characterized by innovation, with companies investing in advanced technologies to enhance the performance and functionality of their products. Regulations play a crucial role in shaping the market landscape, with governments implementing standards and guidelines to ensure spectrum utilization efficiency. Product substitutes, such as network analyzers and signal generators, offer alternative solutions for certain applications, but spectrum analyzers remain the preferred choice for spectrum monitoring and analysis. End-user concentration is observed in sectors such as telecommunications, aerospace and defense, and research and development. The market has witnessed a moderate level of mergers and acquisitions, as companies seek to expand their product portfolios and geographical reach.

Spectrum Analyzer Market Trends

  1. Rising Demand for 5G and Beyond: The proliferation of 5G networks and the advent of technologies like 6G are driving the demand for spectrum analyzers, as these technologies require precise spectrum monitoring and analysis to ensure optimal performance and efficiency.
  2. Increased Digitalization and IoT: The exponential growth of IoT devices and the increasing adoption of digital technologies in various industries are creating a surge in wireless communication activities, necessitating the use of spectrum analyzers for spectrum monitoring and interference detection.
  3. Advancements in Spectrum Management: Governments worldwide are implementing advanced spectrum management techniques, such as dynamic spectrum allocation and cognitive radio, to optimize spectrum utilization. These techniques require spectrum analyzers for real-time monitoring and dynamic reconfiguration of spectrum usage.

Spectrum Analyzer Market Growth

Key Region or Country & Segment to Dominate the Market

Key Region:

  • North America: North America dominates the Spectrum Analyzer Market, with the United States being the largest contributor. The region is a hub for technology innovation and has a strong demand for spectrum analyzers in sectors such as telecommunications, aerospace and defense, and research and development.

Key Segment:

  • Benchtop Spectrum Analyzer: This segment is expected to hold the largest market share due to the high demand for high-performance and versatile spectrum analyzers in research and development labs, electronic manufacturing, and telecommunication companies.

Spectrum Analyzer Market Product Insights Report Coverage & Deliverables

This comprehensive report provides an in-depth analysis of the Spectrum Analyzer Market, covering market size, growth projections, market share, competitive landscape, regional insights, and industry trends. The report offers valuable insights into the market dynamics and key trends shaping the future of the industry.

Spectrum Analyzer Market Analysis

Market Size: The Spectrum Analyzer Market is valued at approximately 1.5 Billion and is projected to reach over 2.5 Billion by 2030, exhibiting a CAGR of around 9%.

Market Share: Key players in the market include Keysight Technologies, Rohde & Schwarz GmbH & Co., Anritsu Corporation, Advantest Corporation, B&K Precision Corporation, Giga-tronics Incorporated, and National Instruments Corporation.

Growth: The market is anticipated to experience significant growth due to the increasing demand for spectrum analyzers in various applications, the need for efficient spectrum management, and the ongoing advancements in wireless communication technologies.

Spectrum Analyzer Market Regional Insights

North America:

  • U.S.
  • Canada

Europe:

  • Germany
  • UK
  • France
  • Italy
  • Spain
  • Rest of Europe

Asia Pacific:

  • China
  • Japan
  • India
  • South Korea
  • ANZ
  • Rest of Asia Pacific

Latin America:

  • Brazil
  • Mexico
  • Rest of Latin America

MEA:

  • UAE
  • Saudi Arabia
  • South Africa
  • Rest of MEA

Driving Forces: What's Propelling the Spectrum Analyzer Market

  • Surge in demand for 5G and beyond
  • Increasing digitalization and IoT
  • Advancements in spectrum management techniques
  • Growing need for efficient spectrum utilization
  • Government regulations and initiatives

Challenges and Restraints in Spectrum Analyzer Market

  • High cost of advanced spectrum analyzers
  • Availability of alternative solutions, such as network analyzers
  • Lack of skilled professionals in some regions
  • Stringent regulatory requirements for spectrum analyzer usage

Emerging Trends in Spectrum Analyzer Market

  • Convergence of spectrum analyzers with other test and measurement devices
  • Integration of artificial intelligence and machine learning for enhanced spectrum monitoring
  • Development of handheld and portable spectrum analyzers for field applications
  • Growing adoption of cloud-based spectrum analyzer solutions

Spectrum Analyzer Industry News

  • September 2023: Teledyne LeCroy launched its new WaveMaster 8000HD high-bandwidth, high-definition oscilloscope (HDO) platform with models from 20 to 65 GHz of bandwidth, 12 bits of resolution, up to 320 GS/s of sample rate, and 8 gigapoints (Gpts) of acquisition memory.
  • November 2021: Rohde & Schwarz added new frequency ranges to its portable all-rounder spectrum analyzers. The new base models for the portable R&S FPL1000 take spectrum and signal analysis capabilities up to 26.5 GHz.

Leading Players in the Spectrum Analyzer Market

Spectrum Analyzer Market Segmentation

  • 1. Frequency Range
    • 1.1. <6 GHz
    • 1.2. 6 GHz–18 GHz
    • 1.3. >18 GHz
  • 2. Form Factor
    • 2.1. Handled Spectrum Analyzer
    • 2.2. Portable Spectrum Analyzer
    • 2.3. Benchtop Spectrum Analyzer
  • 3. Network Technology
    • 3.1. Wired
    • 3.2. Wireless
  • 4. End User
    • 4.1. Residential Automotive & Transportation
    • 4.2. IT & Telecommunication
    • 4.3. Medical & Healthcare
    • 4.4. Semiconductor & Electronics
    • 4.5. Industrial & Energy
    • 4.6. Others

Spectrum Analyzer Market Segmentation By Geography

  • 1. North America
    • 1.1. U.S.
    • 1.2. Canada
  • 2. Europe
    • 2.1. Germany
    • 2.2. UK
    • 2.3. France
    • 2.4. Italy
    • 2.5. Spain
    • 2.6. Rest of Europe
  • 3. Asia Pacific
    • 3.1. China
    • 3.2. Japan
    • 3.3. India
    • 3.4. South Korea
    • 3.5. ANZ
    • 3.6. Rest of Asia Pacific
  • 4. Latin America
    • 4.1. Brazil
    • 4.2. Mexico
    • 4.3. Rest of Latin America
  • 5. MEA
    • 5.1. UAE
    • 5.2. Saudi Arabia
    • 5.3. South Africa
    • 5.4. Rest of MEA

Spectrum Analyzer Market Regional Share


Spectrum Analyzer Market REPORT HIGHLIGHTS

AspectsDetails
Study Period 2019-2033
Base Year 2024
Estimated Year 2025
Forecast Period2025-2033
Historical Period2019-2024
Growth RateCAGR of 9% from 2019-2033
Segmentation
    • By Frequency Range
      • <6 GHz
      • 6 GHz–18 GHz
      • >18 GHz
    • By Form Factor
      • Handled Spectrum Analyzer
      • Portable Spectrum Analyzer
      • Benchtop Spectrum Analyzer
    • By Network Technology
      • Wired
      • Wireless
    • By End User
      • Residential Automotive & Transportation
      • IT & Telecommunication
      • Medical & Healthcare
      • Semiconductor & Electronics
      • Industrial & Energy
      • Others
  • By Geography
    • North America
      • U.S.
      • Canada
    • Europe
      • Germany
      • UK
      • France
      • Italy
      • Spain
      • Rest of Europe
    • Asia Pacific
      • China
      • Japan
      • India
      • South Korea
      • ANZ
      • Rest of Asia Pacific
    • Latin America
      • Brazil
      • Mexico
      • Rest of Latin America
    • MEA
      • UAE
      • Saudi Arabia
      • South Africa
      • Rest of MEA


Table of Contents

  1. 1. Introduction
    • 1.1. Research Scope
    • 1.2. Market Segmentation
    • 1.3. Research Methodology
    • 1.4. Definitions and Assumptions
  2. 2. Executive Summary
    • 2.1. Introduction
  3. 3. Market Dynamics
    • 3.1. Introduction
      • 3.2. Market Drivers
        • 3.2.1 Rising adoption of spectrum analyzers in testing and measurement
        • 3.2.2 Technological advancements and innovation
        • 3.2.3 Rapid expansion of electronic devices
        • 3.2.4 Expansion of aerospace and defense sector
        • 3.2.5 Rising adoption of spectrum analyzers in research and development
      • 3.3. Market Restrains
        • 3.3.1 Cost constraints
        • 3.3.2 Technological complexity
      • 3.4. Market Trends
        • 3.4.1. Rising Demand for 5G and Beyond
  4. 4. Market Factor Analysis
    • 4.1. Porters Five Forces
    • 4.2. Supply/Value Chain
    • 4.3. PESTEL analysis
    • 4.4. Market Entropy
    • 4.5. Patent/Trademark Analysis
  5. 5. Global Spectrum Analyzer Market Analysis, Insights and Forecast, 2019-2031
    • 5.1. Market Analysis, Insights and Forecast - by Frequency Range
      • 5.1.1. <6 GHz
      • 5.1.2. 6 GHz–18 GHz
      • 5.1.3. >18 GHz
    • 5.2. Market Analysis, Insights and Forecast - by Form Factor
      • 5.2.1. Handled Spectrum Analyzer
      • 5.2.2. Portable Spectrum Analyzer
      • 5.2.3. Benchtop Spectrum Analyzer
    • 5.3. Market Analysis, Insights and Forecast - by Network Technology
      • 5.3.1. Wired
      • 5.3.2. Wireless
    • 5.4. Market Analysis, Insights and Forecast - by End User
      • 5.4.1. Residential Automotive & Transportation
      • 5.4.2. IT & Telecommunication
      • 5.4.3. Medical & Healthcare
      • 5.4.4. Semiconductor & Electronics
      • 5.4.5. Industrial & Energy
      • 5.4.6. Others
    • 5.5. Market Analysis, Insights and Forecast - by Region
      • 5.5.1. North America
      • 5.5.2. Europe
      • 5.5.3. Asia Pacific
      • 5.5.4. Latin America
      • 5.5.5. MEA
  6. 6. North America Spectrum Analyzer Market Analysis, Insights and Forecast, 2019-2031
    • 6.1. Market Analysis, Insights and Forecast - by Frequency Range
      • 6.1.1. <6 GHz
      • 6.1.2. 6 GHz–18 GHz
      • 6.1.3. >18 GHz
    • 6.2. Market Analysis, Insights and Forecast - by Form Factor
      • 6.2.1. Handled Spectrum Analyzer
      • 6.2.2. Portable Spectrum Analyzer
      • 6.2.3. Benchtop Spectrum Analyzer
    • 6.3. Market Analysis, Insights and Forecast - by Network Technology
      • 6.3.1. Wired
      • 6.3.2. Wireless
    • 6.4. Market Analysis, Insights and Forecast - by End User
      • 6.4.1. Residential Automotive & Transportation
      • 6.4.2. IT & Telecommunication
      • 6.4.3. Medical & Healthcare
      • 6.4.4. Semiconductor & Electronics
      • 6.4.5. Industrial & Energy
      • 6.4.6. Others
  7. 7. Europe Spectrum Analyzer Market Analysis, Insights and Forecast, 2019-2031
    • 7.1. Market Analysis, Insights and Forecast - by Frequency Range
      • 7.1.1. <6 GHz
      • 7.1.2. 6 GHz–18 GHz
      • 7.1.3. >18 GHz
    • 7.2. Market Analysis, Insights and Forecast - by Form Factor
      • 7.2.1. Handled Spectrum Analyzer
      • 7.2.2. Portable Spectrum Analyzer
      • 7.2.3. Benchtop Spectrum Analyzer
    • 7.3. Market Analysis, Insights and Forecast - by Network Technology
      • 7.3.1. Wired
      • 7.3.2. Wireless
    • 7.4. Market Analysis, Insights and Forecast - by End User
      • 7.4.1. Residential Automotive & Transportation
      • 7.4.2. IT & Telecommunication
      • 7.4.3. Medical & Healthcare
      • 7.4.4. Semiconductor & Electronics
      • 7.4.5. Industrial & Energy
      • 7.4.6. Others
  8. 8. Asia Pacific Spectrum Analyzer Market Analysis, Insights and Forecast, 2019-2031
    • 8.1. Market Analysis, Insights and Forecast - by Frequency Range
      • 8.1.1. <6 GHz
      • 8.1.2. 6 GHz–18 GHz
      • 8.1.3. >18 GHz
    • 8.2. Market Analysis, Insights and Forecast - by Form Factor
      • 8.2.1. Handled Spectrum Analyzer
      • 8.2.2. Portable Spectrum Analyzer
      • 8.2.3. Benchtop Spectrum Analyzer
    • 8.3. Market Analysis, Insights and Forecast - by Network Technology
      • 8.3.1. Wired
      • 8.3.2. Wireless
    • 8.4. Market Analysis, Insights and Forecast - by End User
      • 8.4.1. Residential Automotive & Transportation
      • 8.4.2. IT & Telecommunication
      • 8.4.3. Medical & Healthcare
      • 8.4.4. Semiconductor & Electronics
      • 8.4.5. Industrial & Energy
      • 8.4.6. Others
  9. 9. Latin America Spectrum Analyzer Market Analysis, Insights and Forecast, 2019-2031
    • 9.1. Market Analysis, Insights and Forecast - by Frequency Range
      • 9.1.1. <6 GHz
      • 9.1.2. 6 GHz–18 GHz
      • 9.1.3. >18 GHz
    • 9.2. Market Analysis, Insights and Forecast - by Form Factor
      • 9.2.1. Handled Spectrum Analyzer
      • 9.2.2. Portable Spectrum Analyzer
      • 9.2.3. Benchtop Spectrum Analyzer
    • 9.3. Market Analysis, Insights and Forecast - by Network Technology
      • 9.3.1. Wired
      • 9.3.2. Wireless
    • 9.4. Market Analysis, Insights and Forecast - by End User
      • 9.4.1. Residential Automotive & Transportation
      • 9.4.2. IT & Telecommunication
      • 9.4.3. Medical & Healthcare
      • 9.4.4. Semiconductor & Electronics
      • 9.4.5. Industrial & Energy
      • 9.4.6. Others
  10. 10. MEA Spectrum Analyzer Market Analysis, Insights and Forecast, 2019-2031
    • 10.1. Market Analysis, Insights and Forecast - by Frequency Range
      • 10.1.1. <6 GHz
      • 10.1.2. 6 GHz–18 GHz
      • 10.1.3. >18 GHz
    • 10.2. Market Analysis, Insights and Forecast - by Form Factor
      • 10.2.1. Handled Spectrum Analyzer
      • 10.2.2. Portable Spectrum Analyzer
      • 10.2.3. Benchtop Spectrum Analyzer
    • 10.3. Market Analysis, Insights and Forecast - by Network Technology
      • 10.3.1. Wired
      • 10.3.2. Wireless
    • 10.4. Market Analysis, Insights and Forecast - by End User
      • 10.4.1. Residential Automotive & Transportation
      • 10.4.2. IT & Telecommunication
      • 10.4.3. Medical & Healthcare
      • 10.4.4. Semiconductor & Electronics
      • 10.4.5. Industrial & Energy
      • 10.4.6. Others
  11. 11. Competitive Analysis
    • 11.1. Global Market Share Analysis 2024
      • 11.2. Company Profiles
        • 11.2.1 Keysight Technologies
          • 11.2.1.1. Overview
          • 11.2.1.2. Products
          • 11.2.1.3. SWOT Analysis
          • 11.2.1.4. Recent Developments
          • 11.2.1.5. Financials (Based on Availability)
        • 11.2.2 Rohde & Schwarz GmbH & Co
          • 11.2.2.1. Overview
          • 11.2.2.2. Products
          • 11.2.2.3. SWOT Analysis
          • 11.2.2.4. Recent Developments
          • 11.2.2.5. Financials (Based on Availability)
        • 11.2.3 Anritsu Corporation
          • 11.2.3.1. Overview
          • 11.2.3.2. Products
          • 11.2.3.3. SWOT Analysis
          • 11.2.3.4. Recent Developments
          • 11.2.3.5. Financials (Based on Availability)
        • 11.2.4 Advantest Corporation
          • 11.2.4.1. Overview
          • 11.2.4.2. Products
          • 11.2.4.3. SWOT Analysis
          • 11.2.4.4. Recent Developments
          • 11.2.4.5. Financials (Based on Availability)
        • 11.2.5 B&K Precision Corporation
          • 11.2.5.1. Overview
          • 11.2.5.2. Products
          • 11.2.5.3. SWOT Analysis
          • 11.2.5.4. Recent Developments
          • 11.2.5.5. Financials (Based on Availability)
        • 11.2.6 Giga-tronics Incorporated
          • 11.2.6.1. Overview
          • 11.2.6.2. Products
          • 11.2.6.3. SWOT Analysis
          • 11.2.6.4. Recent Developments
          • 11.2.6.5. Financials (Based on Availability)
        • 11.2.7 National Instruments Corporation
          • 11.2.7.1. Overview
          • 11.2.7.2. Products
          • 11.2.7.3. SWOT Analysis
          • 11.2.7.4. Recent Developments
          • 11.2.7.5. Financials (Based on Availability)

List of Figures

  1. Figure 1: Global Spectrum Analyzer Market Revenue Breakdown (Billion, %) by Region 2024 & 2032
  2. Figure 2: Global Spectrum Analyzer Market Volume Breakdown (units, %) by Region 2024 & 2032
  3. Figure 3: North America Spectrum Analyzer Market Revenue (Billion), by Frequency Range 2024 & 2032
  4. Figure 4: North America Spectrum Analyzer Market Volume (units), by Frequency Range 2024 & 2032
  5. Figure 5: North America Spectrum Analyzer Market Revenue Share (%), by Frequency Range 2024 & 2032
  6. Figure 6: North America Spectrum Analyzer Market Volume Share (%), by Frequency Range 2024 & 2032
  7. Figure 7: North America Spectrum Analyzer Market Revenue (Billion), by Form Factor 2024 & 2032
  8. Figure 8: North America Spectrum Analyzer Market Volume (units), by Form Factor 2024 & 2032
  9. Figure 9: North America Spectrum Analyzer Market Revenue Share (%), by Form Factor 2024 & 2032
  10. Figure 10: North America Spectrum Analyzer Market Volume Share (%), by Form Factor 2024 & 2032
  11. Figure 11: North America Spectrum Analyzer Market Revenue (Billion), by Network Technology 2024 & 2032
  12. Figure 12: North America Spectrum Analyzer Market Volume (units), by Network Technology 2024 & 2032
  13. Figure 13: North America Spectrum Analyzer Market Revenue Share (%), by Network Technology 2024 & 2032
  14. Figure 14: North America Spectrum Analyzer Market Volume Share (%), by Network Technology 2024 & 2032
  15. Figure 15: North America Spectrum Analyzer Market Revenue (Billion), by End User 2024 & 2032
  16. Figure 16: North America Spectrum Analyzer Market Volume (units), by End User 2024 & 2032
  17. Figure 17: North America Spectrum Analyzer Market Revenue Share (%), by End User 2024 & 2032
  18. Figure 18: North America Spectrum Analyzer Market Volume Share (%), by End User 2024 & 2032
  19. Figure 19: North America Spectrum Analyzer Market Revenue (Billion), by Country 2024 & 2032
  20. Figure 20: North America Spectrum Analyzer Market Volume (units), by Country 2024 & 2032
  21. Figure 21: North America Spectrum Analyzer Market Revenue Share (%), by Country 2024 & 2032
  22. Figure 22: North America Spectrum Analyzer Market Volume Share (%), by Country 2024 & 2032
  23. Figure 23: Europe Spectrum Analyzer Market Revenue (Billion), by Frequency Range 2024 & 2032
  24. Figure 24: Europe Spectrum Analyzer Market Volume (units), by Frequency Range 2024 & 2032
  25. Figure 25: Europe Spectrum Analyzer Market Revenue Share (%), by Frequency Range 2024 & 2032
  26. Figure 26: Europe Spectrum Analyzer Market Volume Share (%), by Frequency Range 2024 & 2032
  27. Figure 27: Europe Spectrum Analyzer Market Revenue (Billion), by Form Factor 2024 & 2032
  28. Figure 28: Europe Spectrum Analyzer Market Volume (units), by Form Factor 2024 & 2032
  29. Figure 29: Europe Spectrum Analyzer Market Revenue Share (%), by Form Factor 2024 & 2032
  30. Figure 30: Europe Spectrum Analyzer Market Volume Share (%), by Form Factor 2024 & 2032
  31. Figure 31: Europe Spectrum Analyzer Market Revenue (Billion), by Network Technology 2024 & 2032
  32. Figure 32: Europe Spectrum Analyzer Market Volume (units), by Network Technology 2024 & 2032
  33. Figure 33: Europe Spectrum Analyzer Market Revenue Share (%), by Network Technology 2024 & 2032
  34. Figure 34: Europe Spectrum Analyzer Market Volume Share (%), by Network Technology 2024 & 2032
  35. Figure 35: Europe Spectrum Analyzer Market Revenue (Billion), by End User 2024 & 2032
  36. Figure 36: Europe Spectrum Analyzer Market Volume (units), by End User 2024 & 2032
  37. Figure 37: Europe Spectrum Analyzer Market Revenue Share (%), by End User 2024 & 2032
  38. Figure 38: Europe Spectrum Analyzer Market Volume Share (%), by End User 2024 & 2032
  39. Figure 39: Europe Spectrum Analyzer Market Revenue (Billion), by Country 2024 & 2032
  40. Figure 40: Europe Spectrum Analyzer Market Volume (units), by Country 2024 & 2032
  41. Figure 41: Europe Spectrum Analyzer Market Revenue Share (%), by Country 2024 & 2032
  42. Figure 42: Europe Spectrum Analyzer Market Volume Share (%), by Country 2024 & 2032
  43. Figure 43: Asia Pacific Spectrum Analyzer Market Revenue (Billion), by Frequency Range 2024 & 2032
  44. Figure 44: Asia Pacific Spectrum Analyzer Market Volume (units), by Frequency Range 2024 & 2032
  45. Figure 45: Asia Pacific Spectrum Analyzer Market Revenue Share (%), by Frequency Range 2024 & 2032
  46. Figure 46: Asia Pacific Spectrum Analyzer Market Volume Share (%), by Frequency Range 2024 & 2032
  47. Figure 47: Asia Pacific Spectrum Analyzer Market Revenue (Billion), by Form Factor 2024 & 2032
  48. Figure 48: Asia Pacific Spectrum Analyzer Market Volume (units), by Form Factor 2024 & 2032
  49. Figure 49: Asia Pacific Spectrum Analyzer Market Revenue Share (%), by Form Factor 2024 & 2032
  50. Figure 50: Asia Pacific Spectrum Analyzer Market Volume Share (%), by Form Factor 2024 & 2032
  51. Figure 51: Asia Pacific Spectrum Analyzer Market Revenue (Billion), by Network Technology 2024 & 2032
  52. Figure 52: Asia Pacific Spectrum Analyzer Market Volume (units), by Network Technology 2024 & 2032
  53. Figure 53: Asia Pacific Spectrum Analyzer Market Revenue Share (%), by Network Technology 2024 & 2032
  54. Figure 54: Asia Pacific Spectrum Analyzer Market Volume Share (%), by Network Technology 2024 & 2032
  55. Figure 55: Asia Pacific Spectrum Analyzer Market Revenue (Billion), by End User 2024 & 2032
  56. Figure 56: Asia Pacific Spectrum Analyzer Market Volume (units), by End User 2024 & 2032
  57. Figure 57: Asia Pacific Spectrum Analyzer Market Revenue Share (%), by End User 2024 & 2032
  58. Figure 58: Asia Pacific Spectrum Analyzer Market Volume Share (%), by End User 2024 & 2032
  59. Figure 59: Asia Pacific Spectrum Analyzer Market Revenue (Billion), by Country 2024 & 2032
  60. Figure 60: Asia Pacific Spectrum Analyzer Market Volume (units), by Country 2024 & 2032
  61. Figure 61: Asia Pacific Spectrum Analyzer Market Revenue Share (%), by Country 2024 & 2032
  62. Figure 62: Asia Pacific Spectrum Analyzer Market Volume Share (%), by Country 2024 & 2032
  63. Figure 63: Latin America Spectrum Analyzer Market Revenue (Billion), by Frequency Range 2024 & 2032
  64. Figure 64: Latin America Spectrum Analyzer Market Volume (units), by Frequency Range 2024 & 2032
  65. Figure 65: Latin America Spectrum Analyzer Market Revenue Share (%), by Frequency Range 2024 & 2032
  66. Figure 66: Latin America Spectrum Analyzer Market Volume Share (%), by Frequency Range 2024 & 2032
  67. Figure 67: Latin America Spectrum Analyzer Market Revenue (Billion), by Form Factor 2024 & 2032
  68. Figure 68: Latin America Spectrum Analyzer Market Volume (units), by Form Factor 2024 & 2032
  69. Figure 69: Latin America Spectrum Analyzer Market Revenue Share (%), by Form Factor 2024 & 2032
  70. Figure 70: Latin America Spectrum Analyzer Market Volume Share (%), by Form Factor 2024 & 2032
  71. Figure 71: Latin America Spectrum Analyzer Market Revenue (Billion), by Network Technology 2024 & 2032
  72. Figure 72: Latin America Spectrum Analyzer Market Volume (units), by Network Technology 2024 & 2032
  73. Figure 73: Latin America Spectrum Analyzer Market Revenue Share (%), by Network Technology 2024 & 2032
  74. Figure 74: Latin America Spectrum Analyzer Market Volume Share (%), by Network Technology 2024 & 2032
  75. Figure 75: Latin America Spectrum Analyzer Market Revenue (Billion), by End User 2024 & 2032
  76. Figure 76: Latin America Spectrum Analyzer Market Volume (units), by End User 2024 & 2032
  77. Figure 77: Latin America Spectrum Analyzer Market Revenue Share (%), by End User 2024 & 2032
  78. Figure 78: Latin America Spectrum Analyzer Market Volume Share (%), by End User 2024 & 2032
  79. Figure 79: Latin America Spectrum Analyzer Market Revenue (Billion), by Country 2024 & 2032
  80. Figure 80: Latin America Spectrum Analyzer Market Volume (units), by Country 2024 & 2032
  81. Figure 81: Latin America Spectrum Analyzer Market Revenue Share (%), by Country 2024 & 2032
  82. Figure 82: Latin America Spectrum Analyzer Market Volume Share (%), by Country 2024 & 2032
  83. Figure 83: MEA Spectrum Analyzer Market Revenue (Billion), by Frequency Range 2024 & 2032
  84. Figure 84: MEA Spectrum Analyzer Market Volume (units), by Frequency Range 2024 & 2032
  85. Figure 85: MEA Spectrum Analyzer Market Revenue Share (%), by Frequency Range 2024 & 2032
  86. Figure 86: MEA Spectrum Analyzer Market Volume Share (%), by Frequency Range 2024 & 2032
  87. Figure 87: MEA Spectrum Analyzer Market Revenue (Billion), by Form Factor 2024 & 2032
  88. Figure 88: MEA Spectrum Analyzer Market Volume (units), by Form Factor 2024 & 2032
  89. Figure 89: MEA Spectrum Analyzer Market Revenue Share (%), by Form Factor 2024 & 2032
  90. Figure 90: MEA Spectrum Analyzer Market Volume Share (%), by Form Factor 2024 & 2032
  91. Figure 91: MEA Spectrum Analyzer Market Revenue (Billion), by Network Technology 2024 & 2032
  92. Figure 92: MEA Spectrum Analyzer Market Volume (units), by Network Technology 2024 & 2032
  93. Figure 93: MEA Spectrum Analyzer Market Revenue Share (%), by Network Technology 2024 & 2032
  94. Figure 94: MEA Spectrum Analyzer Market Volume Share (%), by Network Technology 2024 & 2032
  95. Figure 95: MEA Spectrum Analyzer Market Revenue (Billion), by End User 2024 & 2032
  96. Figure 96: MEA Spectrum Analyzer Market Volume (units), by End User 2024 & 2032
  97. Figure 97: MEA Spectrum Analyzer Market Revenue Share (%), by End User 2024 & 2032
  98. Figure 98: MEA Spectrum Analyzer Market Volume Share (%), by End User 2024 & 2032
  99. Figure 99: MEA Spectrum Analyzer Market Revenue (Billion), by Country 2024 & 2032
  100. Figure 100: MEA Spectrum Analyzer Market Volume (units), by Country 2024 & 2032
  101. Figure 101: MEA Spectrum Analyzer Market Revenue Share (%), by Country 2024 & 2032
  102. Figure 102: MEA Spectrum Analyzer Market Volume Share (%), by Country 2024 & 2032

List of Tables

  1. Table 1: Global Spectrum Analyzer Market Revenue Billion Forecast, by Region 2019 & 2032
  2. Table 2: Global Spectrum Analyzer Market Volume units Forecast, by Region 2019 & 2032
  3. Table 3: Global Spectrum Analyzer Market Revenue Billion Forecast, by Frequency Range 2019 & 2032
  4. Table 4: Global Spectrum Analyzer Market Volume units Forecast, by Frequency Range 2019 & 2032
  5. Table 5: Global Spectrum Analyzer Market Revenue Billion Forecast, by Form Factor 2019 & 2032
  6. Table 6: Global Spectrum Analyzer Market Volume units Forecast, by Form Factor 2019 & 2032
  7. Table 7: Global Spectrum Analyzer Market Revenue Billion Forecast, by Network Technology 2019 & 2032
  8. Table 8: Global Spectrum Analyzer Market Volume units Forecast, by Network Technology 2019 & 2032
  9. Table 9: Global Spectrum Analyzer Market Revenue Billion Forecast, by End User 2019 & 2032
  10. Table 10: Global Spectrum Analyzer Market Volume units Forecast, by End User 2019 & 2032
  11. Table 11: Global Spectrum Analyzer Market Revenue Billion Forecast, by Region 2019 & 2032
  12. Table 12: Global Spectrum Analyzer Market Volume units Forecast, by Region 2019 & 2032
  13. Table 13: Global Spectrum Analyzer Market Revenue Billion Forecast, by Frequency Range 2019 & 2032
  14. Table 14: Global Spectrum Analyzer Market Volume units Forecast, by Frequency Range 2019 & 2032
  15. Table 15: Global Spectrum Analyzer Market Revenue Billion Forecast, by Form Factor 2019 & 2032
  16. Table 16: Global Spectrum Analyzer Market Volume units Forecast, by Form Factor 2019 & 2032
  17. Table 17: Global Spectrum Analyzer Market Revenue Billion Forecast, by Network Technology 2019 & 2032
  18. Table 18: Global Spectrum Analyzer Market Volume units Forecast, by Network Technology 2019 & 2032
  19. Table 19: Global Spectrum Analyzer Market Revenue Billion Forecast, by End User 2019 & 2032
  20. Table 20: Global Spectrum Analyzer Market Volume units Forecast, by End User 2019 & 2032
  21. Table 21: Global Spectrum Analyzer Market Revenue Billion Forecast, by Country 2019 & 2032
  22. Table 22: Global Spectrum Analyzer Market Volume units Forecast, by Country 2019 & 2032
  23. Table 23: U.S. Spectrum Analyzer Market Revenue (Billion) Forecast, by Application 2019 & 2032
  24. Table 24: U.S. Spectrum Analyzer Market Volume (units) Forecast, by Application 2019 & 2032
  25. Table 25: Canada Spectrum Analyzer Market Revenue (Billion) Forecast, by Application 2019 & 2032
  26. Table 26: Canada Spectrum Analyzer Market Volume (units) Forecast, by Application 2019 & 2032
  27. Table 27: Global Spectrum Analyzer Market Revenue Billion Forecast, by Frequency Range 2019 & 2032
  28. Table 28: Global Spectrum Analyzer Market Volume units Forecast, by Frequency Range 2019 & 2032
  29. Table 29: Global Spectrum Analyzer Market Revenue Billion Forecast, by Form Factor 2019 & 2032
  30. Table 30: Global Spectrum Analyzer Market Volume units Forecast, by Form Factor 2019 & 2032
  31. Table 31: Global Spectrum Analyzer Market Revenue Billion Forecast, by Network Technology 2019 & 2032
  32. Table 32: Global Spectrum Analyzer Market Volume units Forecast, by Network Technology 2019 & 2032
  33. Table 33: Global Spectrum Analyzer Market Revenue Billion Forecast, by End User 2019 & 2032
  34. Table 34: Global Spectrum Analyzer Market Volume units Forecast, by End User 2019 & 2032
  35. Table 35: Global Spectrum Analyzer Market Revenue Billion Forecast, by Country 2019 & 2032
  36. Table 36: Global Spectrum Analyzer Market Volume units Forecast, by Country 2019 & 2032
  37. Table 37: Germany Spectrum Analyzer Market Revenue (Billion) Forecast, by Application 2019 & 2032
  38. Table 38: Germany Spectrum Analyzer Market Volume (units) Forecast, by Application 2019 & 2032
  39. Table 39: UK Spectrum Analyzer Market Revenue (Billion) Forecast, by Application 2019 & 2032
  40. Table 40: UK Spectrum Analyzer Market Volume (units) Forecast, by Application 2019 & 2032
  41. Table 41: France Spectrum Analyzer Market Revenue (Billion) Forecast, by Application 2019 & 2032
  42. Table 42: France Spectrum Analyzer Market Volume (units) Forecast, by Application 2019 & 2032
  43. Table 43: Italy Spectrum Analyzer Market Revenue (Billion) Forecast, by Application 2019 & 2032
  44. Table 44: Italy Spectrum Analyzer Market Volume (units) Forecast, by Application 2019 & 2032
  45. Table 45: Spain Spectrum Analyzer Market Revenue (Billion) Forecast, by Application 2019 & 2032
  46. Table 46: Spain Spectrum Analyzer Market Volume (units) Forecast, by Application 2019 & 2032
  47. Table 47: Rest of Europe Spectrum Analyzer Market Revenue (Billion) Forecast, by Application 2019 & 2032
  48. Table 48: Rest of Europe Spectrum Analyzer Market Volume (units) Forecast, by Application 2019 & 2032
  49. Table 49: Global Spectrum Analyzer Market Revenue Billion Forecast, by Frequency Range 2019 & 2032
  50. Table 50: Global Spectrum Analyzer Market Volume units Forecast, by Frequency Range 2019 & 2032
  51. Table 51: Global Spectrum Analyzer Market Revenue Billion Forecast, by Form Factor 2019 & 2032
  52. Table 52: Global Spectrum Analyzer Market Volume units Forecast, by Form Factor 2019 & 2032
  53. Table 53: Global Spectrum Analyzer Market Revenue Billion Forecast, by Network Technology 2019 & 2032
  54. Table 54: Global Spectrum Analyzer Market Volume units Forecast, by Network Technology 2019 & 2032
  55. Table 55: Global Spectrum Analyzer Market Revenue Billion Forecast, by End User 2019 & 2032
  56. Table 56: Global Spectrum Analyzer Market Volume units Forecast, by End User 2019 & 2032
  57. Table 57: Global Spectrum Analyzer Market Revenue Billion Forecast, by Country 2019 & 2032
  58. Table 58: Global Spectrum Analyzer Market Volume units Forecast, by Country 2019 & 2032
  59. Table 59: China Spectrum Analyzer Market Revenue (Billion) Forecast, by Application 2019 & 2032
  60. Table 60: China Spectrum Analyzer Market Volume (units) Forecast, by Application 2019 & 2032
  61. Table 61: Japan Spectrum Analyzer Market Revenue (Billion) Forecast, by Application 2019 & 2032
  62. Table 62: Japan Spectrum Analyzer Market Volume (units) Forecast, by Application 2019 & 2032
  63. Table 63: India Spectrum Analyzer Market Revenue (Billion) Forecast, by Application 2019 & 2032
  64. Table 64: India Spectrum Analyzer Market Volume (units) Forecast, by Application 2019 & 2032
  65. Table 65: South Korea Spectrum Analyzer Market Revenue (Billion) Forecast, by Application 2019 & 2032
  66. Table 66: South Korea Spectrum Analyzer Market Volume (units) Forecast, by Application 2019 & 2032
  67. Table 67: ANZ Spectrum Analyzer Market Revenue (Billion) Forecast, by Application 2019 & 2032
  68. Table 68: ANZ Spectrum Analyzer Market Volume (units) Forecast, by Application 2019 & 2032
  69. Table 69: Rest of Asia Pacific Spectrum Analyzer Market Revenue (Billion) Forecast, by Application 2019 & 2032
  70. Table 70: Rest of Asia Pacific Spectrum Analyzer Market Volume (units) Forecast, by Application 2019 & 2032
  71. Table 71: Global Spectrum Analyzer Market Revenue Billion Forecast, by Frequency Range 2019 & 2032
  72. Table 72: Global Spectrum Analyzer Market Volume units Forecast, by Frequency Range 2019 & 2032
  73. Table 73: Global Spectrum Analyzer Market Revenue Billion Forecast, by Form Factor 2019 & 2032
  74. Table 74: Global Spectrum Analyzer Market Volume units Forecast, by Form Factor 2019 & 2032
  75. Table 75: Global Spectrum Analyzer Market Revenue Billion Forecast, by Network Technology 2019 & 2032
  76. Table 76: Global Spectrum Analyzer Market Volume units Forecast, by Network Technology 2019 & 2032
  77. Table 77: Global Spectrum Analyzer Market Revenue Billion Forecast, by End User 2019 & 2032
  78. Table 78: Global Spectrum Analyzer Market Volume units Forecast, by End User 2019 & 2032
  79. Table 79: Global Spectrum Analyzer Market Revenue Billion Forecast, by Country 2019 & 2032
  80. Table 80: Global Spectrum Analyzer Market Volume units Forecast, by Country 2019 & 2032
  81. Table 81: Brazil Spectrum Analyzer Market Revenue (Billion) Forecast, by Application 2019 & 2032
  82. Table 82: Brazil Spectrum Analyzer Market Volume (units) Forecast, by Application 2019 & 2032
  83. Table 83: Mexico Spectrum Analyzer Market Revenue (Billion) Forecast, by Application 2019 & 2032
  84. Table 84: Mexico Spectrum Analyzer Market Volume (units) Forecast, by Application 2019 & 2032
  85. Table 85: Rest of Latin America Spectrum Analyzer Market Revenue (Billion) Forecast, by Application 2019 & 2032
  86. Table 86: Rest of Latin America Spectrum Analyzer Market Volume (units) Forecast, by Application 2019 & 2032
  87. Table 87: Global Spectrum Analyzer Market Revenue Billion Forecast, by Frequency Range 2019 & 2032
  88. Table 88: Global Spectrum Analyzer Market Volume units Forecast, by Frequency Range 2019 & 2032
  89. Table 89: Global Spectrum Analyzer Market Revenue Billion Forecast, by Form Factor 2019 & 2032
  90. Table 90: Global Spectrum Analyzer Market Volume units Forecast, by Form Factor 2019 & 2032
  91. Table 91: Global Spectrum Analyzer Market Revenue Billion Forecast, by Network Technology 2019 & 2032
  92. Table 92: Global Spectrum Analyzer Market Volume units Forecast, by Network Technology 2019 & 2032
  93. Table 93: Global Spectrum Analyzer Market Revenue Billion Forecast, by End User 2019 & 2032
  94. Table 94: Global Spectrum Analyzer Market Volume units Forecast, by End User 2019 & 2032
  95. Table 95: Global Spectrum Analyzer Market Revenue Billion Forecast, by Country 2019 & 2032
  96. Table 96: Global Spectrum Analyzer Market Volume units Forecast, by Country 2019 & 2032
  97. Table 97: UAE Spectrum Analyzer Market Revenue (Billion) Forecast, by Application 2019 & 2032
  98. Table 98: UAE Spectrum Analyzer Market Volume (units) Forecast, by Application 2019 & 2032
  99. Table 99: Saudi Arabia Spectrum Analyzer Market Revenue (Billion) Forecast, by Application 2019 & 2032
  100. Table 100: Saudi Arabia Spectrum Analyzer Market Volume (units) Forecast, by Application 2019 & 2032
  101. Table 101: South Africa Spectrum Analyzer Market Revenue (Billion) Forecast, by Application 2019 & 2032
  102. Table 102: South Africa Spectrum Analyzer Market Volume (units) Forecast, by Application 2019 & 2032
  103. Table 103: Rest of MEA Spectrum Analyzer Market Revenue (Billion) Forecast, by Application 2019 & 2032
  104. Table 104: Rest of MEA Spectrum Analyzer Market Volume (units) Forecast, by Application 2019 & 2032


STEP 1 - Identification of Relevant Samples Size from Population Database

Step Chart
bar chart
method chart

STEP 2 - Approaches for Defining Global Market Size (Value, Volume* & Price*)

approach chart
Top-down and bottom-up approaches are used to validate the global market size and estimate the market size for manufactures, regional segemnts, product and application.

Note* : In applicable scenarios

STEP 3 - Data Sources

Primary Research

  • Web Analytics
  • Survey Reports
  • Research Institute
  • Latest Research Reports
  • Opinion Leaders

Secondary Research

  • Annual Reports
  • White Paper
  • Latest Press Release
  • Industry Association
  • Paid Database
  • Investor Presentations
approach chart

STEP 4 - Data Triangulation

Involves using different sources of information in order to increase the validity of a study

These sources are likely to be stakeholders in a program - participants, other researchers, program staff, other community members, and so on.

Then we put all data in single framework & apply various statistical tools to find out the dynamic on the market.

During the analysis stage, feedback from the stakeholder groups would be compared to determine areas of agreement as well as areas of divergence

Additionally after gathering mix and scattered data from wide range of sources, data is triangull- ated and correlated to come up with estimated figures which are further validated through primary mediums, or industry experts, opinion leader.

Frequently Asked Questions

1. What is the projected Compound Annual Growth Rate (CAGR) of the Spectrum Analyzer Market?

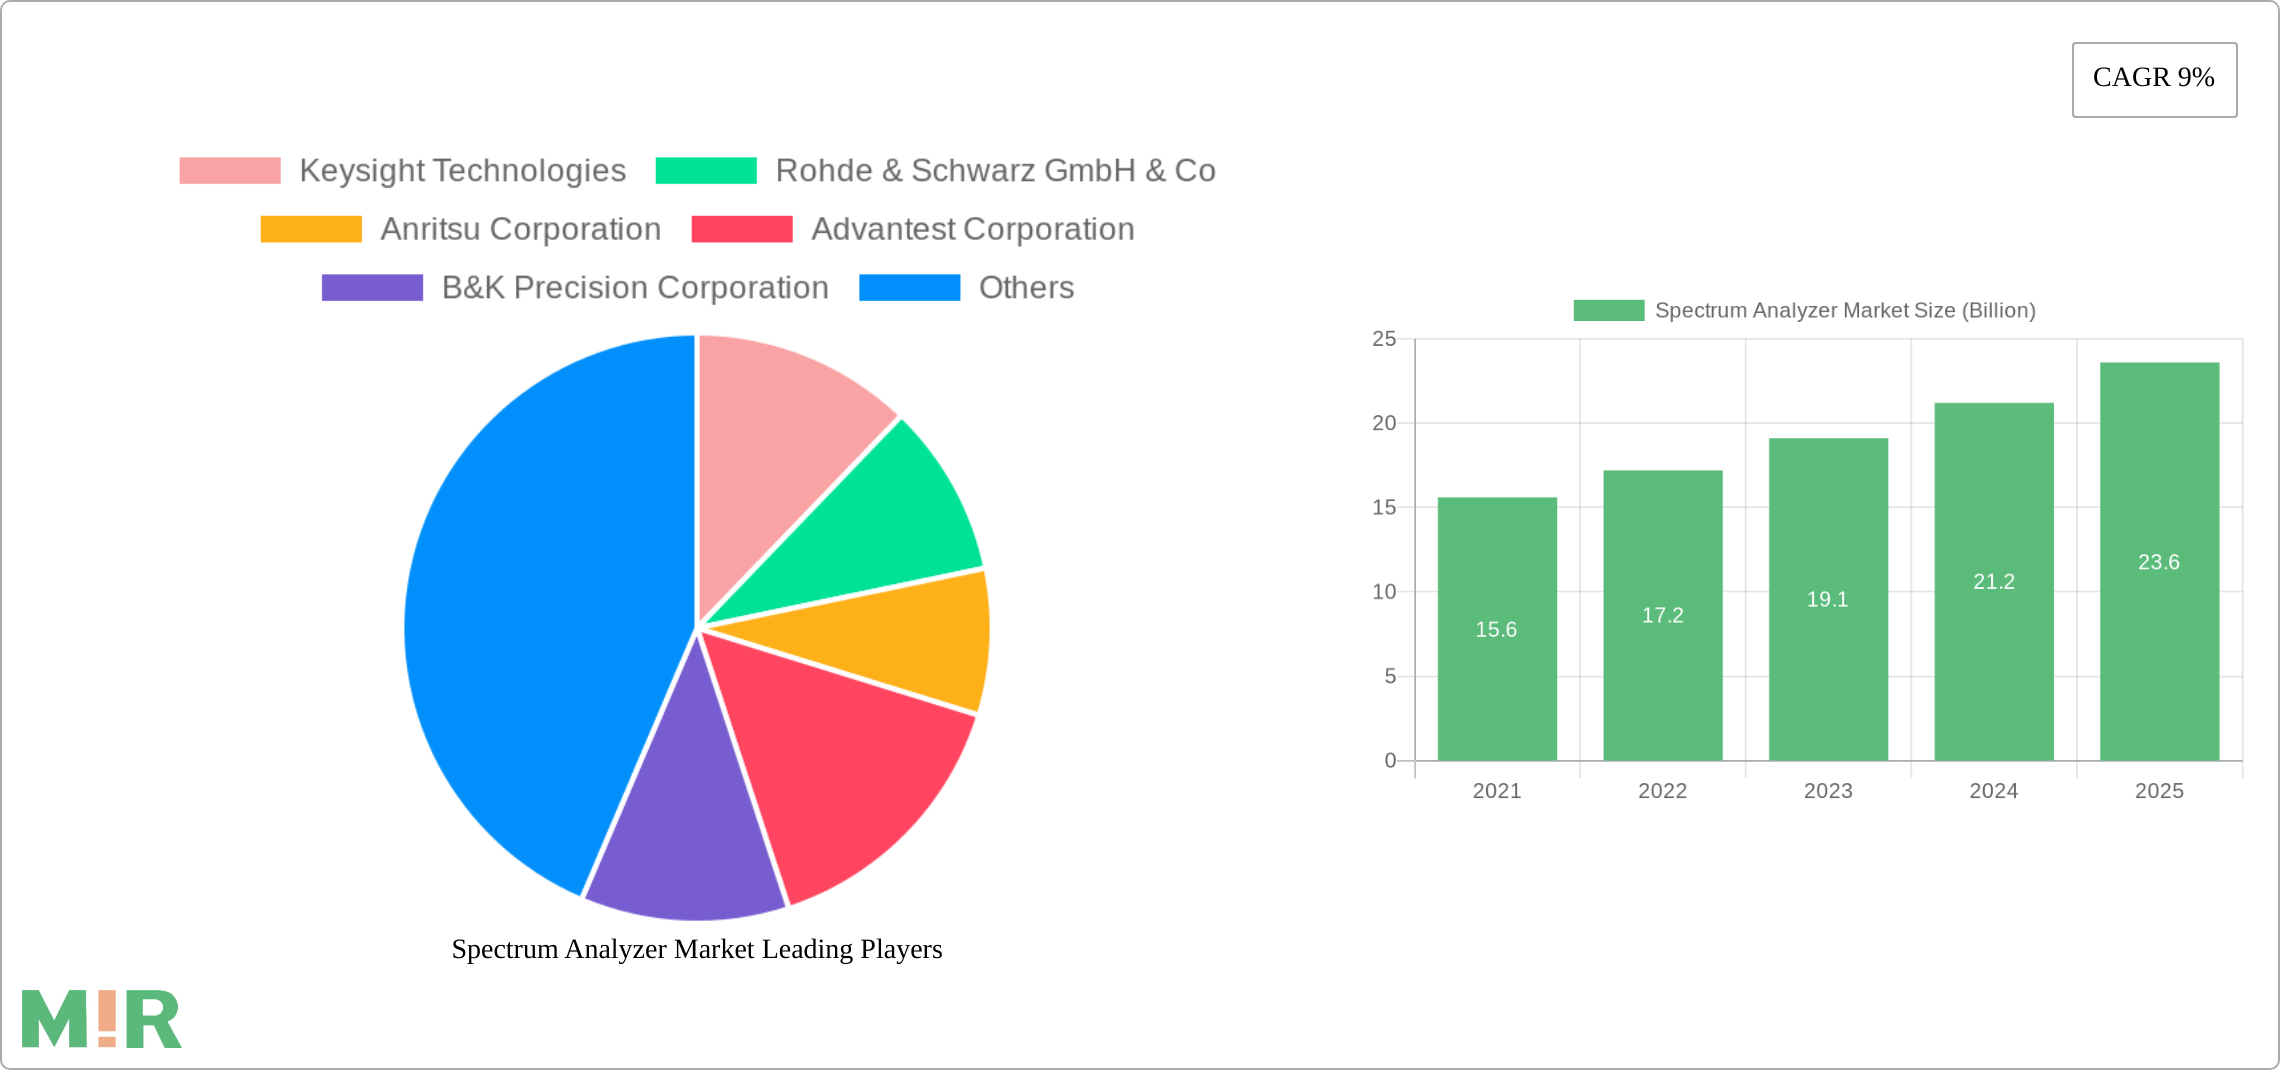
The projected CAGR is approximately 9%.

2. Which companies are prominent players in the Spectrum Analyzer Market?

Key companies in the market include Keysight Technologies, Rohde & Schwarz GmbH & Co, Anritsu Corporation, Advantest Corporation, B&K Precision Corporation, Giga-tronics Incorporated, National Instruments Corporation.

3. What are the main segments of the Spectrum Analyzer Market?

The market segments include Frequency Range, Form Factor, Network Technology, End User.

4. Can you provide details about the market size?

The market size is estimated to be USD 1.5 Billion as of 2022.

5. What are some drivers contributing to market growth?

Rising adoption of spectrum analyzers in testing and measurement. Technological advancements and innovation. Rapid expansion of electronic devices. Expansion of aerospace and defense sector. Rising adoption of spectrum analyzers in research and development.

6. What are the notable trends driving market growth?

Rising Demand for 5G and Beyond: The proliferation of 5G networks and the advent of technologies like 6G are driving the demand for spectrum analyzers. as these technologies require precise spectrum monitoring and analysis to ensure optimal performance and efficiency..

7. Are there any restraints impacting market growth?

Cost constraints. Technological complexity.

8. Can you provide examples of recent developments in the market?

In September 2023, Teledyne LeCroy launched its new WaveMaster 8000HD high-bandwidth, high-definition oscilloscope (HDO) platform with models from 20 to 65 GHz of bandwidth, 12 bits of resolution, up to 320 GS/s of sample rate and 8 gigapoints (Gpts) of acquisition memory.

9. What pricing options are available for accessing the report?

Pricing options include single-user, multi-user, and enterprise licenses priced at USD 4,850, USD 5,350, and USD 8,350 respectively.

10. Is the market size provided in terms of value or volume?

The market size is provided in terms of value, measured in Billion and volume, measured in units.

11. Are there any specific market keywords associated with the report?

Yes, the market keyword associated with the report is "Spectrum Analyzer Market," which aids in identifying and referencing the specific market segment covered.

12. How do I determine which pricing option suits my needs best?

The pricing options vary based on user requirements and access needs. Individual users may opt for single-user licenses, while businesses requiring broader access may choose multi-user or enterprise licenses for cost-effective access to the report.

13. Are there any additional resources or data provided in the Spectrum Analyzer Market report?

While the report offers comprehensive insights, it's advisable to review the specific contents or supplementary materials provided to ascertain if additional resources or data are available.

14. How can I stay updated on further developments or reports in the Spectrum Analyzer Market?

To stay informed about further developments, trends, and reports in the Spectrum Analyzer Market, consider subscribing to industry newsletters, following relevant companies and organizations, or regularly checking reputable industry news sources and publications.

Related Reports

See the similar reports

Discover the Latest Market Insight Reports

Access in-depth insights on industries, companies, trends, and global markets. Our expertly curated reports provide the most relevant data and analysis in a condensed, easy-to-read format.

shop image 1

About Market Insights Report

Market Insights Reports offers comprehensive market research reports and analysis, giving businesses important information about their clients, rivals, and sector to help them make well-informed decisions on operations, marketing, and business strategy. We offer a variety of services in addition to market research, data analysis, and strategy planning. In order to find opportunities and learn more about our competitors and the industry at large, we employ competitive analysis. To identify areas for development, we also evaluate our performance against that of our rivals. We can determine the places at which we can offer our clients the most value by performing value chain analysis.

Additionally, clients receive a thorough overview of their industry business environment. We can find trends that help us forecast future possibilities and threats by examining global macroeconomic dynamics and consumer behavior patterns. By analyzing their features and advantages, contrasting them with comparable items on the market, and evaluating both their quantitative and qualitative performance, we comprehensively evaluate our clients' products. This allows us to assist customers in determining how their goods compare to those of their rivals and in creating successful marketing plans. Our group has been successful in gaining a thorough grasp of our clients' requirements and offering them creative solutions. We currently provide services to more than 50 nations in Europe, the Middle East, Africa, Latin America, Asia Pacific, and North America. Because of our global reach, we have been able to establish trusting bonds with our partners and clients in various nations, improving customer service and forging a more cohesive worldwide presence.

We use cookies to enhance your experience.

By clicking "Accept All", you consent to the use of all cookies.

Customize your preferences or read our Cookie Policy.