Report banner
Public Cloud Market
Updated On

Feb 27 2025

Total Pages

400

Public Cloud Market Dynamics and Forecasts: 2025-2033 Strategic Insights

Public Cloud Market by Deployment Model (SaaS, IaaS, PaaS), by Organization Size (Large enterprise, SME), by Application (BFSI, Healthcare, Media and Entertainment, Retail & Consumer Goods, Automotive, IT & Telecom, Manufacturing, Government, Others), by North America (U.S., Canada), by Europe (UK, Germany, France, Italy, Netherlands, Switzerland), by Asia Pacific (China, India, Japan, South Korea, Australia, Singapore), by Latin America (Brazil, Mexico, Argentina), by Middle East & Africa (Saudi Arabia, UAE, South Africa) Forecast 2025-2033

Publisher Logo

Public Cloud Market Dynamics and Forecasts: 2025-2033 Strategic Insights


Key Insights

The Public Cloud Market, currently valued at $400 billion, is experiencing explosive growth, projected to maintain a Compound Annual Growth Rate (CAGR) of 10%. This expansion is fueled by several key factors. The increasing adoption of cloud-based solutions across diverse industries stems from the inherent advantages of scalability, cost-effectiveness, and enhanced agility. Businesses are increasingly migrating their IT infrastructure to the cloud to reduce capital expenditure on hardware and maintenance, focusing resources instead on core business functions. Government initiatives promoting digital transformation and cloud adoption further accelerate this shift. Technological advancements, including the development of advanced analytics, artificial intelligence (AI), and machine learning (ML) capabilities integrated into cloud platforms, provide businesses with powerful tools for data analysis and process optimization. Finally, the rising demand for secure and reliable data storage and processing further fuels the market's growth. The diverse applications of public cloud services across sectors, including BFSI, healthcare, and retail, solidify its position as a crucial component of modern business infrastructure. Major players like Amazon Web Services, Microsoft Azure, and Google Cloud Platform constantly innovate, expanding their services and fostering competition, driving further market expansion.

Public Cloud Market Research Report - Market Size, Growth & Forecast

Public Cloud Market Concentration & Characteristics

The public cloud market is highly concentrated, with a few dominant players, including Amazon Web Services (AWS), Microsoft Azure, and Google Cloud Platform (GCP), holding significant market share. This concentration, however, is coupled with substantial innovation. These leading players continuously introduce new services, features, and pricing models, driving competition and benefiting end users. Government regulations, particularly concerning data privacy and security (like GDPR and CCPA), significantly impact market dynamics. Companies must adapt to these regulations, increasing compliance costs and potentially slowing down market growth in certain sectors. Product substitutes, although limited in the core aspects of public cloud services, exist in the form of on-premises data centers and private clouds. However, the scalability and cost-effectiveness advantages of public cloud often outweigh these alternatives. End-user concentration is evident, with large enterprises accounting for a significant portion of the market due to their greater capacity for adopting and scaling cloud solutions. The level of mergers and acquisitions (M&A) activity in the public cloud market is high, with companies acquiring smaller players to expand their service offerings and market reach, further consolidating the market.

Public Cloud Market Trends

The public cloud market is characterized by a shift toward serverless computing, where users only pay for the computing resources they consume, eliminating the need to manage servers. This model contributes to higher efficiency and cost optimization. Artificial intelligence (AI) and machine learning (ML) are rapidly integrating with cloud platforms, providing enhanced analytical capabilities and automation opportunities for businesses. The growth of edge computing, which brings cloud capabilities closer to the data source, is also transforming the landscape, addressing latency challenges for applications requiring real-time processing. Security continues to be a critical concern, and the market is witnessing advancements in cloud security technologies, including enhanced encryption and access control mechanisms. The increasing importance of data privacy regulations is further propelling investment in robust security solutions. Sustainability is also gaining traction, with cloud providers focusing on energy-efficient data centers and carbon offsetting initiatives to lessen their environmental impact. Furthermore, the growing adoption of hybrid cloud models, combining public and private cloud environments, offers businesses a flexible and secure approach to leveraging cloud technology. Finally, the increasing demand for cloud-native applications specifically designed for cloud environments and the adoption of DevOps practices are streamlining development cycles and enhancing collaboration.

Public Cloud Market Growth

Key Region or Country & Segment to Dominate the Market

  • North America: The region currently dominates the public cloud market, driven by high technological adoption rates, the presence of major cloud providers, and significant investments in digital infrastructure. The US, in particular, is a key market driver.
  • Large Enterprises: This segment represents a significant portion of the market due to their capacity to invest in and utilize the advanced features and scalability offered by public cloud solutions. Their complex IT needs make public cloud a preferred choice over on-premise infrastructure.
  • IaaS (Infrastructure as a Service): This segment's dominance is attributed to the foundation it provides for other cloud services (PaaS and SaaS) and its flexibility in supporting diverse workloads and applications. Businesses benefit from renting computing resources (servers, storage, networking) on-demand.
  • BFSI (Banking, Financial Services, and Insurance): The BFSI sector is a significant adopter of public cloud technologies due to the need for robust security, high availability, and scalability for handling large volumes of financial data and transactions.

The rapid expansion of cloud services in North America, the strong demand from large enterprises, the underlying support provided by IaaS, and the high adoption rate within the BFSI sector all contribute to the dominant positioning of these segments in the public cloud market. Their combined influence is projected to sustain considerable growth in the years ahead.

Public Cloud Market Product Insights Report Coverage & Deliverables

This report provides a comprehensive overview of the public cloud market, including market size, growth projections, segment analysis, competitive landscape, and key trends. The deliverables include detailed market forecasts, in-depth analysis of major market segments, profiles of leading players, and identification of key growth opportunities.

Public Cloud Market Analysis

The public cloud market size is currently estimated at $400 billion, growing at a CAGR of 10%. Market share is concentrated among the top three providers—AWS, Microsoft Azure, and Google Cloud—with the remaining share distributed amongst other significant players such as Salesforce, Alibaba, and others. The growth is driven by increased digital transformation initiatives, the cost-effectiveness of cloud solutions, and the enhanced scalability and agility they offer. The market exhibits diverse segments based on deployment models (SaaS, IaaS, PaaS), organization size (large enterprises, SMEs), and industry verticals (BFSI, healthcare, retail, etc.). Analysis of these segments reveals varied growth rates based on factors like industry-specific requirements and the readiness to adopt cloud technologies. Market analysis also involves assessing the competitive landscape, including strategic alliances, partnerships, and mergers & acquisitions that shape market dynamics.

Public Cloud Market Regional Insights

  • North America:
    • U.S.
    • Canada
  • Europe:
    • UK
    • Germany
    • France
    • Italy
    • Netherlands
    • Switzerland
  • Asia Pacific:
    • China
    • India
    • Japan
    • South Korea
    • Australia
    • Singapore
  • Latin America:
    • Brazil
    • Mexico
    • Argentina
  • Middle East & Africa:
    • Saudi Arabia
    • UAE
    • South Africa

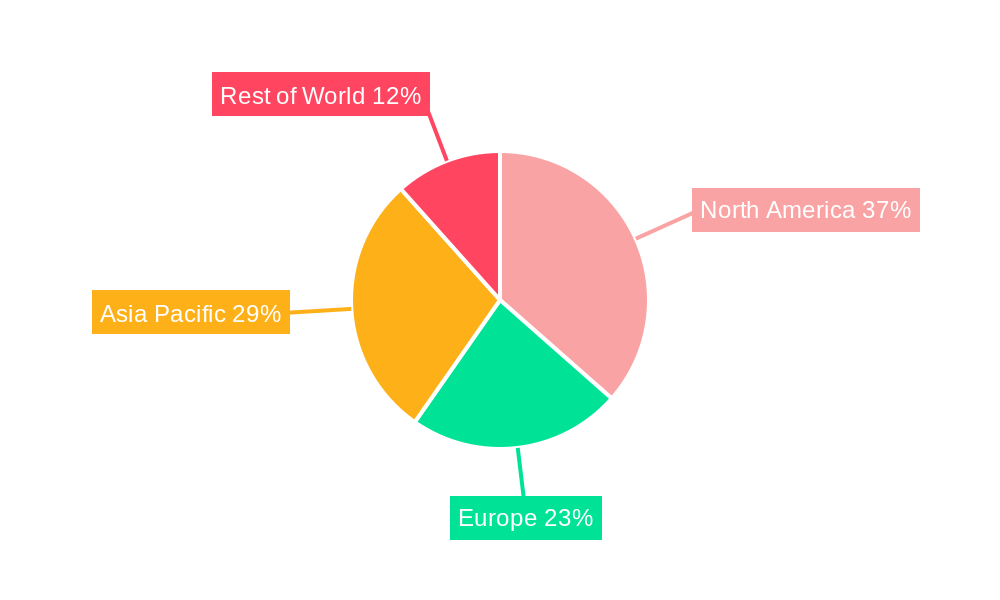
Each region exhibits unique characteristics in terms of cloud adoption rates, regulatory frameworks, and technological advancements. North America currently holds the largest market share, followed by Europe and Asia Pacific.

Driving Forces: What's Propelling the Public Cloud Market

  • Increased digital transformation initiatives by businesses.
  • Cost-effectiveness and scalability of cloud solutions.
  • Enhanced agility and flexibility offered by cloud platforms.
  • Growing demand for data storage and processing capabilities.
  • Government initiatives promoting cloud adoption.
  • Technological advancements in AI, ML, and serverless computing.

Challenges and Restraints in Public Cloud Market

  • Data security and privacy concerns.
  • Vendor lock-in and dependence on cloud providers.
  • Integration complexities and challenges.
  • Lack of skilled workforce in cloud technologies.
  • Regulatory compliance requirements.

Emerging Trends in Public Cloud Market

  • Serverless computing and microservices architecture.
  • Edge computing and IoT integration.
  • AI and ML-powered cloud services.
  • Hybrid and multi-cloud deployments.
  • Focus on cloud security and data privacy.
  • Sustainable cloud computing practices.

Public Cloud Industry News

(This section would require current news updates at the time of report generation. Examples of news items could include new product launches by major cloud providers, significant partnerships or acquisitions, regulatory changes impacting the industry, and significant market reports.)

Leading Players in the Public Cloud Market

Public Cloud Market Segmentation

  • 1. Deployment Model
    • 1.1. SaaS
    • 1.2. IaaS
    • 1.3. PaaS
  • 2. Organization Size
    • 2.1. Large enterprise
    • 2.2. SME
  • 3. Application
    • 3.1. BFSI
    • 3.2. Healthcare
    • 3.3. Media and Entertainment
    • 3.4. Retail & Consumer Goods
    • 3.5. Automotive
    • 3.6. IT & Telecom
    • 3.7. Manufacturing
    • 3.8. Government
    • 3.9. Others

Public Cloud Market Segmentation By Geography

  • 1. North America
    • 1.1. U.S.
    • 1.2. Canada
  • 2. Europe
    • 2.1. UK
    • 2.2. Germany
    • 2.3. France
    • 2.4. Italy
    • 2.5. Netherlands
    • 2.6. Switzerland
  • 3. Asia Pacific
    • 3.1. China
    • 3.2. India
    • 3.3. Japan
    • 3.4. South Korea
    • 3.5. Australia
    • 3.6. Singapore
  • 4. Latin America
    • 4.1. Brazil
    • 4.2. Mexico
    • 4.3. Argentina
  • 5. Middle East & Africa
    • 5.1. Saudi Arabia
    • 5.2. UAE
    • 5.3. South Africa

Public Cloud Market Regional Share


Public Cloud Market REPORT HIGHLIGHTS

AspectsDetails
Study Period 2019-2033
Base Year 2024
Estimated Year 2025
Forecast Period2025-2033
Historical Period2019-2024
Growth RateCAGR of 10% from 2019-2033
Segmentation
    • By Deployment Model
      • SaaS
      • IaaS
      • PaaS
    • By Organization Size
      • Large enterprise
      • SME
    • By Application
      • BFSI
      • Healthcare
      • Media and Entertainment
      • Retail & Consumer Goods
      • Automotive
      • IT & Telecom
      • Manufacturing
      • Government
      • Others
  • By Geography
    • North America
      • U.S.
      • Canada
    • Europe
      • UK
      • Germany
      • France
      • Italy
      • Netherlands
      • Switzerland
    • Asia Pacific
      • China
      • India
      • Japan
      • South Korea
      • Australia
      • Singapore
    • Latin America
      • Brazil
      • Mexico
      • Argentina
    • Middle East & Africa
      • Saudi Arabia
      • UAE
      • South Africa


Table of Contents

  1. 1. Introduction
    • 1.1. Research Scope
    • 1.2. Market Segmentation
    • 1.3. Research Methodology
    • 1.4. Definitions and Assumptions
  2. 2. Executive Summary
    • 2.1. Introduction
  3. 3. Market Dynamics
    • 3.1. Introduction
      • 3.2. Market Drivers
        • 3.2.1 Increasing Integration of big data
        • 3.2.2 AI
        • 3.2.3 and ML with cloud
        • 3.2.4 Increasing public cloud spending
        • 3.2.5 Growing adoption of cloud computing solutions in developing countries
        • 3.2.6 Rising deployment of IaaS and PaaS in SME
        • 3.2.7 Cost-effective and scalable
      • 3.3. Market Restrains
        • 3.3.1 Data privacy and information security concerns
        • 3.3.2 Cloud Wastage
      • 3.4. Market Trends
  4. 4. Market Factor Analysis
    • 4.1. Porters Five Forces
    • 4.2. Supply/Value Chain
    • 4.3. PESTEL analysis
    • 4.4. Market Entropy
    • 4.5. Patent/Trademark Analysis
  5. 5. Global Public Cloud Market Analysis, Insights and Forecast, 2019-2031
    • 5.1. Market Analysis, Insights and Forecast - by Deployment Model
      • 5.1.1. SaaS
      • 5.1.2. IaaS
      • 5.1.3. PaaS
    • 5.2. Market Analysis, Insights and Forecast - by Organization Size
      • 5.2.1. Large enterprise
      • 5.2.2. SME
    • 5.3. Market Analysis, Insights and Forecast - by Application
      • 5.3.1. BFSI
      • 5.3.2. Healthcare
      • 5.3.3. Media and Entertainment
      • 5.3.4. Retail & Consumer Goods
      • 5.3.5. Automotive
      • 5.3.6. IT & Telecom
      • 5.3.7. Manufacturing
      • 5.3.8. Government
      • 5.3.9. Others
    • 5.4. Market Analysis, Insights and Forecast - by Region
      • 5.4.1. North America
      • 5.4.2. Europe
      • 5.4.3. Asia Pacific
      • 5.4.4. Latin America
      • 5.4.5. Middle East & Africa
  6. 6. North America Public Cloud Market Analysis, Insights and Forecast, 2019-2031
    • 6.1. Market Analysis, Insights and Forecast - by Deployment Model
      • 6.1.1. SaaS
      • 6.1.2. IaaS
      • 6.1.3. PaaS
    • 6.2. Market Analysis, Insights and Forecast - by Organization Size
      • 6.2.1. Large enterprise
      • 6.2.2. SME
    • 6.3. Market Analysis, Insights and Forecast - by Application
      • 6.3.1. BFSI
      • 6.3.2. Healthcare
      • 6.3.3. Media and Entertainment
      • 6.3.4. Retail & Consumer Goods
      • 6.3.5. Automotive
      • 6.3.6. IT & Telecom
      • 6.3.7. Manufacturing
      • 6.3.8. Government
      • 6.3.9. Others
  7. 7. Europe Public Cloud Market Analysis, Insights and Forecast, 2019-2031
    • 7.1. Market Analysis, Insights and Forecast - by Deployment Model
      • 7.1.1. SaaS
      • 7.1.2. IaaS
      • 7.1.3. PaaS
    • 7.2. Market Analysis, Insights and Forecast - by Organization Size
      • 7.2.1. Large enterprise
      • 7.2.2. SME
    • 7.3. Market Analysis, Insights and Forecast - by Application
      • 7.3.1. BFSI
      • 7.3.2. Healthcare
      • 7.3.3. Media and Entertainment
      • 7.3.4. Retail & Consumer Goods
      • 7.3.5. Automotive
      • 7.3.6. IT & Telecom
      • 7.3.7. Manufacturing
      • 7.3.8. Government
      • 7.3.9. Others
  8. 8. Asia Pacific Public Cloud Market Analysis, Insights and Forecast, 2019-2031
    • 8.1. Market Analysis, Insights and Forecast - by Deployment Model
      • 8.1.1. SaaS
      • 8.1.2. IaaS
      • 8.1.3. PaaS
    • 8.2. Market Analysis, Insights and Forecast - by Organization Size
      • 8.2.1. Large enterprise
      • 8.2.2. SME
    • 8.3. Market Analysis, Insights and Forecast - by Application
      • 8.3.1. BFSI
      • 8.3.2. Healthcare
      • 8.3.3. Media and Entertainment
      • 8.3.4. Retail & Consumer Goods
      • 8.3.5. Automotive
      • 8.3.6. IT & Telecom
      • 8.3.7. Manufacturing
      • 8.3.8. Government
      • 8.3.9. Others
  9. 9. Latin America Public Cloud Market Analysis, Insights and Forecast, 2019-2031
    • 9.1. Market Analysis, Insights and Forecast - by Deployment Model
      • 9.1.1. SaaS
      • 9.1.2. IaaS
      • 9.1.3. PaaS
    • 9.2. Market Analysis, Insights and Forecast - by Organization Size
      • 9.2.1. Large enterprise
      • 9.2.2. SME
    • 9.3. Market Analysis, Insights and Forecast - by Application
      • 9.3.1. BFSI
      • 9.3.2. Healthcare
      • 9.3.3. Media and Entertainment
      • 9.3.4. Retail & Consumer Goods
      • 9.3.5. Automotive
      • 9.3.6. IT & Telecom
      • 9.3.7. Manufacturing
      • 9.3.8. Government
      • 9.3.9. Others
  10. 10. Middle East & Africa Public Cloud Market Analysis, Insights and Forecast, 2019-2031
    • 10.1. Market Analysis, Insights and Forecast - by Deployment Model
      • 10.1.1. SaaS
      • 10.1.2. IaaS
      • 10.1.3. PaaS
    • 10.2. Market Analysis, Insights and Forecast - by Organization Size
      • 10.2.1. Large enterprise
      • 10.2.2. SME
    • 10.3. Market Analysis, Insights and Forecast - by Application
      • 10.3.1. BFSI
      • 10.3.2. Healthcare
      • 10.3.3. Media and Entertainment
      • 10.3.4. Retail & Consumer Goods
      • 10.3.5. Automotive
      • 10.3.6. IT & Telecom
      • 10.3.7. Manufacturing
      • 10.3.8. Government
      • 10.3.9. Others
  11. 11. Competitive Analysis
    • 11.1. Global Market Share Analysis 2024
      • 11.2. Company Profiles
        • 11.2.1 Microsoft Corporation
          • 11.2.1.1. Overview
          • 11.2.1.2. Products
          • 11.2.1.3. SWOT Analysis
          • 11.2.1.4. Recent Developments
          • 11.2.1.5. Financials (Based on Availability)
        • 11.2.2 Amazon Web Services Inc.
          • 11.2.2.1. Overview
          • 11.2.2.2. Products
          • 11.2.2.3. SWOT Analysis
          • 11.2.2.4. Recent Developments
          • 11.2.2.5. Financials (Based on Availability)
        • 11.2.3 Google LLC.
          • 11.2.3.1. Overview
          • 11.2.3.2. Products
          • 11.2.3.3. SWOT Analysis
          • 11.2.3.4. Recent Developments
          • 11.2.3.5. Financials (Based on Availability)
        • 11.2.4 Salesforce Inc.
          • 11.2.4.1. Overview
          • 11.2.4.2. Products
          • 11.2.4.3. SWOT Analysis
          • 11.2.4.4. Recent Developments
          • 11.2.4.5. Financials (Based on Availability)
        • 11.2.5 Alibaba Group Holding Limited
          • 11.2.5.1. Overview
          • 11.2.5.2. Products
          • 11.2.5.3. SWOT Analysis
          • 11.2.5.4. Recent Developments
          • 11.2.5.5. Financials (Based on Availability)
        • 11.2.6 SAP SE
          • 11.2.6.1. Overview
          • 11.2.6.2. Products
          • 11.2.6.3. SWOT Analysis
          • 11.2.6.4. Recent Developments
          • 11.2.6.5. Financials (Based on Availability)
        • 11.2.7 Oracle Corporation
          • 11.2.7.1. Overview
          • 11.2.7.2. Products
          • 11.2.7.3. SWOT Analysis
          • 11.2.7.4. Recent Developments
          • 11.2.7.5. Financials (Based on Availability)
        • 11.2.8 IBM Corporation
          • 11.2.8.1. Overview
          • 11.2.8.2. Products
          • 11.2.8.3. SWOT Analysis
          • 11.2.8.4. Recent Developments
          • 11.2.8.5. Financials (Based on Availability)
        • 11.2.9 Tencent Cloud
          • 11.2.9.1. Overview
          • 11.2.9.2. Products
          • 11.2.9.3. SWOT Analysis
          • 11.2.9.4. Recent Developments
          • 11.2.9.5. Financials (Based on Availability)
        • 11.2.10 Nutanix
          • 11.2.10.1. Overview
          • 11.2.10.2. Products
          • 11.2.10.3. SWOT Analysis
          • 11.2.10.4. Recent Developments
          • 11.2.10.5. Financials (Based on Availability)
        • 11.2.11 OVH SAS
          • 11.2.11.1. Overview
          • 11.2.11.2. Products
          • 11.2.11.3. SWOT Analysis
          • 11.2.11.4. Recent Developments
          • 11.2.11.5. Financials (Based on Availability)
        • 11.2.12 VMware Inc.
          • 11.2.12.1. Overview
          • 11.2.12.2. Products
          • 11.2.12.3. SWOT Analysis
          • 11.2.12.4. Recent Developments
          • 11.2.12.5. Financials (Based on Availability)
        • 11.2.13 Kamatera Inc.
          • 11.2.13.1. Overview
          • 11.2.13.2. Products
          • 11.2.13.3. SWOT Analysis
          • 11.2.13.4. Recent Developments
          • 11.2.13.5. Financials (Based on Availability)
        • 11.2.14 DigitalOcean LLC.
          • 11.2.14.1. Overview
          • 11.2.14.2. Products
          • 11.2.14.3. SWOT Analysis
          • 11.2.14.4. Recent Developments
          • 11.2.14.5. Financials (Based on Availability)
        • 11.2.15 Rackspace Technology
          • 11.2.15.1. Overview
          • 11.2.15.2. Products
          • 11.2.15.3. SWOT Analysis
          • 11.2.15.4. Recent Developments
          • 11.2.15.5. Financials (Based on Availability)

List of Figures

  1. Figure 1: Global Public Cloud Market Revenue Breakdown (Billion, %) by Region 2024 & 2032
  2. Figure 2: Global Public Cloud Market Volume Breakdown (K Units, %) by Region 2024 & 2032
  3. Figure 3: North America Public Cloud Market Revenue (Billion), by Deployment Model 2024 & 2032
  4. Figure 4: North America Public Cloud Market Volume (K Units), by Deployment Model 2024 & 2032
  5. Figure 5: North America Public Cloud Market Revenue Share (%), by Deployment Model 2024 & 2032
  6. Figure 6: North America Public Cloud Market Volume Share (%), by Deployment Model 2024 & 2032
  7. Figure 7: North America Public Cloud Market Revenue (Billion), by Organization Size 2024 & 2032
  8. Figure 8: North America Public Cloud Market Volume (K Units), by Organization Size 2024 & 2032
  9. Figure 9: North America Public Cloud Market Revenue Share (%), by Organization Size 2024 & 2032
  10. Figure 10: North America Public Cloud Market Volume Share (%), by Organization Size 2024 & 2032
  11. Figure 11: North America Public Cloud Market Revenue (Billion), by Application 2024 & 2032
  12. Figure 12: North America Public Cloud Market Volume (K Units), by Application 2024 & 2032
  13. Figure 13: North America Public Cloud Market Revenue Share (%), by Application 2024 & 2032
  14. Figure 14: North America Public Cloud Market Volume Share (%), by Application 2024 & 2032
  15. Figure 15: North America Public Cloud Market Revenue (Billion), by Country 2024 & 2032
  16. Figure 16: North America Public Cloud Market Volume (K Units), by Country 2024 & 2032
  17. Figure 17: North America Public Cloud Market Revenue Share (%), by Country 2024 & 2032
  18. Figure 18: North America Public Cloud Market Volume Share (%), by Country 2024 & 2032
  19. Figure 19: Europe Public Cloud Market Revenue (Billion), by Deployment Model 2024 & 2032
  20. Figure 20: Europe Public Cloud Market Volume (K Units), by Deployment Model 2024 & 2032
  21. Figure 21: Europe Public Cloud Market Revenue Share (%), by Deployment Model 2024 & 2032
  22. Figure 22: Europe Public Cloud Market Volume Share (%), by Deployment Model 2024 & 2032
  23. Figure 23: Europe Public Cloud Market Revenue (Billion), by Organization Size 2024 & 2032
  24. Figure 24: Europe Public Cloud Market Volume (K Units), by Organization Size 2024 & 2032
  25. Figure 25: Europe Public Cloud Market Revenue Share (%), by Organization Size 2024 & 2032
  26. Figure 26: Europe Public Cloud Market Volume Share (%), by Organization Size 2024 & 2032
  27. Figure 27: Europe Public Cloud Market Revenue (Billion), by Application 2024 & 2032
  28. Figure 28: Europe Public Cloud Market Volume (K Units), by Application 2024 & 2032
  29. Figure 29: Europe Public Cloud Market Revenue Share (%), by Application 2024 & 2032
  30. Figure 30: Europe Public Cloud Market Volume Share (%), by Application 2024 & 2032
  31. Figure 31: Europe Public Cloud Market Revenue (Billion), by Country 2024 & 2032
  32. Figure 32: Europe Public Cloud Market Volume (K Units), by Country 2024 & 2032
  33. Figure 33: Europe Public Cloud Market Revenue Share (%), by Country 2024 & 2032
  34. Figure 34: Europe Public Cloud Market Volume Share (%), by Country 2024 & 2032
  35. Figure 35: Asia Pacific Public Cloud Market Revenue (Billion), by Deployment Model 2024 & 2032
  36. Figure 36: Asia Pacific Public Cloud Market Volume (K Units), by Deployment Model 2024 & 2032
  37. Figure 37: Asia Pacific Public Cloud Market Revenue Share (%), by Deployment Model 2024 & 2032
  38. Figure 38: Asia Pacific Public Cloud Market Volume Share (%), by Deployment Model 2024 & 2032
  39. Figure 39: Asia Pacific Public Cloud Market Revenue (Billion), by Organization Size 2024 & 2032
  40. Figure 40: Asia Pacific Public Cloud Market Volume (K Units), by Organization Size 2024 & 2032
  41. Figure 41: Asia Pacific Public Cloud Market Revenue Share (%), by Organization Size 2024 & 2032
  42. Figure 42: Asia Pacific Public Cloud Market Volume Share (%), by Organization Size 2024 & 2032
  43. Figure 43: Asia Pacific Public Cloud Market Revenue (Billion), by Application 2024 & 2032
  44. Figure 44: Asia Pacific Public Cloud Market Volume (K Units), by Application 2024 & 2032
  45. Figure 45: Asia Pacific Public Cloud Market Revenue Share (%), by Application 2024 & 2032
  46. Figure 46: Asia Pacific Public Cloud Market Volume Share (%), by Application 2024 & 2032
  47. Figure 47: Asia Pacific Public Cloud Market Revenue (Billion), by Country 2024 & 2032
  48. Figure 48: Asia Pacific Public Cloud Market Volume (K Units), by Country 2024 & 2032
  49. Figure 49: Asia Pacific Public Cloud Market Revenue Share (%), by Country 2024 & 2032
  50. Figure 50: Asia Pacific Public Cloud Market Volume Share (%), by Country 2024 & 2032
  51. Figure 51: Latin America Public Cloud Market Revenue (Billion), by Deployment Model 2024 & 2032
  52. Figure 52: Latin America Public Cloud Market Volume (K Units), by Deployment Model 2024 & 2032
  53. Figure 53: Latin America Public Cloud Market Revenue Share (%), by Deployment Model 2024 & 2032
  54. Figure 54: Latin America Public Cloud Market Volume Share (%), by Deployment Model 2024 & 2032
  55. Figure 55: Latin America Public Cloud Market Revenue (Billion), by Organization Size 2024 & 2032
  56. Figure 56: Latin America Public Cloud Market Volume (K Units), by Organization Size 2024 & 2032
  57. Figure 57: Latin America Public Cloud Market Revenue Share (%), by Organization Size 2024 & 2032
  58. Figure 58: Latin America Public Cloud Market Volume Share (%), by Organization Size 2024 & 2032
  59. Figure 59: Latin America Public Cloud Market Revenue (Billion), by Application 2024 & 2032
  60. Figure 60: Latin America Public Cloud Market Volume (K Units), by Application 2024 & 2032
  61. Figure 61: Latin America Public Cloud Market Revenue Share (%), by Application 2024 & 2032
  62. Figure 62: Latin America Public Cloud Market Volume Share (%), by Application 2024 & 2032
  63. Figure 63: Latin America Public Cloud Market Revenue (Billion), by Country 2024 & 2032
  64. Figure 64: Latin America Public Cloud Market Volume (K Units), by Country 2024 & 2032
  65. Figure 65: Latin America Public Cloud Market Revenue Share (%), by Country 2024 & 2032
  66. Figure 66: Latin America Public Cloud Market Volume Share (%), by Country 2024 & 2032
  67. Figure 67: Middle East & Africa Public Cloud Market Revenue (Billion), by Deployment Model 2024 & 2032
  68. Figure 68: Middle East & Africa Public Cloud Market Volume (K Units), by Deployment Model 2024 & 2032
  69. Figure 69: Middle East & Africa Public Cloud Market Revenue Share (%), by Deployment Model 2024 & 2032
  70. Figure 70: Middle East & Africa Public Cloud Market Volume Share (%), by Deployment Model 2024 & 2032
  71. Figure 71: Middle East & Africa Public Cloud Market Revenue (Billion), by Organization Size 2024 & 2032
  72. Figure 72: Middle East & Africa Public Cloud Market Volume (K Units), by Organization Size 2024 & 2032
  73. Figure 73: Middle East & Africa Public Cloud Market Revenue Share (%), by Organization Size 2024 & 2032
  74. Figure 74: Middle East & Africa Public Cloud Market Volume Share (%), by Organization Size 2024 & 2032
  75. Figure 75: Middle East & Africa Public Cloud Market Revenue (Billion), by Application 2024 & 2032
  76. Figure 76: Middle East & Africa Public Cloud Market Volume (K Units), by Application 2024 & 2032
  77. Figure 77: Middle East & Africa Public Cloud Market Revenue Share (%), by Application 2024 & 2032
  78. Figure 78: Middle East & Africa Public Cloud Market Volume Share (%), by Application 2024 & 2032
  79. Figure 79: Middle East & Africa Public Cloud Market Revenue (Billion), by Country 2024 & 2032
  80. Figure 80: Middle East & Africa Public Cloud Market Volume (K Units), by Country 2024 & 2032
  81. Figure 81: Middle East & Africa Public Cloud Market Revenue Share (%), by Country 2024 & 2032
  82. Figure 82: Middle East & Africa Public Cloud Market Volume Share (%), by Country 2024 & 2032

List of Tables

  1. Table 1: Global Public Cloud Market Revenue Billion Forecast, by Region 2019 & 2032
  2. Table 2: Global Public Cloud Market Volume K Units Forecast, by Region 2019 & 2032
  3. Table 3: Global Public Cloud Market Revenue Billion Forecast, by Deployment Model 2019 & 2032
  4. Table 4: Global Public Cloud Market Volume K Units Forecast, by Deployment Model 2019 & 2032
  5. Table 5: Global Public Cloud Market Revenue Billion Forecast, by Organization Size 2019 & 2032
  6. Table 6: Global Public Cloud Market Volume K Units Forecast, by Organization Size 2019 & 2032
  7. Table 7: Global Public Cloud Market Revenue Billion Forecast, by Application 2019 & 2032
  8. Table 8: Global Public Cloud Market Volume K Units Forecast, by Application 2019 & 2032
  9. Table 9: Global Public Cloud Market Revenue Billion Forecast, by Region 2019 & 2032
  10. Table 10: Global Public Cloud Market Volume K Units Forecast, by Region 2019 & 2032
  11. Table 11: Global Public Cloud Market Revenue Billion Forecast, by Deployment Model 2019 & 2032
  12. Table 12: Global Public Cloud Market Volume K Units Forecast, by Deployment Model 2019 & 2032
  13. Table 13: Global Public Cloud Market Revenue Billion Forecast, by Organization Size 2019 & 2032
  14. Table 14: Global Public Cloud Market Volume K Units Forecast, by Organization Size 2019 & 2032
  15. Table 15: Global Public Cloud Market Revenue Billion Forecast, by Application 2019 & 2032
  16. Table 16: Global Public Cloud Market Volume K Units Forecast, by Application 2019 & 2032
  17. Table 17: Global Public Cloud Market Revenue Billion Forecast, by Country 2019 & 2032
  18. Table 18: Global Public Cloud Market Volume K Units Forecast, by Country 2019 & 2032
  19. Table 19: U.S. Public Cloud Market Revenue (Billion) Forecast, by Application 2019 & 2032
  20. Table 20: U.S. Public Cloud Market Volume (K Units) Forecast, by Application 2019 & 2032
  21. Table 21: Canada Public Cloud Market Revenue (Billion) Forecast, by Application 2019 & 2032
  22. Table 22: Canada Public Cloud Market Volume (K Units) Forecast, by Application 2019 & 2032
  23. Table 23: Global Public Cloud Market Revenue Billion Forecast, by Deployment Model 2019 & 2032
  24. Table 24: Global Public Cloud Market Volume K Units Forecast, by Deployment Model 2019 & 2032
  25. Table 25: Global Public Cloud Market Revenue Billion Forecast, by Organization Size 2019 & 2032
  26. Table 26: Global Public Cloud Market Volume K Units Forecast, by Organization Size 2019 & 2032
  27. Table 27: Global Public Cloud Market Revenue Billion Forecast, by Application 2019 & 2032
  28. Table 28: Global Public Cloud Market Volume K Units Forecast, by Application 2019 & 2032
  29. Table 29: Global Public Cloud Market Revenue Billion Forecast, by Country 2019 & 2032
  30. Table 30: Global Public Cloud Market Volume K Units Forecast, by Country 2019 & 2032
  31. Table 31: UK Public Cloud Market Revenue (Billion) Forecast, by Application 2019 & 2032
  32. Table 32: UK Public Cloud Market Volume (K Units) Forecast, by Application 2019 & 2032
  33. Table 33: Germany Public Cloud Market Revenue (Billion) Forecast, by Application 2019 & 2032
  34. Table 34: Germany Public Cloud Market Volume (K Units) Forecast, by Application 2019 & 2032
  35. Table 35: France Public Cloud Market Revenue (Billion) Forecast, by Application 2019 & 2032
  36. Table 36: France Public Cloud Market Volume (K Units) Forecast, by Application 2019 & 2032
  37. Table 37: Italy Public Cloud Market Revenue (Billion) Forecast, by Application 2019 & 2032
  38. Table 38: Italy Public Cloud Market Volume (K Units) Forecast, by Application 2019 & 2032
  39. Table 39: Netherlands Public Cloud Market Revenue (Billion) Forecast, by Application 2019 & 2032
  40. Table 40: Netherlands Public Cloud Market Volume (K Units) Forecast, by Application 2019 & 2032
  41. Table 41: Switzerland Public Cloud Market Revenue (Billion) Forecast, by Application 2019 & 2032
  42. Table 42: Switzerland Public Cloud Market Volume (K Units) Forecast, by Application 2019 & 2032
  43. Table 43: Global Public Cloud Market Revenue Billion Forecast, by Deployment Model 2019 & 2032
  44. Table 44: Global Public Cloud Market Volume K Units Forecast, by Deployment Model 2019 & 2032
  45. Table 45: Global Public Cloud Market Revenue Billion Forecast, by Organization Size 2019 & 2032
  46. Table 46: Global Public Cloud Market Volume K Units Forecast, by Organization Size 2019 & 2032
  47. Table 47: Global Public Cloud Market Revenue Billion Forecast, by Application 2019 & 2032
  48. Table 48: Global Public Cloud Market Volume K Units Forecast, by Application 2019 & 2032
  49. Table 49: Global Public Cloud Market Revenue Billion Forecast, by Country 2019 & 2032
  50. Table 50: Global Public Cloud Market Volume K Units Forecast, by Country 2019 & 2032
  51. Table 51: China Public Cloud Market Revenue (Billion) Forecast, by Application 2019 & 2032
  52. Table 52: China Public Cloud Market Volume (K Units) Forecast, by Application 2019 & 2032
  53. Table 53: India Public Cloud Market Revenue (Billion) Forecast, by Application 2019 & 2032
  54. Table 54: India Public Cloud Market Volume (K Units) Forecast, by Application 2019 & 2032
  55. Table 55: Japan Public Cloud Market Revenue (Billion) Forecast, by Application 2019 & 2032
  56. Table 56: Japan Public Cloud Market Volume (K Units) Forecast, by Application 2019 & 2032
  57. Table 57: South Korea Public Cloud Market Revenue (Billion) Forecast, by Application 2019 & 2032
  58. Table 58: South Korea Public Cloud Market Volume (K Units) Forecast, by Application 2019 & 2032
  59. Table 59: Australia Public Cloud Market Revenue (Billion) Forecast, by Application 2019 & 2032
  60. Table 60: Australia Public Cloud Market Volume (K Units) Forecast, by Application 2019 & 2032
  61. Table 61: Singapore Public Cloud Market Revenue (Billion) Forecast, by Application 2019 & 2032
  62. Table 62: Singapore Public Cloud Market Volume (K Units) Forecast, by Application 2019 & 2032
  63. Table 63: Global Public Cloud Market Revenue Billion Forecast, by Deployment Model 2019 & 2032
  64. Table 64: Global Public Cloud Market Volume K Units Forecast, by Deployment Model 2019 & 2032
  65. Table 65: Global Public Cloud Market Revenue Billion Forecast, by Organization Size 2019 & 2032
  66. Table 66: Global Public Cloud Market Volume K Units Forecast, by Organization Size 2019 & 2032
  67. Table 67: Global Public Cloud Market Revenue Billion Forecast, by Application 2019 & 2032
  68. Table 68: Global Public Cloud Market Volume K Units Forecast, by Application 2019 & 2032
  69. Table 69: Global Public Cloud Market Revenue Billion Forecast, by Country 2019 & 2032
  70. Table 70: Global Public Cloud Market Volume K Units Forecast, by Country 2019 & 2032
  71. Table 71: Brazil Public Cloud Market Revenue (Billion) Forecast, by Application 2019 & 2032
  72. Table 72: Brazil Public Cloud Market Volume (K Units) Forecast, by Application 2019 & 2032
  73. Table 73: Mexico Public Cloud Market Revenue (Billion) Forecast, by Application 2019 & 2032
  74. Table 74: Mexico Public Cloud Market Volume (K Units) Forecast, by Application 2019 & 2032
  75. Table 75: Argentina Public Cloud Market Revenue (Billion) Forecast, by Application 2019 & 2032
  76. Table 76: Argentina Public Cloud Market Volume (K Units) Forecast, by Application 2019 & 2032
  77. Table 77: Global Public Cloud Market Revenue Billion Forecast, by Deployment Model 2019 & 2032
  78. Table 78: Global Public Cloud Market Volume K Units Forecast, by Deployment Model 2019 & 2032
  79. Table 79: Global Public Cloud Market Revenue Billion Forecast, by Organization Size 2019 & 2032
  80. Table 80: Global Public Cloud Market Volume K Units Forecast, by Organization Size 2019 & 2032
  81. Table 81: Global Public Cloud Market Revenue Billion Forecast, by Application 2019 & 2032
  82. Table 82: Global Public Cloud Market Volume K Units Forecast, by Application 2019 & 2032
  83. Table 83: Global Public Cloud Market Revenue Billion Forecast, by Country 2019 & 2032
  84. Table 84: Global Public Cloud Market Volume K Units Forecast, by Country 2019 & 2032
  85. Table 85: Saudi Arabia Public Cloud Market Revenue (Billion) Forecast, by Application 2019 & 2032
  86. Table 86: Saudi Arabia Public Cloud Market Volume (K Units) Forecast, by Application 2019 & 2032
  87. Table 87: UAE Public Cloud Market Revenue (Billion) Forecast, by Application 2019 & 2032
  88. Table 88: UAE Public Cloud Market Volume (K Units) Forecast, by Application 2019 & 2032
  89. Table 89: South Africa Public Cloud Market Revenue (Billion) Forecast, by Application 2019 & 2032
  90. Table 90: South Africa Public Cloud Market Volume (K Units) Forecast, by Application 2019 & 2032


STEP 1 - Identification of Relevant Samples Size from Population Database

Step Chart
bar chart
method chart

STEP 2 - Approaches for Defining Global Market Size (Value, Volume* & Price*)

approach chart
Top-down and bottom-up approaches are used to validate the global market size and estimate the market size for manufactures, regional segemnts, product and application.

Note* : In applicable scenarios

STEP 3 - Data Sources

Primary Research

  • Web Analytics
  • Survey Reports
  • Research Institute
  • Latest Research Reports
  • Opinion Leaders

Secondary Research

  • Annual Reports
  • White Paper
  • Latest Press Release
  • Industry Association
  • Paid Database
  • Investor Presentations
approach chart

STEP 4 - Data Triangulation

Involves using different sources of information in order to increase the validity of a study

These sources are likely to be stakeholders in a program - participants, other researchers, program staff, other community members, and so on.

Then we put all data in single framework & apply various statistical tools to find out the dynamic on the market.

During the analysis stage, feedback from the stakeholder groups would be compared to determine areas of agreement as well as areas of divergence

Additionally after gathering mix and scattered data from wide range of sources, data is triangull- ated and correlated to come up with estimated figures which are further validated through primary mediums, or industry experts, opinion leader.

Frequently Asked Questions

1. What is the projected Compound Annual Growth Rate (CAGR) of the Public Cloud Market?

The projected CAGR is approximately 10%.

2. Which companies are prominent players in the Public Cloud Market?

Key companies in the market include Microsoft Corporation, Amazon Web Services, Inc., Google LLC., Salesforce, Inc., Alibaba Group Holding Limited, SAP SE, Oracle Corporation, IBM Corporation, Tencent Cloud, Nutanix, OVH SAS, VMware, Inc., Kamatera, Inc., DigitalOcean, LLC., Rackspace Technology.

3. What are the main segments of the Public Cloud Market?

The market segments include Deployment Model, Organization Size, Application.

4. Can you provide details about the market size?

The market size is estimated to be USD 400 Billion as of 2022.

5. What are some drivers contributing to market growth?

Increasing Integration of big data. AI. and ML with cloud. Increasing public cloud spending. Growing adoption of cloud computing solutions in developing countries. Rising deployment of IaaS and PaaS in SME. Cost-effective and scalable.

6. What are the notable trends driving market growth?

N/A

7. Are there any restraints impacting market growth?

Data privacy and information security concerns. Cloud Wastage.

8. Can you provide examples of recent developments in the market?

N/A

9. What pricing options are available for accessing the report?

Pricing options include single-user, multi-user, and enterprise licenses priced at USD 4,850, USD 5,350, and USD 8,350 respectively.

10. Is the market size provided in terms of value or volume?

The market size is provided in terms of value, measured in Billion and volume, measured in K Units.

11. Are there any specific market keywords associated with the report?

Yes, the market keyword associated with the report is "Public Cloud Market," which aids in identifying and referencing the specific market segment covered.

12. How do I determine which pricing option suits my needs best?

The pricing options vary based on user requirements and access needs. Individual users may opt for single-user licenses, while businesses requiring broader access may choose multi-user or enterprise licenses for cost-effective access to the report.

13. Are there any additional resources or data provided in the Public Cloud Market report?

While the report offers comprehensive insights, it's advisable to review the specific contents or supplementary materials provided to ascertain if additional resources or data are available.

14. How can I stay updated on further developments or reports in the Public Cloud Market?

To stay informed about further developments, trends, and reports in the Public Cloud Market, consider subscribing to industry newsletters, following relevant companies and organizations, or regularly checking reputable industry news sources and publications.

Discover the Latest Market Insight Reports

Access in-depth insights on industries, companies, trends, and global markets. Our expertly curated reports provide the most relevant data and analysis in a condensed, easy-to-read format.

shop image 1

About Market Insights Report

Market Insights Reports offers comprehensive market research reports and analysis, giving businesses important information about their clients, rivals, and sector to help them make well-informed decisions on operations, marketing, and business strategy. We offer a variety of services in addition to market research, data analysis, and strategy planning. In order to find opportunities and learn more about our competitors and the industry at large, we employ competitive analysis. To identify areas for development, we also evaluate our performance against that of our rivals. We can determine the places at which we can offer our clients the most value by performing value chain analysis.

Additionally, clients receive a thorough overview of their industry business environment. We can find trends that help us forecast future possibilities and threats by examining global macroeconomic dynamics and consumer behavior patterns. By analyzing their features and advantages, contrasting them with comparable items on the market, and evaluating both their quantitative and qualitative performance, we comprehensively evaluate our clients' products. This allows us to assist customers in determining how their goods compare to those of their rivals and in creating successful marketing plans. Our group has been successful in gaining a thorough grasp of our clients' requirements and offering them creative solutions. We currently provide services to more than 50 nations in Europe, the Middle East, Africa, Latin America, Asia Pacific, and North America. Because of our global reach, we have been able to establish trusting bonds with our partners and clients in various nations, improving customer service and forging a more cohesive worldwide presence.

We use cookies to enhance your experience.

By clicking "Accept All", you consent to the use of all cookies.

Customize your preferences or read our Cookie Policy.