Report banner
Software-Defined Data Center Market
Updated On

Feb 22 2025

Total Pages

271

Software-Defined Data Center Market 2025 to Grow at 19 CAGR with 56.5 Billion Market Size: Analysis and Forecasts 2033

Software-Defined Data Center Market by Solution (Software-Defined Networking (SDN), Software-Defined Storage (SDS), Software-Defined Compute (SDC) (Largest Market)), by Organization Size (SME, Large enterprises), by End Use (Enterprise, Telecom service provider, Cloud service provider), by North America (U.S., Canada, Mexico), by Europe (UK, Germany, France, Italy, Spain, Benelux, Switzerland, Nordics), by Asia Pacific (China, India, Japan, ANZ, Singapore, South Korea), by South America (Brazil, Argentina, Chile, Colombia), by MEA (GCC, South Africa) Forecast 2025-2033

Publisher Logo

Software-Defined Data Center Market 2025 to Grow at 19 CAGR with 56.5 Billion Market Size: Analysis and Forecasts 2033


Key Insights 

The size of the Software-Defined Data Center Market was valued at USD 56.5 Billion in 2024 and is projected to reach USD 190.93 Billion by 2033, with an expected CAGR of 19% during the forecast period.The growing adoption of Software-Defined Data Centers (SDDCs) is driven by the increasing demand for flexibility, scalability, and cost-effectiveness in data center operations. Businesses are shifting toward SDDCs to modernize their IT infrastructure, benefiting from simplified management, improved agility, and enhanced resource utilization. By virtualizing compute, storage, and networking resources, SDDCs enable organizations to optimize workloads, reduce operational costs, and improve overall efficiency. Additionally, advancements in automation, artificial intelligence, and cloud integration are further propelling market growth. Enterprises across various industries, including banking, healthcare, and retail, are leveraging SDDCs to accelerate digital transformation and ensure seamless scalability. The rise of edge computing and hybrid cloud environments is also fueling the demand for SDDC solutions. Government initiatives supporting digital infrastructure development and increasing investments in data center modernization are additional factors driving market expansion. As a result, SDDCs are becoming a critical component of next-generation data center architectures.

Software-Defined Data Center Market Research Report - Market Size, Growth & Forecast

Software-Defined Data Center Market Concentration & Characteristics 

The SDDC market is characterized by a high level of innovation, driven by investments in research and development. Major players are continuously introducing new technologies and solutions to meet the evolving needs of data center operators. Regulations, such as data privacy and security requirements, play a significant role in shaping the market landscape. Furthermore, product substitutes, such as converged and hyperconverged infrastructure, pose competition to SDDCs in certain market segments. End user concentration is evident with large enterprises and cloud service providers being the primary customers for SDDCs. The market also witnesses a moderate level of M&A activity as companies seek to expand their capabilities and market share.

Software-Defined Data Center Market Trends 

The SDDC market is transforming with several key trends. Hybrid cloud adoption is driving the demand for SDDCs that provide seamless integration between on-premises and cloud environments. Automation and orchestration are becoming increasingly prevalent, enabling data centers to operate with greater efficiency and speed. Additionally, the rise of edge computing is creating demand for SDDCs designed to handle distributed and low-latency workloads.

Software-Defined Data Center Market Growth

Key Region or Country & Segment to Dominate the Market 

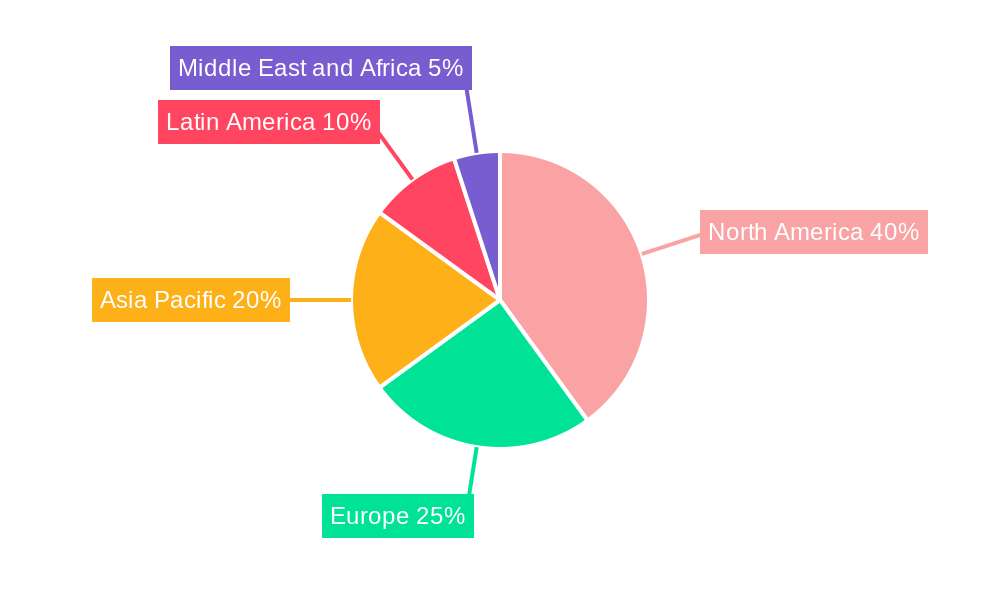
North America and Asia Pacific are anticipated to lead the SDDC market, driven by the presence of major data center operators and growing cloud adoption in these regions. The Software-Defined Compute (SDC) segment, being the largest market, is projected to maintain its dominance, driven by the increasing need for scalable and flexible compute resources in data centers.

Software-Defined Data Center Market Product Insights Report Coverage & Deliverables 

This report provides a comprehensive analysis of the SDDC market, including market size, share, and growth projections. It also offers insights into the market dynamics, challenges, and opportunities. The report includes detailed segmentation by solution, organization size, end use, and region.

Software-Defined Data Center Market Analysis 

The market size is estimated to reach USD 153.8 Billion by 2028, with significant growth across all segments. Large enterprises are expected to be the primary contributors to market growth, driven by their need for efficient data center operations.

Software-Defined Data Center Market Regional Insights 

North America remains the largest regional market, followed by Asia Pacific. Emerging economies in Asia Pacific are expected to experience substantial growth, driven by the rapid expansion of data center infrastructure in the region.

Driving Forces: What's Propelling the Software-Defined Data Center Market

  • Cost Reduction: SDDCs offer significant cost savings compared to traditional data center architectures.
  • Improved Flexibility: SDDCs enable dynamic resource allocation and provisioning, enhancing flexibility and scalability.
  • Increased Efficiency: Automation and orchestration in SDDCs streamline operations, improving efficiency and reducing human error.
  • Enhanced Security: Software-defined security technologies provide granular control and visibility, enhancing data protection.

Challenges and Restraints in Software-Defined Data Center Market

  • Complexity: Implementing and managing SDDCs can be complex, requiring specialized expertise.
  • Vendor Lock-in: Customers may experience vendor lock-in when using proprietary SDDC solutions.
  • Limited Compatibility: Interoperability between different SDDC solutions can be a challenge.

Emerging Trends in Software-Defined Data Center Market

  • Disaggregation of Hardware and Software: The separation of hardware and software components allows for greater flexibility and customization.
  • Artificial Intelligence (AI) and Machine Learning (ML): AI and ML are being integrated into SDDCs, enabling advanced automation and self-optimization.
  • Edge Computing: SDDCs are being adapted for edge computing environments, providing low-latency and distributed data processing capabilities.

Software-Defined Data Center Industry News

  • NTT Ltd. Expands in India with New Software-Defined Data Center Campus: In July 2023, NTT Ltd. launched a new software-defined data center campus in Chennai, India, with a total capacity of 34.8 MW.
  • Cisco and VMware Collaborate on Hybrid Cloud Solutions: Cisco and VMware have partnered to deliver hybrid cloud solutions that combine Cisco's SD-WAN and VMware's SDDC.
  • Microsoft Azure Stack HCI Integrates Kubernetes: Microsoft's Azure Stack HCI now supports Kubernetes, providing customers with a platform for containerized applications.

Leading Players in the Software-Defined Data Center Market

Software-Defined Data Center Market Segmentation

  • 1. Solution
    • 1.1. Software-Defined Networking (SDN)
    • 1.2. Software-Defined Storage (SDS)
    • 1.3. Software-Defined Compute (SDC) (Largest Market)
  • 2. Organization Size
    • 2.1. SME
    • 2.2. Large enterprises
  • 3. End Use
    • 3.1. Enterprise
    • 3.2. Telecom service provider
    • 3.3. Cloud service provider

Software-Defined Data Center Market Segmentation By Geography

  • 1. North America
    • 1.1. U.S.
    • 1.2. Canada
    • 1.3. Mexico
  • 2. Europe
    • 2.1. UK
    • 2.2. Germany
    • 2.3. France
    • 2.4. Italy
    • 2.5. Spain
    • 2.6. Benelux
    • 2.7. Switzerland
    • 2.8. Nordics
  • 3. Asia Pacific
    • 3.1. China
    • 3.2. India
    • 3.3. Japan
    • 3.4. ANZ
    • 3.5. Singapore
    • 3.6. South Korea
  • 4. South America
    • 4.1. Brazil
    • 4.2. Argentina
    • 4.3. Chile
    • 4.4. Colombia
  • 5. MEA
    • 5.1. GCC
    • 5.2. South Africa

Software-Defined Data Center Market Regional Share


Software-Defined Data Center Market REPORT HIGHLIGHTS

AspectsDetails
Study Period 2019-2033
Base Year 2024
Estimated Year 2025
Forecast Period2025-2033
Historical Period2019-2024
Growth RateCAGR of 19% from 2019-2033
Segmentation
    • By Solution
      • Software-Defined Networking (SDN)
      • Software-Defined Storage (SDS)
      • Software-Defined Compute (SDC) (Largest Market)
    • By Organization Size
      • SME
      • Large enterprises
    • By End Use
      • Enterprise
      • Telecom service provider
      • Cloud service provider
  • By Geography
    • North America
      • U.S.
      • Canada
      • Mexico
    • Europe
      • UK
      • Germany
      • France
      • Italy
      • Spain
      • Benelux
      • Switzerland
      • Nordics
    • Asia Pacific
      • China
      • India
      • Japan
      • ANZ
      • Singapore
      • South Korea
    • South America
      • Brazil
      • Argentina
      • Chile
      • Colombia
    • MEA
      • GCC
      • South Africa


Table of Contents

  1. 1. Introduction
    • 1.1. Research Scope
    • 1.2. Market Segmentation
    • 1.3. Research Methodology
    • 1.4. Definitions and Assumptions
  2. 2. Executive Summary
    • 2.1. Introduction
  3. 3. Market Dynamics
    • 3.1. Introduction
      • 3.2. Market Drivers
        • 3.2.1 The rising demand for virtualized IT infrastructure and services
        • 3.2.2 The widespread adoption of cloud computing services
        • 3.2.3 Increased demand for cost efficiency and resource optimization
        • 3.2.4 Rising digital transformation initiatives
      • 3.3. Market Restrains
        • 3.3.1. Complex implementation process
      • 3.4. Market Trends
        • 3.4.1 The SDDC market is transforming with several key trends. Hybrid cloud adoption is driving the demand for SDDCs that provide seamless integration between on-premises and cloud environments. Automation and orchestration are becoming increasingly prevalent
        • 3.4.2 enabling data centers to operate with greater efficiency and speed. Additionally
        • 3.4.3 the rise of edge computing is creating demand for SDDCs designed to handle distributed and low-latency workloads.
  4. 4. Market Factor Analysis
    • 4.1. Porters Five Forces
    • 4.2. Supply/Value Chain
    • 4.3. PESTEL analysis
    • 4.4. Market Entropy
    • 4.5. Patent/Trademark Analysis
  5. 5. Global Software-Defined Data Center Market Analysis, Insights and Forecast, 2019-2031
    • 5.1. Market Analysis, Insights and Forecast - by Solution
      • 5.1.1. Software-Defined Networking (SDN)
      • 5.1.2. Software-Defined Storage (SDS)
      • 5.1.3. Software-Defined Compute (SDC) (Largest Market)
    • 5.2. Market Analysis, Insights and Forecast - by Organization Size
      • 5.2.1. SME
      • 5.2.2. Large enterprises
    • 5.3. Market Analysis, Insights and Forecast - by End Use
      • 5.3.1. Enterprise
      • 5.3.2. Telecom service provider
      • 5.3.3. Cloud service provider
    • 5.4. Market Analysis, Insights and Forecast - by Region
      • 5.4.1. North America
      • 5.4.2. Europe
      • 5.4.3. Asia Pacific
      • 5.4.4. South America
      • 5.4.5. MEA
  6. 6. North America Software-Defined Data Center Market Analysis, Insights and Forecast, 2019-2031
    • 6.1. Market Analysis, Insights and Forecast - by Solution
      • 6.1.1. Software-Defined Networking (SDN)
      • 6.1.2. Software-Defined Storage (SDS)
      • 6.1.3. Software-Defined Compute (SDC) (Largest Market)
    • 6.2. Market Analysis, Insights and Forecast - by Organization Size
      • 6.2.1. SME
      • 6.2.2. Large enterprises
    • 6.3. Market Analysis, Insights and Forecast - by End Use
      • 6.3.1. Enterprise
      • 6.3.2. Telecom service provider
      • 6.3.3. Cloud service provider
  7. 7. Europe Software-Defined Data Center Market Analysis, Insights and Forecast, 2019-2031
    • 7.1. Market Analysis, Insights and Forecast - by Solution
      • 7.1.1. Software-Defined Networking (SDN)
      • 7.1.2. Software-Defined Storage (SDS)
      • 7.1.3. Software-Defined Compute (SDC) (Largest Market)
    • 7.2. Market Analysis, Insights and Forecast - by Organization Size
      • 7.2.1. SME
      • 7.2.2. Large enterprises
    • 7.3. Market Analysis, Insights and Forecast - by End Use
      • 7.3.1. Enterprise
      • 7.3.2. Telecom service provider
      • 7.3.3. Cloud service provider
  8. 8. Asia Pacific Software-Defined Data Center Market Analysis, Insights and Forecast, 2019-2031
    • 8.1. Market Analysis, Insights and Forecast - by Solution
      • 8.1.1. Software-Defined Networking (SDN)
      • 8.1.2. Software-Defined Storage (SDS)
      • 8.1.3. Software-Defined Compute (SDC) (Largest Market)
    • 8.2. Market Analysis, Insights and Forecast - by Organization Size
      • 8.2.1. SME
      • 8.2.2. Large enterprises
    • 8.3. Market Analysis, Insights and Forecast - by End Use
      • 8.3.1. Enterprise
      • 8.3.2. Telecom service provider
      • 8.3.3. Cloud service provider
  9. 9. South America Software-Defined Data Center Market Analysis, Insights and Forecast, 2019-2031
    • 9.1. Market Analysis, Insights and Forecast - by Solution
      • 9.1.1. Software-Defined Networking (SDN)
      • 9.1.2. Software-Defined Storage (SDS)
      • 9.1.3. Software-Defined Compute (SDC) (Largest Market)
    • 9.2. Market Analysis, Insights and Forecast - by Organization Size
      • 9.2.1. SME
      • 9.2.2. Large enterprises
    • 9.3. Market Analysis, Insights and Forecast - by End Use
      • 9.3.1. Enterprise
      • 9.3.2. Telecom service provider
      • 9.3.3. Cloud service provider
  10. 10. MEA Software-Defined Data Center Market Analysis, Insights and Forecast, 2019-2031
    • 10.1. Market Analysis, Insights and Forecast - by Solution
      • 10.1.1. Software-Defined Networking (SDN)
      • 10.1.2. Software-Defined Storage (SDS)
      • 10.1.3. Software-Defined Compute (SDC) (Largest Market)
    • 10.2. Market Analysis, Insights and Forecast - by Organization Size
      • 10.2.1. SME
      • 10.2.2. Large enterprises
    • 10.3. Market Analysis, Insights and Forecast - by End Use
      • 10.3.1. Enterprise
      • 10.3.2. Telecom service provider
      • 10.3.3. Cloud service provider
  11. 11. Competitive Analysis
    • 11.1. Global Market Share Analysis 2024
      • 11.2. Company Profiles
        • 11.2.1 Cisco Systems Inc
          • 11.2.1.1. Overview
          • 11.2.1.2. Products
          • 11.2.1.3. SWOT Analysis
          • 11.2.1.4. Recent Developments
          • 11.2.1.5. Financials (Based on Availability)
        • 11.2.2 Fujitsu
          • 11.2.2.1. Overview
          • 11.2.2.2. Products
          • 11.2.2.3. SWOT Analysis
          • 11.2.2.4. Recent Developments
          • 11.2.2.5. Financials (Based on Availability)
        • 11.2.3 Hitachi Data Systems (Hitachi Vantra)
          • 11.2.3.1. Overview
          • 11.2.3.2. Products
          • 11.2.3.3. SWOT Analysis
          • 11.2.3.4. Recent Developments
          • 11.2.3.5. Financials (Based on Availability)
        • 11.2.4 HPE
          • 11.2.4.1. Overview
          • 11.2.4.2. Products
          • 11.2.4.3. SWOT Analysis
          • 11.2.4.4. Recent Developments
          • 11.2.4.5. Financials (Based on Availability)
        • 11.2.5 Huawei
          • 11.2.5.1. Overview
          • 11.2.5.2. Products
          • 11.2.5.3. SWOT Analysis
          • 11.2.5.4. Recent Developments
          • 11.2.5.5. Financials (Based on Availability)
        • 11.2.6 IBM Corporation
          • 11.2.6.1. Overview
          • 11.2.6.2. Products
          • 11.2.6.3. SWOT Analysis
          • 11.2.6.4. Recent Developments
          • 11.2.6.5. Financials (Based on Availability)
        • 11.2.7 Juniper Networks Inc
          • 11.2.7.1. Overview
          • 11.2.7.2. Products
          • 11.2.7.3. SWOT Analysis
          • 11.2.7.4. Recent Developments
          • 11.2.7.5. Financials (Based on Availability)
        • 11.2.8 Microsoft Corporation
          • 11.2.8.1. Overview
          • 11.2.8.2. Products
          • 11.2.8.3. SWOT Analysis
          • 11.2.8.4. Recent Developments
          • 11.2.8.5. Financials (Based on Availability)
        • 11.2.9 NEC Corporation of America (NEC Corporation)
          • 11.2.9.1. Overview
          • 11.2.9.2. Products
          • 11.2.9.3. SWOT Analysis
          • 11.2.9.4. Recent Developments
          • 11.2.9.5. Financials (Based on Availability)
        • 11.2.10 NetApp Inc
          • 11.2.10.1. Overview
          • 11.2.10.2. Products
          • 11.2.10.3. SWOT Analysis
          • 11.2.10.4. Recent Developments
          • 11.2.10.5. Financials (Based on Availability)
        • 11.2.11 Oracle Corporation
          • 11.2.11.1. Overview
          • 11.2.11.2. Products
          • 11.2.11.3. SWOT Analysis
          • 11.2.11.4. Recent Developments
          • 11.2.11.5. Financials (Based on Availability)
        • 11.2.12 Vmware Inc
          • 11.2.12.1. Overview
          • 11.2.12.2. Products
          • 11.2.12.3. SWOT Analysis
          • 11.2.12.4. Recent Developments
          • 11.2.12.5. Financials (Based on Availability)

List of Figures

  1. Figure 1: Global Software-Defined Data Center Market Revenue Breakdown (Billion, %) by Region 2024 & 2032
  2. Figure 2: Global Software-Defined Data Center Market Volume Breakdown (units, %) by Region 2024 & 2032
  3. Figure 3: North America Software-Defined Data Center Market Revenue (Billion), by Solution 2024 & 2032
  4. Figure 4: North America Software-Defined Data Center Market Volume (units), by Solution 2024 & 2032
  5. Figure 5: North America Software-Defined Data Center Market Revenue Share (%), by Solution 2024 & 2032
  6. Figure 6: North America Software-Defined Data Center Market Volume Share (%), by Solution 2024 & 2032
  7. Figure 7: North America Software-Defined Data Center Market Revenue (Billion), by Organization Size 2024 & 2032
  8. Figure 8: North America Software-Defined Data Center Market Volume (units), by Organization Size 2024 & 2032
  9. Figure 9: North America Software-Defined Data Center Market Revenue Share (%), by Organization Size 2024 & 2032
  10. Figure 10: North America Software-Defined Data Center Market Volume Share (%), by Organization Size 2024 & 2032
  11. Figure 11: North America Software-Defined Data Center Market Revenue (Billion), by End Use 2024 & 2032
  12. Figure 12: North America Software-Defined Data Center Market Volume (units), by End Use 2024 & 2032
  13. Figure 13: North America Software-Defined Data Center Market Revenue Share (%), by End Use 2024 & 2032
  14. Figure 14: North America Software-Defined Data Center Market Volume Share (%), by End Use 2024 & 2032
  15. Figure 15: North America Software-Defined Data Center Market Revenue (Billion), by Country 2024 & 2032
  16. Figure 16: North America Software-Defined Data Center Market Volume (units), by Country 2024 & 2032
  17. Figure 17: North America Software-Defined Data Center Market Revenue Share (%), by Country 2024 & 2032
  18. Figure 18: North America Software-Defined Data Center Market Volume Share (%), by Country 2024 & 2032
  19. Figure 19: Europe Software-Defined Data Center Market Revenue (Billion), by Solution 2024 & 2032
  20. Figure 20: Europe Software-Defined Data Center Market Volume (units), by Solution 2024 & 2032
  21. Figure 21: Europe Software-Defined Data Center Market Revenue Share (%), by Solution 2024 & 2032
  22. Figure 22: Europe Software-Defined Data Center Market Volume Share (%), by Solution 2024 & 2032
  23. Figure 23: Europe Software-Defined Data Center Market Revenue (Billion), by Organization Size 2024 & 2032
  24. Figure 24: Europe Software-Defined Data Center Market Volume (units), by Organization Size 2024 & 2032
  25. Figure 25: Europe Software-Defined Data Center Market Revenue Share (%), by Organization Size 2024 & 2032
  26. Figure 26: Europe Software-Defined Data Center Market Volume Share (%), by Organization Size 2024 & 2032
  27. Figure 27: Europe Software-Defined Data Center Market Revenue (Billion), by End Use 2024 & 2032
  28. Figure 28: Europe Software-Defined Data Center Market Volume (units), by End Use 2024 & 2032
  29. Figure 29: Europe Software-Defined Data Center Market Revenue Share (%), by End Use 2024 & 2032
  30. Figure 30: Europe Software-Defined Data Center Market Volume Share (%), by End Use 2024 & 2032
  31. Figure 31: Europe Software-Defined Data Center Market Revenue (Billion), by Country 2024 & 2032
  32. Figure 32: Europe Software-Defined Data Center Market Volume (units), by Country 2024 & 2032
  33. Figure 33: Europe Software-Defined Data Center Market Revenue Share (%), by Country 2024 & 2032
  34. Figure 34: Europe Software-Defined Data Center Market Volume Share (%), by Country 2024 & 2032
  35. Figure 35: Asia Pacific Software-Defined Data Center Market Revenue (Billion), by Solution 2024 & 2032
  36. Figure 36: Asia Pacific Software-Defined Data Center Market Volume (units), by Solution 2024 & 2032
  37. Figure 37: Asia Pacific Software-Defined Data Center Market Revenue Share (%), by Solution 2024 & 2032
  38. Figure 38: Asia Pacific Software-Defined Data Center Market Volume Share (%), by Solution 2024 & 2032
  39. Figure 39: Asia Pacific Software-Defined Data Center Market Revenue (Billion), by Organization Size 2024 & 2032
  40. Figure 40: Asia Pacific Software-Defined Data Center Market Volume (units), by Organization Size 2024 & 2032
  41. Figure 41: Asia Pacific Software-Defined Data Center Market Revenue Share (%), by Organization Size 2024 & 2032
  42. Figure 42: Asia Pacific Software-Defined Data Center Market Volume Share (%), by Organization Size 2024 & 2032
  43. Figure 43: Asia Pacific Software-Defined Data Center Market Revenue (Billion), by End Use 2024 & 2032
  44. Figure 44: Asia Pacific Software-Defined Data Center Market Volume (units), by End Use 2024 & 2032
  45. Figure 45: Asia Pacific Software-Defined Data Center Market Revenue Share (%), by End Use 2024 & 2032
  46. Figure 46: Asia Pacific Software-Defined Data Center Market Volume Share (%), by End Use 2024 & 2032
  47. Figure 47: Asia Pacific Software-Defined Data Center Market Revenue (Billion), by Country 2024 & 2032
  48. Figure 48: Asia Pacific Software-Defined Data Center Market Volume (units), by Country 2024 & 2032
  49. Figure 49: Asia Pacific Software-Defined Data Center Market Revenue Share (%), by Country 2024 & 2032
  50. Figure 50: Asia Pacific Software-Defined Data Center Market Volume Share (%), by Country 2024 & 2032
  51. Figure 51: South America Software-Defined Data Center Market Revenue (Billion), by Solution 2024 & 2032
  52. Figure 52: South America Software-Defined Data Center Market Volume (units), by Solution 2024 & 2032
  53. Figure 53: South America Software-Defined Data Center Market Revenue Share (%), by Solution 2024 & 2032
  54. Figure 54: South America Software-Defined Data Center Market Volume Share (%), by Solution 2024 & 2032
  55. Figure 55: South America Software-Defined Data Center Market Revenue (Billion), by Organization Size 2024 & 2032
  56. Figure 56: South America Software-Defined Data Center Market Volume (units), by Organization Size 2024 & 2032
  57. Figure 57: South America Software-Defined Data Center Market Revenue Share (%), by Organization Size 2024 & 2032
  58. Figure 58: South America Software-Defined Data Center Market Volume Share (%), by Organization Size 2024 & 2032
  59. Figure 59: South America Software-Defined Data Center Market Revenue (Billion), by End Use 2024 & 2032
  60. Figure 60: South America Software-Defined Data Center Market Volume (units), by End Use 2024 & 2032
  61. Figure 61: South America Software-Defined Data Center Market Revenue Share (%), by End Use 2024 & 2032
  62. Figure 62: South America Software-Defined Data Center Market Volume Share (%), by End Use 2024 & 2032
  63. Figure 63: South America Software-Defined Data Center Market Revenue (Billion), by Country 2024 & 2032
  64. Figure 64: South America Software-Defined Data Center Market Volume (units), by Country 2024 & 2032
  65. Figure 65: South America Software-Defined Data Center Market Revenue Share (%), by Country 2024 & 2032
  66. Figure 66: South America Software-Defined Data Center Market Volume Share (%), by Country 2024 & 2032
  67. Figure 67: MEA Software-Defined Data Center Market Revenue (Billion), by Solution 2024 & 2032
  68. Figure 68: MEA Software-Defined Data Center Market Volume (units), by Solution 2024 & 2032
  69. Figure 69: MEA Software-Defined Data Center Market Revenue Share (%), by Solution 2024 & 2032
  70. Figure 70: MEA Software-Defined Data Center Market Volume Share (%), by Solution 2024 & 2032
  71. Figure 71: MEA Software-Defined Data Center Market Revenue (Billion), by Organization Size 2024 & 2032
  72. Figure 72: MEA Software-Defined Data Center Market Volume (units), by Organization Size 2024 & 2032
  73. Figure 73: MEA Software-Defined Data Center Market Revenue Share (%), by Organization Size 2024 & 2032
  74. Figure 74: MEA Software-Defined Data Center Market Volume Share (%), by Organization Size 2024 & 2032
  75. Figure 75: MEA Software-Defined Data Center Market Revenue (Billion), by End Use 2024 & 2032
  76. Figure 76: MEA Software-Defined Data Center Market Volume (units), by End Use 2024 & 2032
  77. Figure 77: MEA Software-Defined Data Center Market Revenue Share (%), by End Use 2024 & 2032
  78. Figure 78: MEA Software-Defined Data Center Market Volume Share (%), by End Use 2024 & 2032
  79. Figure 79: MEA Software-Defined Data Center Market Revenue (Billion), by Country 2024 & 2032
  80. Figure 80: MEA Software-Defined Data Center Market Volume (units), by Country 2024 & 2032
  81. Figure 81: MEA Software-Defined Data Center Market Revenue Share (%), by Country 2024 & 2032
  82. Figure 82: MEA Software-Defined Data Center Market Volume Share (%), by Country 2024 & 2032

List of Tables

  1. Table 1: Global Software-Defined Data Center Market Revenue Billion Forecast, by Region 2019 & 2032
  2. Table 2: Global Software-Defined Data Center Market Volume units Forecast, by Region 2019 & 2032
  3. Table 3: Global Software-Defined Data Center Market Revenue Billion Forecast, by Solution 2019 & 2032
  4. Table 4: Global Software-Defined Data Center Market Volume units Forecast, by Solution 2019 & 2032
  5. Table 5: Global Software-Defined Data Center Market Revenue Billion Forecast, by Organization Size 2019 & 2032
  6. Table 6: Global Software-Defined Data Center Market Volume units Forecast, by Organization Size 2019 & 2032
  7. Table 7: Global Software-Defined Data Center Market Revenue Billion Forecast, by End Use 2019 & 2032
  8. Table 8: Global Software-Defined Data Center Market Volume units Forecast, by End Use 2019 & 2032
  9. Table 9: Global Software-Defined Data Center Market Revenue Billion Forecast, by Region 2019 & 2032
  10. Table 10: Global Software-Defined Data Center Market Volume units Forecast, by Region 2019 & 2032
  11. Table 11: Global Software-Defined Data Center Market Revenue Billion Forecast, by Solution 2019 & 2032
  12. Table 12: Global Software-Defined Data Center Market Volume units Forecast, by Solution 2019 & 2032
  13. Table 13: Global Software-Defined Data Center Market Revenue Billion Forecast, by Organization Size 2019 & 2032
  14. Table 14: Global Software-Defined Data Center Market Volume units Forecast, by Organization Size 2019 & 2032
  15. Table 15: Global Software-Defined Data Center Market Revenue Billion Forecast, by End Use 2019 & 2032
  16. Table 16: Global Software-Defined Data Center Market Volume units Forecast, by End Use 2019 & 2032
  17. Table 17: Global Software-Defined Data Center Market Revenue Billion Forecast, by Country 2019 & 2032
  18. Table 18: Global Software-Defined Data Center Market Volume units Forecast, by Country 2019 & 2032
  19. Table 19: U.S. Software-Defined Data Center Market Revenue (Billion) Forecast, by Application 2019 & 2032
  20. Table 20: U.S. Software-Defined Data Center Market Volume (units) Forecast, by Application 2019 & 2032
  21. Table 21: Canada Software-Defined Data Center Market Revenue (Billion) Forecast, by Application 2019 & 2032
  22. Table 22: Canada Software-Defined Data Center Market Volume (units) Forecast, by Application 2019 & 2032
  23. Table 23: Mexico Software-Defined Data Center Market Revenue (Billion) Forecast, by Application 2019 & 2032
  24. Table 24: Mexico Software-Defined Data Center Market Volume (units) Forecast, by Application 2019 & 2032
  25. Table 25: Global Software-Defined Data Center Market Revenue Billion Forecast, by Solution 2019 & 2032
  26. Table 26: Global Software-Defined Data Center Market Volume units Forecast, by Solution 2019 & 2032
  27. Table 27: Global Software-Defined Data Center Market Revenue Billion Forecast, by Organization Size 2019 & 2032
  28. Table 28: Global Software-Defined Data Center Market Volume units Forecast, by Organization Size 2019 & 2032
  29. Table 29: Global Software-Defined Data Center Market Revenue Billion Forecast, by End Use 2019 & 2032
  30. Table 30: Global Software-Defined Data Center Market Volume units Forecast, by End Use 2019 & 2032
  31. Table 31: Global Software-Defined Data Center Market Revenue Billion Forecast, by Country 2019 & 2032
  32. Table 32: Global Software-Defined Data Center Market Volume units Forecast, by Country 2019 & 2032
  33. Table 33: UK Software-Defined Data Center Market Revenue (Billion) Forecast, by Application 2019 & 2032
  34. Table 34: UK Software-Defined Data Center Market Volume (units) Forecast, by Application 2019 & 2032
  35. Table 35: Germany Software-Defined Data Center Market Revenue (Billion) Forecast, by Application 2019 & 2032
  36. Table 36: Germany Software-Defined Data Center Market Volume (units) Forecast, by Application 2019 & 2032
  37. Table 37: France Software-Defined Data Center Market Revenue (Billion) Forecast, by Application 2019 & 2032
  38. Table 38: France Software-Defined Data Center Market Volume (units) Forecast, by Application 2019 & 2032
  39. Table 39: Italy Software-Defined Data Center Market Revenue (Billion) Forecast, by Application 2019 & 2032
  40. Table 40: Italy Software-Defined Data Center Market Volume (units) Forecast, by Application 2019 & 2032
  41. Table 41: Spain Software-Defined Data Center Market Revenue (Billion) Forecast, by Application 2019 & 2032
  42. Table 42: Spain Software-Defined Data Center Market Volume (units) Forecast, by Application 2019 & 2032
  43. Table 43: Benelux Software-Defined Data Center Market Revenue (Billion) Forecast, by Application 2019 & 2032
  44. Table 44: Benelux Software-Defined Data Center Market Volume (units) Forecast, by Application 2019 & 2032
  45. Table 45: Switzerland Software-Defined Data Center Market Revenue (Billion) Forecast, by Application 2019 & 2032
  46. Table 46: Switzerland Software-Defined Data Center Market Volume (units) Forecast, by Application 2019 & 2032
  47. Table 47: Nordics Software-Defined Data Center Market Revenue (Billion) Forecast, by Application 2019 & 2032
  48. Table 48: Nordics Software-Defined Data Center Market Volume (units) Forecast, by Application 2019 & 2032
  49. Table 49: Global Software-Defined Data Center Market Revenue Billion Forecast, by Solution 2019 & 2032
  50. Table 50: Global Software-Defined Data Center Market Volume units Forecast, by Solution 2019 & 2032
  51. Table 51: Global Software-Defined Data Center Market Revenue Billion Forecast, by Organization Size 2019 & 2032
  52. Table 52: Global Software-Defined Data Center Market Volume units Forecast, by Organization Size 2019 & 2032
  53. Table 53: Global Software-Defined Data Center Market Revenue Billion Forecast, by End Use 2019 & 2032
  54. Table 54: Global Software-Defined Data Center Market Volume units Forecast, by End Use 2019 & 2032
  55. Table 55: Global Software-Defined Data Center Market Revenue Billion Forecast, by Country 2019 & 2032
  56. Table 56: Global Software-Defined Data Center Market Volume units Forecast, by Country 2019 & 2032
  57. Table 57: China Software-Defined Data Center Market Revenue (Billion) Forecast, by Application 2019 & 2032
  58. Table 58: China Software-Defined Data Center Market Volume (units) Forecast, by Application 2019 & 2032
  59. Table 59: India Software-Defined Data Center Market Revenue (Billion) Forecast, by Application 2019 & 2032
  60. Table 60: India Software-Defined Data Center Market Volume (units) Forecast, by Application 2019 & 2032
  61. Table 61: Japan Software-Defined Data Center Market Revenue (Billion) Forecast, by Application 2019 & 2032
  62. Table 62: Japan Software-Defined Data Center Market Volume (units) Forecast, by Application 2019 & 2032
  63. Table 63: ANZ Software-Defined Data Center Market Revenue (Billion) Forecast, by Application 2019 & 2032
  64. Table 64: ANZ Software-Defined Data Center Market Volume (units) Forecast, by Application 2019 & 2032
  65. Table 65: Singapore Software-Defined Data Center Market Revenue (Billion) Forecast, by Application 2019 & 2032
  66. Table 66: Singapore Software-Defined Data Center Market Volume (units) Forecast, by Application 2019 & 2032
  67. Table 67: South Korea Software-Defined Data Center Market Revenue (Billion) Forecast, by Application 2019 & 2032
  68. Table 68: South Korea Software-Defined Data Center Market Volume (units) Forecast, by Application 2019 & 2032
  69. Table 69: Global Software-Defined Data Center Market Revenue Billion Forecast, by Solution 2019 & 2032
  70. Table 70: Global Software-Defined Data Center Market Volume units Forecast, by Solution 2019 & 2032
  71. Table 71: Global Software-Defined Data Center Market Revenue Billion Forecast, by Organization Size 2019 & 2032
  72. Table 72: Global Software-Defined Data Center Market Volume units Forecast, by Organization Size 2019 & 2032
  73. Table 73: Global Software-Defined Data Center Market Revenue Billion Forecast, by End Use 2019 & 2032
  74. Table 74: Global Software-Defined Data Center Market Volume units Forecast, by End Use 2019 & 2032
  75. Table 75: Global Software-Defined Data Center Market Revenue Billion Forecast, by Country 2019 & 2032
  76. Table 76: Global Software-Defined Data Center Market Volume units Forecast, by Country 2019 & 2032
  77. Table 77: Brazil Software-Defined Data Center Market Revenue (Billion) Forecast, by Application 2019 & 2032
  78. Table 78: Brazil Software-Defined Data Center Market Volume (units) Forecast, by Application 2019 & 2032
  79. Table 79: Argentina Software-Defined Data Center Market Revenue (Billion) Forecast, by Application 2019 & 2032
  80. Table 80: Argentina Software-Defined Data Center Market Volume (units) Forecast, by Application 2019 & 2032
  81. Table 81: Chile Software-Defined Data Center Market Revenue (Billion) Forecast, by Application 2019 & 2032
  82. Table 82: Chile Software-Defined Data Center Market Volume (units) Forecast, by Application 2019 & 2032
  83. Table 83: Colombia Software-Defined Data Center Market Revenue (Billion) Forecast, by Application 2019 & 2032
  84. Table 84: Colombia Software-Defined Data Center Market Volume (units) Forecast, by Application 2019 & 2032
  85. Table 85: Global Software-Defined Data Center Market Revenue Billion Forecast, by Solution 2019 & 2032
  86. Table 86: Global Software-Defined Data Center Market Volume units Forecast, by Solution 2019 & 2032
  87. Table 87: Global Software-Defined Data Center Market Revenue Billion Forecast, by Organization Size 2019 & 2032
  88. Table 88: Global Software-Defined Data Center Market Volume units Forecast, by Organization Size 2019 & 2032
  89. Table 89: Global Software-Defined Data Center Market Revenue Billion Forecast, by End Use 2019 & 2032
  90. Table 90: Global Software-Defined Data Center Market Volume units Forecast, by End Use 2019 & 2032
  91. Table 91: Global Software-Defined Data Center Market Revenue Billion Forecast, by Country 2019 & 2032
  92. Table 92: Global Software-Defined Data Center Market Volume units Forecast, by Country 2019 & 2032
  93. Table 93: GCC Software-Defined Data Center Market Revenue (Billion) Forecast, by Application 2019 & 2032
  94. Table 94: GCC Software-Defined Data Center Market Volume (units) Forecast, by Application 2019 & 2032
  95. Table 95: South Africa Software-Defined Data Center Market Revenue (Billion) Forecast, by Application 2019 & 2032
  96. Table 96: South Africa Software-Defined Data Center Market Volume (units) Forecast, by Application 2019 & 2032


STEP 1 - Identification of Relevant Samples Size from Population Database

Step Chart
bar chart
method chart

STEP 2 - Approaches for Defining Global Market Size (Value, Volume* & Price*)

approach chart
Top-down and bottom-up approaches are used to validate the global market size and estimate the market size for manufactures, regional segemnts, product and application.

Note* : In applicable scenarios

STEP 3 - Data Sources

Primary Research

  • Web Analytics
  • Survey Reports
  • Research Institute
  • Latest Research Reports
  • Opinion Leaders

Secondary Research

  • Annual Reports
  • White Paper
  • Latest Press Release
  • Industry Association
  • Paid Database
  • Investor Presentations
approach chart

STEP 4 - Data Triangulation

Involves using different sources of information in order to increase the validity of a study

These sources are likely to be stakeholders in a program - participants, other researchers, program staff, other community members, and so on.

Then we put all data in single framework & apply various statistical tools to find out the dynamic on the market.

During the analysis stage, feedback from the stakeholder groups would be compared to determine areas of agreement as well as areas of divergence

Additionally after gathering mix and scattered data from wide range of sources, data is triangull- ated and correlated to come up with estimated figures which are further validated through primary mediums, or industry experts, opinion leader.

Frequently Asked Questions

1. What is the projected Compound Annual Growth Rate (CAGR) of the Software-Defined Data Center Market?

The projected CAGR is approximately 19%.

2. Which companies are prominent players in the Software-Defined Data Center Market?

Key companies in the market include Cisco Systems Inc, Fujitsu, Hitachi Data Systems (Hitachi Vantra), HPE, Huawei, IBM Corporation, Juniper Networks, Inc, Microsoft Corporation, NEC Corporation of America (NEC Corporation), NetApp, Inc, Oracle Corporation, Vmware, Inc.

3. What are the main segments of the Software-Defined Data Center Market?

The market segments include Solution, Organization Size, End Use.

4. Can you provide details about the market size?

The market size is estimated to be USD 56.5 Billion as of 2022.

5. What are some drivers contributing to market growth?

The rising demand for virtualized IT infrastructure and services. The widespread adoption of cloud computing services. Increased demand for cost efficiency and resource optimization. Rising digital transformation initiatives.

6. What are the notable trends driving market growth?

The SDDC market is transforming with several key trends. Hybrid cloud adoption is driving the demand for SDDCs that provide seamless integration between on-premises and cloud environments. Automation and orchestration are becoming increasingly prevalent. enabling data centers to operate with greater efficiency and speed. Additionally. the rise of edge computing is creating demand for SDDCs designed to handle distributed and low-latency workloads..

7. Are there any restraints impacting market growth?

Complex implementation process.

8. Can you provide examples of recent developments in the market?

In July 2023, NTT Ltd. introduced its new software-defined data center campus in Chennai (India), spanning six acres and boasting a total capacity of 34.8 MW across two buildings. The first facility, operational with a 17.4 MW IT load, accompanies the arrival of the MIST subsea cable system in Chennai, solidifying NTT's position in the India data center industry.

9. What pricing options are available for accessing the report?

Pricing options include single-user, multi-user, and enterprise licenses priced at USD 4,850, USD 5,350, and USD 8,350 respectively.

10. Is the market size provided in terms of value or volume?

The market size is provided in terms of value, measured in Billion and volume, measured in units.

11. Are there any specific market keywords associated with the report?

Yes, the market keyword associated with the report is "Software-Defined Data Center Market," which aids in identifying and referencing the specific market segment covered.

12. How do I determine which pricing option suits my needs best?

The pricing options vary based on user requirements and access needs. Individual users may opt for single-user licenses, while businesses requiring broader access may choose multi-user or enterprise licenses for cost-effective access to the report.

13. Are there any additional resources or data provided in the Software-Defined Data Center Market report?

While the report offers comprehensive insights, it's advisable to review the specific contents or supplementary materials provided to ascertain if additional resources or data are available.

14. How can I stay updated on further developments or reports in the Software-Defined Data Center Market?

To stay informed about further developments, trends, and reports in the Software-Defined Data Center Market, consider subscribing to industry newsletters, following relevant companies and organizations, or regularly checking reputable industry news sources and publications.

Discover the Latest Market Insight Reports

Access in-depth insights on industries, companies, trends, and global markets. Our expertly curated reports provide the most relevant data and analysis in a condensed, easy-to-read format.

shop image 1

About Market Insights Report

Market Insights Reports offers comprehensive market research reports and analysis, giving businesses important information about their clients, rivals, and sector to help them make well-informed decisions on operations, marketing, and business strategy. We offer a variety of services in addition to market research, data analysis, and strategy planning. In order to find opportunities and learn more about our competitors and the industry at large, we employ competitive analysis. To identify areas for development, we also evaluate our performance against that of our rivals. We can determine the places at which we can offer our clients the most value by performing value chain analysis.

Additionally, clients receive a thorough overview of their industry business environment. We can find trends that help us forecast future possibilities and threats by examining global macroeconomic dynamics and consumer behavior patterns. By analyzing their features and advantages, contrasting them with comparable items on the market, and evaluating both their quantitative and qualitative performance, we comprehensively evaluate our clients' products. This allows us to assist customers in determining how their goods compare to those of their rivals and in creating successful marketing plans. Our group has been successful in gaining a thorough grasp of our clients' requirements and offering them creative solutions. We currently provide services to more than 50 nations in Europe, the Middle East, Africa, Latin America, Asia Pacific, and North America. Because of our global reach, we have been able to establish trusting bonds with our partners and clients in various nations, improving customer service and forging a more cohesive worldwide presence.

We use cookies to enhance your experience.

By clicking "Accept All", you consent to the use of all cookies.

Customize your preferences or read our Cookie Policy.