
.jpg&w=3840&q=100)
Market
Insights
Reports delivered globally, covering a wide range of industries and sectors.
Clients who trust our expertise and rely on our insights for business decisions.
Managed Reports, ensuring seamless updates and premium service.
Satisfied Customers, committed to delivering exceptional value and quality.
Adventure Tourism Market Insightful Analysis: Trends, Competitor Dynamics, and Opportunities 2025-2033
Adventure Tourism Market by Type (Hard, Soft), by Age Group (20-30 Years, 30-40 Years, 40-50 Years, Above 50), by Packages (Low, Medium, Premium), by Booking Mode (Travel Agent, Individuals, Event Planners), by North America (U.S., Canada), by Europe (UK, Germany, France, Italy, Spain, Russia, Nordics, Rest of Europe), by Asia Pacific (China, India, Japan, South Korea, ANZ, Southeast Asia, Rest of Asia Pacific), by Latin America (Brazil, Mexico, Argentina, Rest of Latin America), by MEA (South Africa, UAE, Saudi Arabia, Rest of MEA) Forecast 2025-2033
Adventure Tourism Market Insightful Analysis: Trends, Competitor Dynamics, and Opportunities 2025-2033
Key Insights
The size of the Adventure Tourism Market was valued at USD 483.3 Billion in 2024 and is projected to reach USD 1301.32 Billion by 2033, with an expected CAGR of 15.2% during the forecast period.The Adventure Tourism Market encompasses travel opportunities that emphasize outdoor activities, exploration, and adventure in natural environments, often featuring physical engagement, cultural experiences, and a sense of excitement. This market encompasses a variety of activities like hiking, trekking, rock climbing, scuba diving, zip-lining, safaris, and white-water rafting, aimed at travelers looking for distinctive, challenging, and exhilarating experiences. The expansion of the market is fueled by a growing craving among travelers for more immersive, unconventional experiences, along with the surging interest in eco-tourism and sustainable travel. Adventure tourism also appeals to individuals seeking personal growth, team-building experiences, and physical challenges. The market is supported by technological advancements that boost safety protocols, facilitate access to distant areas, and provide customized adventure packages. Moreover, the increasing enthusiasm for wellness travel, fitness, and the discovery of more off-the-beaten-path locations boosts the industry. As consumers place greater importance on experiences rather than physical possessions and seek purposeful travel, the Adventure Tourism Market is projected to keep growing, providing a wider array of thrilling choices for adventurers globally.

Adventure Tourism Market Concentration & Characteristics
The adventure tourism market is concentrated in a few key regions, including North America, Europe, and Asia Pacific. The market is characterized by a high degree of innovation, as adventure tourism companies are constantly developing new and exciting experiences to offer their customers. The market is also subject to a number of regulations, including safety regulations and environmental regulations.
Adventure Tourism Market Trends
Some of the key trends in the adventure tourism market include:
- Growing popularity of soft adventure tourism: Soft adventure tourism activities are less physically demanding than traditional adventure tourism activities, and they are appealing to a wider range of people.
- Increased demand for customized adventure trips: People are increasingly looking for adventure trips that are customized to their individual needs and interests.
- Growing use of technology in adventure tourism: Technology is being used to enhance the adventure tourism experience, such as through the use of GPS tracking devices and virtual reality.

Key Region or Country & Segment to Dominate the Market
North America is expected to dominate the adventure tourism market in the coming years due to the region's large population of affluent consumers and a well-developed tourism infrastructure. Within North America, the United States is the largest market for adventure tourism.
In terms of segments, the hard adventure tourism segment is expected to dominate the market in the coming years due to the growing popularity of activities such as rock climbing, mountain biking, and white-water rafting.
Adventure Tourism Market Product Insights Report Coverage & Deliverables
The adventure tourism market product insights report coverage includes:
- Market size and growth: The report provides an overview of the adventure tourism market size and growth, including historical data and forecasts for the future.
- Market share: The report provides an analysis of the market share of the leading adventure tourism companies.
- Product trends: The report identifies the key product trends in the adventure tourism market, including the growing popularity of soft adventure tourism and customized adventure trips.
- Consumer insights: The report provides insights into the demographics and preferences of adventure tourism consumers.
Adventure Tourism Market Analysis
The adventure tourism market is expected to grow from 483.3 Billion in 2023 to 1,234.2 Billion by 2031, at a CAGR of 15.2%. The market is driven by the increasing popularity of adventure tourism, rising disposable income, and growing awareness of healthy living.
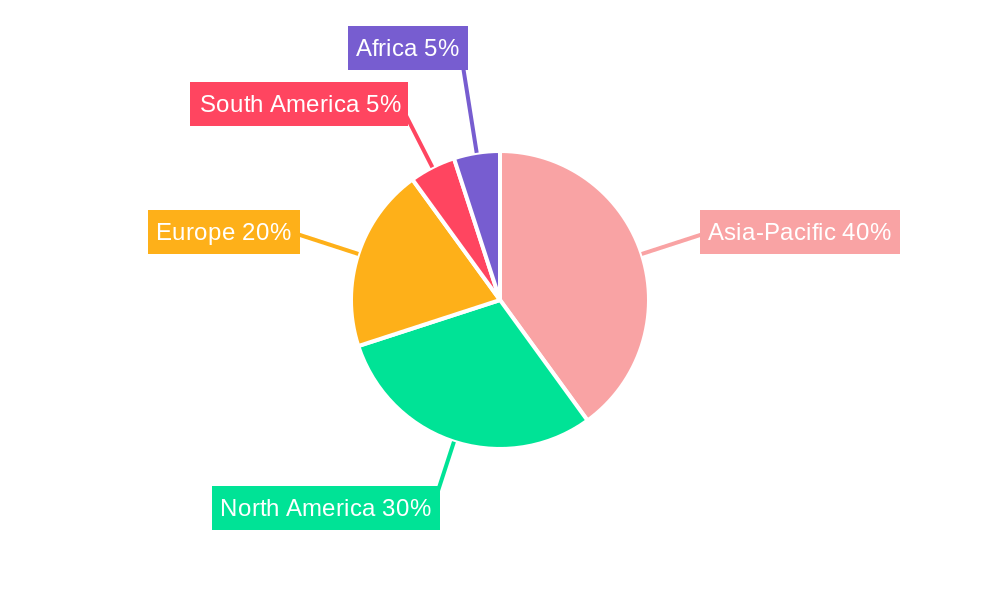
Adventure Tourism Market Regional Insights
- North America: The North America adventure tourism market is the largest in the world, accounting for 35% of the global market in 2023. The US is the largest market in North America, followed by Canada.
- Europe: The Europe adventure tourism market is the second largest in the world, accounting for 30% of the global market in 2023. The UK is the largest market in Europe, followed by Germany and France.
- Asia Pacific: The Asia Pacific adventure tourism market is the fastest growing in the world, with a CAGR of 16.2% from 2023 to 2031. China is the largest market in Asia Pacific, followed by India and Japan.
Driving Forces: What's Propelling the Adventure Tourism Market
The adventure tourism market is driven by a number of factors, including:
- Increased disposable income: People have more money to spend on travel and leisure activities, and adventure tourism offers an exciting and memorable experience.
- Growing awareness of healthy living: Adventure tourism promotes healthy living and active lifestyles, which is appealing to a growing number of people.
- Technological advancements: The development of new technologies, such as online booking platforms and GPS tracking devices, has made it easier for people to plan and book adventure trips.
Challenges and Restraints in Adventure Tourism Market
The adventure tourism market faces a number of challenges and restraints, including:
- Safety concerns: Adventure tourism activities can be dangerous, and safety concerns can deter some people from participating.
- Environmental concerns: Adventure tourism can have a negative impact on the environment, and environmental concerns can deter some people from participating.
- Cost: Adventure tourism trips can be expensive, and cost can deter some people from participating.
Emerging Trends in Adventure Tourism Market
Some of the emerging trends in the adventure tourism market include:
- Growing popularity of soft adventure tourism: Soft adventure tourism activities are less physically demanding than traditional adventure tourism activities, and they are appealing to a wider range of people.
- Increased demand for customized adventure trips: People are increasingly looking for adventure trips that are customized to their individual needs and interests.
- Growing use of technology in adventure tourism: Technology is being used to enhance the adventure tourism experience, such as through the use of GPS tracking devices and virtual reality.
Adventure Tourism Industry News
- In February 2024, The Dalma Wildlife Sanctuary plans to enrich its adventure tourism options by introducing a canopy walk, scheduled for debut by the month's end. This fresh attraction, showcasing a 15-feet-high bridge, seeks to offer visitors an exciting experience, linking two points within the sanctuary.
- In July 2023, Arabian Adventures launched ‘The Adventure Pass’, which offers bundles of either three or five experiences, with up to 40% savings compared to standard entry prices combined.
Leading Players in the Adventure Tourism Market
Some of the leading players in the adventure tourism market include:
- Austin Adventures, Inc.
- Butterfield & Robinson Inc.
- Desert Adventures
- Discovery Nomads
- G Adventures
- Arabian Adventures
- GetYourGuide
- Big Bus Tours
- Geographic Expeditions Inc.
- Intrepid Group, ltd.
Adventure Tourism Market Segmentation
- 1. Type
- 1.1. Hard
- 1.2. Soft
- 2. Age Group
- 2.1. 20-30 Years
- 2.2. 30-40 Years
- 2.3. 40-50 Years
- 2.4. Above 50
- 3. Packages
- 3.1. Low
- 3.2. Medium
- 3.3. Premium
- 4. Booking Mode
- 4.1. Travel Agent
- 4.2. Individuals
- 4.3. Event Planners
Adventure Tourism Market Segmentation By Geography
- 1. North America
- 1.1. U.S.
- 1.2. Canada
- 2. Europe
- 2.1. UK
- 2.2. Germany
- 2.3. France
- 2.4. Italy
- 2.5. Spain
- 2.6. Russia
- 2.7. Nordics
- 2.8. Rest of Europe
- 3. Asia Pacific
- 3.1. China
- 3.2. India
- 3.3. Japan
- 3.4. South Korea
- 3.5. ANZ
- 3.6. Southeast Asia
- 3.7. Rest of Asia Pacific
- 4. Latin America
- 4.1. Brazil
- 4.2. Mexico
- 4.3. Argentina
- 4.4. Rest of Latin America
- 5. MEA
- 5.1. South Africa
- 5.2. UAE
- 5.3. Saudi Arabia
- 5.4. Rest of MEA
Adventure Tourism Market REPORT HIGHLIGHTS
| Aspects | Details |
|---|---|
| Study Period | 2019-2033 |
| Base Year | 2024 |
| Estimated Year | 2025 |
| Forecast Period | 2025-2033 |
| Historical Period | 2019-2024 |
| Growth Rate | CAGR of 15.2% from 2019-2033 |
| Segmentation |
|
- 1. Introduction
- 1.1. Research Scope
- 1.2. Market Segmentation
- 1.3. Research Methodology
- 1.4. Definitions and Assumptions
- 2. Executive Summary
- 2.1. Introduction
- 3. Market Dynamics
- 3.1. Introduction
- 3.2. Market Drivers
- 3.2.1 Increasing investments in tourism industry in Asia Pacific
- 3.2.2 Rising international tourist arrivals in UAE
- 3.2.3 Rising foreign direct investment in Saudi Arabia
- 3.2.4 Increasing sky adventure activities
- 3.3. Market Restrains
- 3.3.1 Stringent regulations and permitting requirements
- 3.3.2 Extreme weather conditions
- 3.4. Market Trends
- 4. Market Factor Analysis
- 4.1. Porters Five Forces
- 4.2. Supply/Value Chain
- 4.3. PESTEL analysis
- 4.4. Market Entropy
- 4.5. Patent/Trademark Analysis
- 5. Global Adventure Tourism Market Analysis, Insights and Forecast, 2019-2031
- 5.1. Market Analysis, Insights and Forecast - by Type
- 5.1.1. Hard
- 5.1.2. Soft
- 5.2. Market Analysis, Insights and Forecast - by Age Group
- 5.2.1. 20-30 Years
- 5.2.2. 30-40 Years
- 5.2.3. 40-50 Years
- 5.2.4. Above 50
- 5.3. Market Analysis, Insights and Forecast - by Packages
- 5.3.1. Low
- 5.3.2. Medium
- 5.3.3. Premium
- 5.4. Market Analysis, Insights and Forecast - by Booking Mode
- 5.4.1. Travel Agent
- 5.4.2. Individuals
- 5.4.3. Event Planners
- 5.5. Market Analysis, Insights and Forecast - by Region
- 5.5.1. North America
- 5.5.2. Europe
- 5.5.3. Asia Pacific
- 5.5.4. Latin America
- 5.5.5. MEA
- 5.1. Market Analysis, Insights and Forecast - by Type
- 6. North America Adventure Tourism Market Analysis, Insights and Forecast, 2019-2031
- 6.1. Market Analysis, Insights and Forecast - by Type
- 6.1.1. Hard
- 6.1.2. Soft
- 6.2. Market Analysis, Insights and Forecast - by Age Group
- 6.2.1. 20-30 Years
- 6.2.2. 30-40 Years
- 6.2.3. 40-50 Years
- 6.2.4. Above 50
- 6.3. Market Analysis, Insights and Forecast - by Packages
- 6.3.1. Low
- 6.3.2. Medium
- 6.3.3. Premium
- 6.4. Market Analysis, Insights and Forecast - by Booking Mode
- 6.4.1. Travel Agent
- 6.4.2. Individuals
- 6.4.3. Event Planners
- 6.1. Market Analysis, Insights and Forecast - by Type
- 7. Europe Adventure Tourism Market Analysis, Insights and Forecast, 2019-2031
- 7.1. Market Analysis, Insights and Forecast - by Type
- 7.1.1. Hard
- 7.1.2. Soft
- 7.2. Market Analysis, Insights and Forecast - by Age Group
- 7.2.1. 20-30 Years
- 7.2.2. 30-40 Years
- 7.2.3. 40-50 Years
- 7.2.4. Above 50
- 7.3. Market Analysis, Insights and Forecast - by Packages
- 7.3.1. Low
- 7.3.2. Medium
- 7.3.3. Premium
- 7.4. Market Analysis, Insights and Forecast - by Booking Mode
- 7.4.1. Travel Agent
- 7.4.2. Individuals
- 7.4.3. Event Planners
- 7.1. Market Analysis, Insights and Forecast - by Type
- 8. Asia Pacific Adventure Tourism Market Analysis, Insights and Forecast, 2019-2031
- 8.1. Market Analysis, Insights and Forecast - by Type
- 8.1.1. Hard
- 8.1.2. Soft
- 8.2. Market Analysis, Insights and Forecast - by Age Group
- 8.2.1. 20-30 Years
- 8.2.2. 30-40 Years
- 8.2.3. 40-50 Years
- 8.2.4. Above 50
- 8.3. Market Analysis, Insights and Forecast - by Packages
- 8.3.1. Low
- 8.3.2. Medium
- 8.3.3. Premium
- 8.4. Market Analysis, Insights and Forecast - by Booking Mode
- 8.4.1. Travel Agent
- 8.4.2. Individuals
- 8.4.3. Event Planners
- 8.1. Market Analysis, Insights and Forecast - by Type
- 9. Latin America Adventure Tourism Market Analysis, Insights and Forecast, 2019-2031
- 9.1. Market Analysis, Insights and Forecast - by Type
- 9.1.1. Hard
- 9.1.2. Soft
- 9.2. Market Analysis, Insights and Forecast - by Age Group
- 9.2.1. 20-30 Years
- 9.2.2. 30-40 Years
- 9.2.3. 40-50 Years
- 9.2.4. Above 50
- 9.3. Market Analysis, Insights and Forecast - by Packages
- 9.3.1. Low
- 9.3.2. Medium
- 9.3.3. Premium
- 9.4. Market Analysis, Insights and Forecast - by Booking Mode
- 9.4.1. Travel Agent
- 9.4.2. Individuals
- 9.4.3. Event Planners
- 9.1. Market Analysis, Insights and Forecast - by Type
- 10. MEA Adventure Tourism Market Analysis, Insights and Forecast, 2019-2031
- 10.1. Market Analysis, Insights and Forecast - by Type
- 10.1.1. Hard
- 10.1.2. Soft
- 10.2. Market Analysis, Insights and Forecast - by Age Group
- 10.2.1. 20-30 Years
- 10.2.2. 30-40 Years
- 10.2.3. 40-50 Years
- 10.2.4. Above 50
- 10.3. Market Analysis, Insights and Forecast - by Packages
- 10.3.1. Low
- 10.3.2. Medium
- 10.3.3. Premium
- 10.4. Market Analysis, Insights and Forecast - by Booking Mode
- 10.4.1. Travel Agent
- 10.4.2. Individuals
- 10.4.3. Event Planners
- 10.1. Market Analysis, Insights and Forecast - by Type
- 11. Competitive Analysis
- 11.1. Global Market Share Analysis 2024
- 11.2. Company Profiles
- 11.2.1 Austin Adventures Inc.
- 11.2.1.1. Overview
- 11.2.1.2. Products
- 11.2.1.3. SWOT Analysis
- 11.2.1.4. Recent Developments
- 11.2.1.5. Financials (Based on Availability)
- 11.2.2 Butterfield & Robinson Inc.
- 11.2.2.1. Overview
- 11.2.2.2. Products
- 11.2.2.3. SWOT Analysis
- 11.2.2.4. Recent Developments
- 11.2.2.5. Financials (Based on Availability)
- 11.2.3 Desert Adventures
- 11.2.3.1. Overview
- 11.2.3.2. Products
- 11.2.3.3. SWOT Analysis
- 11.2.3.4. Recent Developments
- 11.2.3.5. Financials (Based on Availability)
- 11.2.4 Discovery Nomads
- 11.2.4.1. Overview
- 11.2.4.2. Products
- 11.2.4.3. SWOT Analysis
- 11.2.4.4. Recent Developments
- 11.2.4.5. Financials (Based on Availability)
- 11.2.5 G Adventures
- 11.2.5.1. Overview
- 11.2.5.2. Products
- 11.2.5.3. SWOT Analysis
- 11.2.5.4. Recent Developments
- 11.2.5.5. Financials (Based on Availability)
- 11.2.6 Arabian Advetures
- 11.2.6.1. Overview
- 11.2.6.2. Products
- 11.2.6.3. SWOT Analysis
- 11.2.6.4. Recent Developments
- 11.2.6.5. Financials (Based on Availability)
- 11.2.7 Get you Guide
- 11.2.7.1. Overview
- 11.2.7.2. Products
- 11.2.7.3. SWOT Analysis
- 11.2.7.4. Recent Developments
- 11.2.7.5. Financials (Based on Availability)
- 11.2.8 Big Bus Tours
- 11.2.8.1. Overview
- 11.2.8.2. Products
- 11.2.8.3. SWOT Analysis
- 11.2.8.4. Recent Developments
- 11.2.8.5. Financials (Based on Availability)
- 11.2.9 Geographic Expeditions Inc.
- 11.2.9.1. Overview
- 11.2.9.2. Products
- 11.2.9.3. SWOT Analysis
- 11.2.9.4. Recent Developments
- 11.2.9.5. Financials (Based on Availability)
- 11.2.10 Intrepid Group ltd.
- 11.2.10.1. Overview
- 11.2.10.2. Products
- 11.2.10.3. SWOT Analysis
- 11.2.10.4. Recent Developments
- 11.2.10.5. Financials (Based on Availability)
- 11.2.1 Austin Adventures Inc.
- Figure 1: Global Adventure Tourism Market Revenue Breakdown (Billion, %) by Region 2024 & 2032
- Figure 2: Global Adventure Tourism Market Volume Breakdown (K Tons, %) by Region 2024 & 2032
- Figure 3: North America Adventure Tourism Market Revenue (Billion), by Type 2024 & 2032
- Figure 4: North America Adventure Tourism Market Volume (K Tons), by Type 2024 & 2032
- Figure 5: North America Adventure Tourism Market Revenue Share (%), by Type 2024 & 2032
- Figure 6: North America Adventure Tourism Market Volume Share (%), by Type 2024 & 2032
- Figure 7: North America Adventure Tourism Market Revenue (Billion), by Age Group 2024 & 2032
- Figure 8: North America Adventure Tourism Market Volume (K Tons), by Age Group 2024 & 2032
- Figure 9: North America Adventure Tourism Market Revenue Share (%), by Age Group 2024 & 2032
- Figure 10: North America Adventure Tourism Market Volume Share (%), by Age Group 2024 & 2032
- Figure 11: North America Adventure Tourism Market Revenue (Billion), by Packages 2024 & 2032
- Figure 12: North America Adventure Tourism Market Volume (K Tons), by Packages 2024 & 2032
- Figure 13: North America Adventure Tourism Market Revenue Share (%), by Packages 2024 & 2032
- Figure 14: North America Adventure Tourism Market Volume Share (%), by Packages 2024 & 2032
- Figure 15: North America Adventure Tourism Market Revenue (Billion), by Booking Mode 2024 & 2032
- Figure 16: North America Adventure Tourism Market Volume (K Tons), by Booking Mode 2024 & 2032
- Figure 17: North America Adventure Tourism Market Revenue Share (%), by Booking Mode 2024 & 2032
- Figure 18: North America Adventure Tourism Market Volume Share (%), by Booking Mode 2024 & 2032
- Figure 19: North America Adventure Tourism Market Revenue (Billion), by Country 2024 & 2032
- Figure 20: North America Adventure Tourism Market Volume (K Tons), by Country 2024 & 2032
- Figure 21: North America Adventure Tourism Market Revenue Share (%), by Country 2024 & 2032
- Figure 22: North America Adventure Tourism Market Volume Share (%), by Country 2024 & 2032
- Figure 23: Europe Adventure Tourism Market Revenue (Billion), by Type 2024 & 2032
- Figure 24: Europe Adventure Tourism Market Volume (K Tons), by Type 2024 & 2032
- Figure 25: Europe Adventure Tourism Market Revenue Share (%), by Type 2024 & 2032
- Figure 26: Europe Adventure Tourism Market Volume Share (%), by Type 2024 & 2032
- Figure 27: Europe Adventure Tourism Market Revenue (Billion), by Age Group 2024 & 2032
- Figure 28: Europe Adventure Tourism Market Volume (K Tons), by Age Group 2024 & 2032
- Figure 29: Europe Adventure Tourism Market Revenue Share (%), by Age Group 2024 & 2032
- Figure 30: Europe Adventure Tourism Market Volume Share (%), by Age Group 2024 & 2032
- Figure 31: Europe Adventure Tourism Market Revenue (Billion), by Packages 2024 & 2032
- Figure 32: Europe Adventure Tourism Market Volume (K Tons), by Packages 2024 & 2032
- Figure 33: Europe Adventure Tourism Market Revenue Share (%), by Packages 2024 & 2032
- Figure 34: Europe Adventure Tourism Market Volume Share (%), by Packages 2024 & 2032
- Figure 35: Europe Adventure Tourism Market Revenue (Billion), by Booking Mode 2024 & 2032
- Figure 36: Europe Adventure Tourism Market Volume (K Tons), by Booking Mode 2024 & 2032
- Figure 37: Europe Adventure Tourism Market Revenue Share (%), by Booking Mode 2024 & 2032
- Figure 38: Europe Adventure Tourism Market Volume Share (%), by Booking Mode 2024 & 2032
- Figure 39: Europe Adventure Tourism Market Revenue (Billion), by Country 2024 & 2032
- Figure 40: Europe Adventure Tourism Market Volume (K Tons), by Country 2024 & 2032
- Figure 41: Europe Adventure Tourism Market Revenue Share (%), by Country 2024 & 2032
- Figure 42: Europe Adventure Tourism Market Volume Share (%), by Country 2024 & 2032
- Figure 43: Asia Pacific Adventure Tourism Market Revenue (Billion), by Type 2024 & 2032
- Figure 44: Asia Pacific Adventure Tourism Market Volume (K Tons), by Type 2024 & 2032
- Figure 45: Asia Pacific Adventure Tourism Market Revenue Share (%), by Type 2024 & 2032
- Figure 46: Asia Pacific Adventure Tourism Market Volume Share (%), by Type 2024 & 2032
- Figure 47: Asia Pacific Adventure Tourism Market Revenue (Billion), by Age Group 2024 & 2032
- Figure 48: Asia Pacific Adventure Tourism Market Volume (K Tons), by Age Group 2024 & 2032
- Figure 49: Asia Pacific Adventure Tourism Market Revenue Share (%), by Age Group 2024 & 2032
- Figure 50: Asia Pacific Adventure Tourism Market Volume Share (%), by Age Group 2024 & 2032
- Figure 51: Asia Pacific Adventure Tourism Market Revenue (Billion), by Packages 2024 & 2032
- Figure 52: Asia Pacific Adventure Tourism Market Volume (K Tons), by Packages 2024 & 2032
- Figure 53: Asia Pacific Adventure Tourism Market Revenue Share (%), by Packages 2024 & 2032
- Figure 54: Asia Pacific Adventure Tourism Market Volume Share (%), by Packages 2024 & 2032
- Figure 55: Asia Pacific Adventure Tourism Market Revenue (Billion), by Booking Mode 2024 & 2032
- Figure 56: Asia Pacific Adventure Tourism Market Volume (K Tons), by Booking Mode 2024 & 2032
- Figure 57: Asia Pacific Adventure Tourism Market Revenue Share (%), by Booking Mode 2024 & 2032
- Figure 58: Asia Pacific Adventure Tourism Market Volume Share (%), by Booking Mode 2024 & 2032
- Figure 59: Asia Pacific Adventure Tourism Market Revenue (Billion), by Country 2024 & 2032
- Figure 60: Asia Pacific Adventure Tourism Market Volume (K Tons), by Country 2024 & 2032
- Figure 61: Asia Pacific Adventure Tourism Market Revenue Share (%), by Country 2024 & 2032
- Figure 62: Asia Pacific Adventure Tourism Market Volume Share (%), by Country 2024 & 2032
- Figure 63: Latin America Adventure Tourism Market Revenue (Billion), by Type 2024 & 2032
- Figure 64: Latin America Adventure Tourism Market Volume (K Tons), by Type 2024 & 2032
- Figure 65: Latin America Adventure Tourism Market Revenue Share (%), by Type 2024 & 2032
- Figure 66: Latin America Adventure Tourism Market Volume Share (%), by Type 2024 & 2032
- Figure 67: Latin America Adventure Tourism Market Revenue (Billion), by Age Group 2024 & 2032
- Figure 68: Latin America Adventure Tourism Market Volume (K Tons), by Age Group 2024 & 2032
- Figure 69: Latin America Adventure Tourism Market Revenue Share (%), by Age Group 2024 & 2032
- Figure 70: Latin America Adventure Tourism Market Volume Share (%), by Age Group 2024 & 2032
- Figure 71: Latin America Adventure Tourism Market Revenue (Billion), by Packages 2024 & 2032
- Figure 72: Latin America Adventure Tourism Market Volume (K Tons), by Packages 2024 & 2032
- Figure 73: Latin America Adventure Tourism Market Revenue Share (%), by Packages 2024 & 2032
- Figure 74: Latin America Adventure Tourism Market Volume Share (%), by Packages 2024 & 2032
- Figure 75: Latin America Adventure Tourism Market Revenue (Billion), by Booking Mode 2024 & 2032
- Figure 76: Latin America Adventure Tourism Market Volume (K Tons), by Booking Mode 2024 & 2032
- Figure 77: Latin America Adventure Tourism Market Revenue Share (%), by Booking Mode 2024 & 2032
- Figure 78: Latin America Adventure Tourism Market Volume Share (%), by Booking Mode 2024 & 2032
- Figure 79: Latin America Adventure Tourism Market Revenue (Billion), by Country 2024 & 2032
- Figure 80: Latin America Adventure Tourism Market Volume (K Tons), by Country 2024 & 2032
- Figure 81: Latin America Adventure Tourism Market Revenue Share (%), by Country 2024 & 2032
- Figure 82: Latin America Adventure Tourism Market Volume Share (%), by Country 2024 & 2032
- Figure 83: MEA Adventure Tourism Market Revenue (Billion), by Type 2024 & 2032
- Figure 84: MEA Adventure Tourism Market Volume (K Tons), by Type 2024 & 2032
- Figure 85: MEA Adventure Tourism Market Revenue Share (%), by Type 2024 & 2032
- Figure 86: MEA Adventure Tourism Market Volume Share (%), by Type 2024 & 2032
- Figure 87: MEA Adventure Tourism Market Revenue (Billion), by Age Group 2024 & 2032
- Figure 88: MEA Adventure Tourism Market Volume (K Tons), by Age Group 2024 & 2032
- Figure 89: MEA Adventure Tourism Market Revenue Share (%), by Age Group 2024 & 2032
- Figure 90: MEA Adventure Tourism Market Volume Share (%), by Age Group 2024 & 2032
- Figure 91: MEA Adventure Tourism Market Revenue (Billion), by Packages 2024 & 2032
- Figure 92: MEA Adventure Tourism Market Volume (K Tons), by Packages 2024 & 2032
- Figure 93: MEA Adventure Tourism Market Revenue Share (%), by Packages 2024 & 2032
- Figure 94: MEA Adventure Tourism Market Volume Share (%), by Packages 2024 & 2032
- Figure 95: MEA Adventure Tourism Market Revenue (Billion), by Booking Mode 2024 & 2032
- Figure 96: MEA Adventure Tourism Market Volume (K Tons), by Booking Mode 2024 & 2032
- Figure 97: MEA Adventure Tourism Market Revenue Share (%), by Booking Mode 2024 & 2032
- Figure 98: MEA Adventure Tourism Market Volume Share (%), by Booking Mode 2024 & 2032
- Figure 99: MEA Adventure Tourism Market Revenue (Billion), by Country 2024 & 2032
- Figure 100: MEA Adventure Tourism Market Volume (K Tons), by Country 2024 & 2032
- Figure 101: MEA Adventure Tourism Market Revenue Share (%), by Country 2024 & 2032
- Figure 102: MEA Adventure Tourism Market Volume Share (%), by Country 2024 & 2032
- Table 1: Global Adventure Tourism Market Revenue Billion Forecast, by Region 2019 & 2032
- Table 2: Global Adventure Tourism Market Volume K Tons Forecast, by Region 2019 & 2032
- Table 3: Global Adventure Tourism Market Revenue Billion Forecast, by Type 2019 & 2032
- Table 4: Global Adventure Tourism Market Volume K Tons Forecast, by Type 2019 & 2032
- Table 5: Global Adventure Tourism Market Revenue Billion Forecast, by Age Group 2019 & 2032
- Table 6: Global Adventure Tourism Market Volume K Tons Forecast, by Age Group 2019 & 2032
- Table 7: Global Adventure Tourism Market Revenue Billion Forecast, by Packages 2019 & 2032
- Table 8: Global Adventure Tourism Market Volume K Tons Forecast, by Packages 2019 & 2032
- Table 9: Global Adventure Tourism Market Revenue Billion Forecast, by Booking Mode 2019 & 2032
- Table 10: Global Adventure Tourism Market Volume K Tons Forecast, by Booking Mode 2019 & 2032
- Table 11: Global Adventure Tourism Market Revenue Billion Forecast, by Region 2019 & 2032
- Table 12: Global Adventure Tourism Market Volume K Tons Forecast, by Region 2019 & 2032
- Table 13: Global Adventure Tourism Market Revenue Billion Forecast, by Type 2019 & 2032
- Table 14: Global Adventure Tourism Market Volume K Tons Forecast, by Type 2019 & 2032
- Table 15: Global Adventure Tourism Market Revenue Billion Forecast, by Age Group 2019 & 2032
- Table 16: Global Adventure Tourism Market Volume K Tons Forecast, by Age Group 2019 & 2032
- Table 17: Global Adventure Tourism Market Revenue Billion Forecast, by Packages 2019 & 2032
- Table 18: Global Adventure Tourism Market Volume K Tons Forecast, by Packages 2019 & 2032
- Table 19: Global Adventure Tourism Market Revenue Billion Forecast, by Booking Mode 2019 & 2032
- Table 20: Global Adventure Tourism Market Volume K Tons Forecast, by Booking Mode 2019 & 2032
- Table 21: Global Adventure Tourism Market Revenue Billion Forecast, by Country 2019 & 2032
- Table 22: Global Adventure Tourism Market Volume K Tons Forecast, by Country 2019 & 2032
- Table 23: U.S. Adventure Tourism Market Revenue (Billion) Forecast, by Application 2019 & 2032
- Table 24: U.S. Adventure Tourism Market Volume (K Tons) Forecast, by Application 2019 & 2032
- Table 25: Canada Adventure Tourism Market Revenue (Billion) Forecast, by Application 2019 & 2032
- Table 26: Canada Adventure Tourism Market Volume (K Tons) Forecast, by Application 2019 & 2032
- Table 27: Global Adventure Tourism Market Revenue Billion Forecast, by Type 2019 & 2032
- Table 28: Global Adventure Tourism Market Volume K Tons Forecast, by Type 2019 & 2032
- Table 29: Global Adventure Tourism Market Revenue Billion Forecast, by Age Group 2019 & 2032
- Table 30: Global Adventure Tourism Market Volume K Tons Forecast, by Age Group 2019 & 2032
- Table 31: Global Adventure Tourism Market Revenue Billion Forecast, by Packages 2019 & 2032
- Table 32: Global Adventure Tourism Market Volume K Tons Forecast, by Packages 2019 & 2032
- Table 33: Global Adventure Tourism Market Revenue Billion Forecast, by Booking Mode 2019 & 2032
- Table 34: Global Adventure Tourism Market Volume K Tons Forecast, by Booking Mode 2019 & 2032
- Table 35: Global Adventure Tourism Market Revenue Billion Forecast, by Country 2019 & 2032
- Table 36: Global Adventure Tourism Market Volume K Tons Forecast, by Country 2019 & 2032
- Table 37: UK Adventure Tourism Market Revenue (Billion) Forecast, by Application 2019 & 2032
- Table 38: UK Adventure Tourism Market Volume (K Tons) Forecast, by Application 2019 & 2032
- Table 39: Germany Adventure Tourism Market Revenue (Billion) Forecast, by Application 2019 & 2032
- Table 40: Germany Adventure Tourism Market Volume (K Tons) Forecast, by Application 2019 & 2032
- Table 41: France Adventure Tourism Market Revenue (Billion) Forecast, by Application 2019 & 2032
- Table 42: France Adventure Tourism Market Volume (K Tons) Forecast, by Application 2019 & 2032
- Table 43: Italy Adventure Tourism Market Revenue (Billion) Forecast, by Application 2019 & 2032
- Table 44: Italy Adventure Tourism Market Volume (K Tons) Forecast, by Application 2019 & 2032
- Table 45: Spain Adventure Tourism Market Revenue (Billion) Forecast, by Application 2019 & 2032
- Table 46: Spain Adventure Tourism Market Volume (K Tons) Forecast, by Application 2019 & 2032
- Table 47: Russia Adventure Tourism Market Revenue (Billion) Forecast, by Application 2019 & 2032
- Table 48: Russia Adventure Tourism Market Volume (K Tons) Forecast, by Application 2019 & 2032
- Table 49: Nordics Adventure Tourism Market Revenue (Billion) Forecast, by Application 2019 & 2032
- Table 50: Nordics Adventure Tourism Market Volume (K Tons) Forecast, by Application 2019 & 2032
- Table 51: Rest of Europe Adventure Tourism Market Revenue (Billion) Forecast, by Application 2019 & 2032
- Table 52: Rest of Europe Adventure Tourism Market Volume (K Tons) Forecast, by Application 2019 & 2032
- Table 53: Global Adventure Tourism Market Revenue Billion Forecast, by Type 2019 & 2032
- Table 54: Global Adventure Tourism Market Volume K Tons Forecast, by Type 2019 & 2032
- Table 55: Global Adventure Tourism Market Revenue Billion Forecast, by Age Group 2019 & 2032
- Table 56: Global Adventure Tourism Market Volume K Tons Forecast, by Age Group 2019 & 2032
- Table 57: Global Adventure Tourism Market Revenue Billion Forecast, by Packages 2019 & 2032
- Table 58: Global Adventure Tourism Market Volume K Tons Forecast, by Packages 2019 & 2032
- Table 59: Global Adventure Tourism Market Revenue Billion Forecast, by Booking Mode 2019 & 2032
- Table 60: Global Adventure Tourism Market Volume K Tons Forecast, by Booking Mode 2019 & 2032
- Table 61: Global Adventure Tourism Market Revenue Billion Forecast, by Country 2019 & 2032
- Table 62: Global Adventure Tourism Market Volume K Tons Forecast, by Country 2019 & 2032
- Table 63: China Adventure Tourism Market Revenue (Billion) Forecast, by Application 2019 & 2032
- Table 64: China Adventure Tourism Market Volume (K Tons) Forecast, by Application 2019 & 2032
- Table 65: India Adventure Tourism Market Revenue (Billion) Forecast, by Application 2019 & 2032
- Table 66: India Adventure Tourism Market Volume (K Tons) Forecast, by Application 2019 & 2032
- Table 67: Japan Adventure Tourism Market Revenue (Billion) Forecast, by Application 2019 & 2032
- Table 68: Japan Adventure Tourism Market Volume (K Tons) Forecast, by Application 2019 & 2032
- Table 69: South Korea Adventure Tourism Market Revenue (Billion) Forecast, by Application 2019 & 2032
- Table 70: South Korea Adventure Tourism Market Volume (K Tons) Forecast, by Application 2019 & 2032
- Table 71: ANZ Adventure Tourism Market Revenue (Billion) Forecast, by Application 2019 & 2032
- Table 72: ANZ Adventure Tourism Market Volume (K Tons) Forecast, by Application 2019 & 2032
- Table 73: Southeast Asia Adventure Tourism Market Revenue (Billion) Forecast, by Application 2019 & 2032
- Table 74: Southeast Asia Adventure Tourism Market Volume (K Tons) Forecast, by Application 2019 & 2032
- Table 75: Rest of Asia Pacific Adventure Tourism Market Revenue (Billion) Forecast, by Application 2019 & 2032
- Table 76: Rest of Asia Pacific Adventure Tourism Market Volume (K Tons) Forecast, by Application 2019 & 2032
- Table 77: Global Adventure Tourism Market Revenue Billion Forecast, by Type 2019 & 2032
- Table 78: Global Adventure Tourism Market Volume K Tons Forecast, by Type 2019 & 2032
- Table 79: Global Adventure Tourism Market Revenue Billion Forecast, by Age Group 2019 & 2032
- Table 80: Global Adventure Tourism Market Volume K Tons Forecast, by Age Group 2019 & 2032
- Table 81: Global Adventure Tourism Market Revenue Billion Forecast, by Packages 2019 & 2032
- Table 82: Global Adventure Tourism Market Volume K Tons Forecast, by Packages 2019 & 2032
- Table 83: Global Adventure Tourism Market Revenue Billion Forecast, by Booking Mode 2019 & 2032
- Table 84: Global Adventure Tourism Market Volume K Tons Forecast, by Booking Mode 2019 & 2032
- Table 85: Global Adventure Tourism Market Revenue Billion Forecast, by Country 2019 & 2032
- Table 86: Global Adventure Tourism Market Volume K Tons Forecast, by Country 2019 & 2032
- Table 87: Brazil Adventure Tourism Market Revenue (Billion) Forecast, by Application 2019 & 2032
- Table 88: Brazil Adventure Tourism Market Volume (K Tons) Forecast, by Application 2019 & 2032
- Table 89: Mexico Adventure Tourism Market Revenue (Billion) Forecast, by Application 2019 & 2032
- Table 90: Mexico Adventure Tourism Market Volume (K Tons) Forecast, by Application 2019 & 2032
- Table 91: Argentina Adventure Tourism Market Revenue (Billion) Forecast, by Application 2019 & 2032
- Table 92: Argentina Adventure Tourism Market Volume (K Tons) Forecast, by Application 2019 & 2032
- Table 93: Rest of Latin America Adventure Tourism Market Revenue (Billion) Forecast, by Application 2019 & 2032
- Table 94: Rest of Latin America Adventure Tourism Market Volume (K Tons) Forecast, by Application 2019 & 2032
- Table 95: Global Adventure Tourism Market Revenue Billion Forecast, by Type 2019 & 2032
- Table 96: Global Adventure Tourism Market Volume K Tons Forecast, by Type 2019 & 2032
- Table 97: Global Adventure Tourism Market Revenue Billion Forecast, by Age Group 2019 & 2032
- Table 98: Global Adventure Tourism Market Volume K Tons Forecast, by Age Group 2019 & 2032
- Table 99: Global Adventure Tourism Market Revenue Billion Forecast, by Packages 2019 & 2032
- Table 100: Global Adventure Tourism Market Volume K Tons Forecast, by Packages 2019 & 2032
- Table 101: Global Adventure Tourism Market Revenue Billion Forecast, by Booking Mode 2019 & 2032
- Table 102: Global Adventure Tourism Market Volume K Tons Forecast, by Booking Mode 2019 & 2032
- Table 103: Global Adventure Tourism Market Revenue Billion Forecast, by Country 2019 & 2032
- Table 104: Global Adventure Tourism Market Volume K Tons Forecast, by Country 2019 & 2032
- Table 105: South Africa Adventure Tourism Market Revenue (Billion) Forecast, by Application 2019 & 2032
- Table 106: South Africa Adventure Tourism Market Volume (K Tons) Forecast, by Application 2019 & 2032
- Table 107: UAE Adventure Tourism Market Revenue (Billion) Forecast, by Application 2019 & 2032
- Table 108: UAE Adventure Tourism Market Volume (K Tons) Forecast, by Application 2019 & 2032
- Table 109: Saudi Arabia Adventure Tourism Market Revenue (Billion) Forecast, by Application 2019 & 2032
- Table 110: Saudi Arabia Adventure Tourism Market Volume (K Tons) Forecast, by Application 2019 & 2032
- Table 111: Rest of MEA Adventure Tourism Market Revenue (Billion) Forecast, by Application 2019 & 2032
- Table 112: Rest of MEA Adventure Tourism Market Volume (K Tons) Forecast, by Application 2019 & 2032
STEP 1 - Identification of Relevant Samples Size from Population Database


STEP 2 - Approaches for Defining Global Market Size (Value, Volume* & Price*)

Note* : In applicable scenarios
STEP 3 - Data Sources
Primary Research
- Web Analytics
- Survey Reports
- Research Institute
- Latest Research Reports
- Opinion Leaders
Secondary Research
- Annual Reports
- White Paper
- Latest Press Release
- Industry Association
- Paid Database
- Investor Presentations

STEP 4 - Data Triangulation
Involves using different sources of information in order to increase the validity of a study
These sources are likely to be stakeholders in a program - participants, other researchers, program staff, other community members, and so on.
Then we put all data in single framework & apply various statistical tools to find out the dynamic on the market.
During the analysis stage, feedback from the stakeholder groups would be compared to determine areas of agreement as well as areas of divergence
Frequently Asked Questions
Related Reports
See the similar reports


About Market Insights Report
Market Insights Reports offers comprehensive market research reports and analysis, giving businesses important information about their clients, rivals, and sector to help them make well-informed decisions on operations, marketing, and business strategy. We offer a variety of services in addition to market research, data analysis, and strategy planning. In order to find opportunities and learn more about our competitors and the industry at large, we employ competitive analysis. To identify areas for development, we also evaluate our performance against that of our rivals. We can determine the places at which we can offer our clients the most value by performing value chain analysis.
Additionally, clients receive a thorough overview of their industry business environment. We can find trends that help us forecast future possibilities and threats by examining global macroeconomic dynamics and consumer behavior patterns. By analyzing their features and advantages, contrasting them with comparable items on the market, and evaluating both their quantitative and qualitative performance, we comprehensively evaluate our clients' products. This allows us to assist customers in determining how their goods compare to those of their rivals and in creating successful marketing plans. Our group has been successful in gaining a thorough grasp of our clients' requirements and offering them creative solutions. We currently provide services to more than 50 nations in Europe, the Middle East, Africa, Latin America, Asia Pacific, and North America. Because of our global reach, we have been able to establish trusting bonds with our partners and clients in various nations, improving customer service and forging a more cohesive worldwide presence.