
.jpg&w=3840&q=100)
Market
Insights
Reports delivered globally, covering a wide range of industries and sectors.
Clients who trust our expertise and rely on our insights for business decisions.
Managed Reports, ensuring seamless updates and premium service.
Satisfied Customers, committed to delivering exceptional value and quality.
Destination Management Service Market 2025-2033 Market Analysis: Trends, Dynamics, and Growth Opportunities
Destination Management Service Market by Service (Event Management, Accommodation Booking, Transportation & Logistics), by Application (Corporate Travel, Leisure, Adventure Tourism), by End-user (Individuals, Travel Agencies, Event Planners), by North America (U.S., Canada), by Europe (UK, Germany, France, Russia, Italy, Spain, Nordics, Rest of Europe), by Asia Pacific (China, India, Japan, South Korea, ANZ, Southeast Asia, Rest of Asia Pacific), by Latin America (Brazil, Mexico, Argentina, Rest of Latin America), by MEA (UAE, South Africa, Saudi Arabia, Rest of MEA) Forecast 2025-2033
Destination Management Service Market 2025-2033 Market Analysis: Trends, Dynamics, and Growth Opportunities
Key Insights
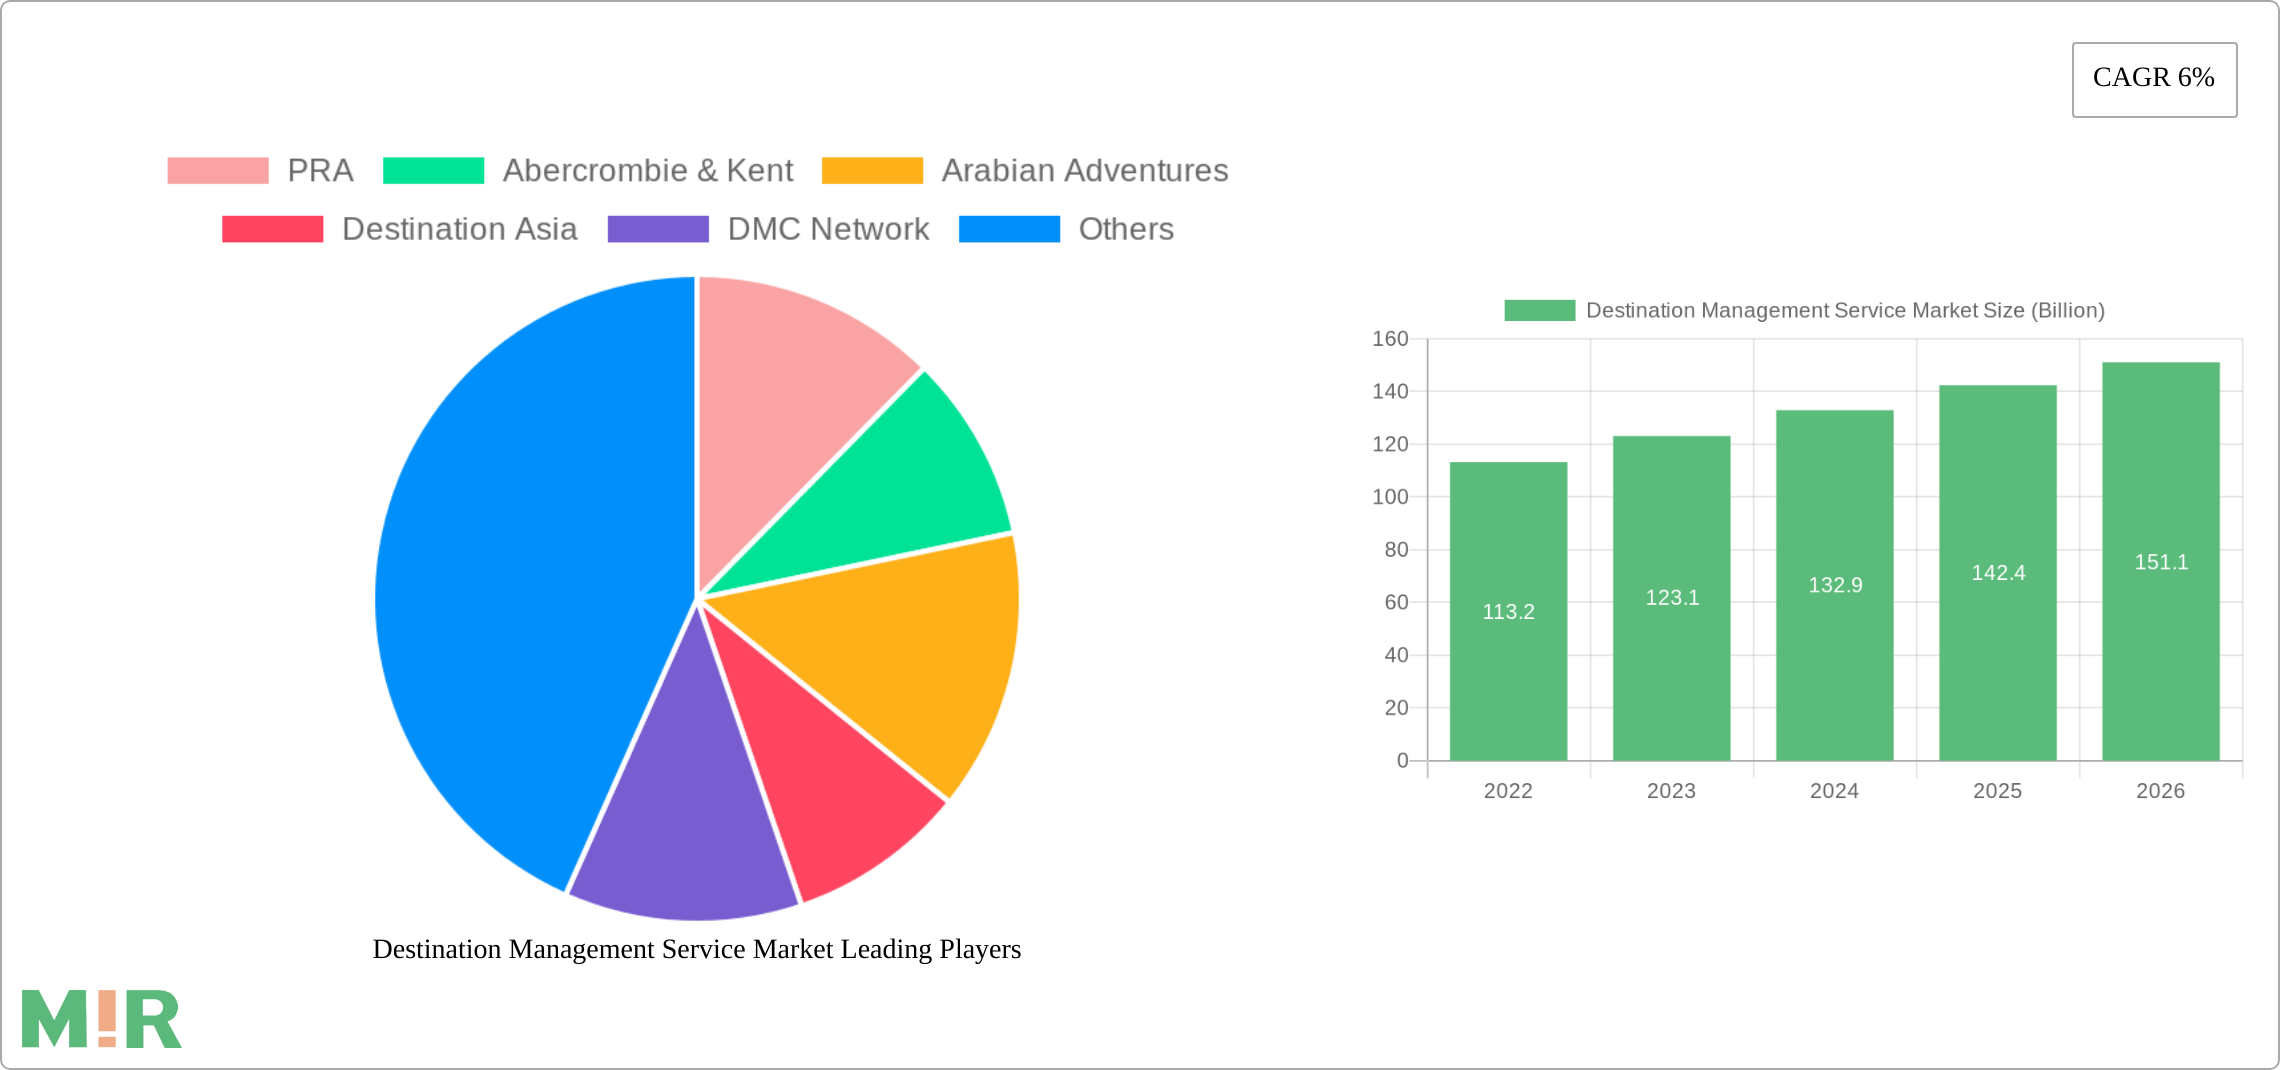
The size of the Destination Management Service Market was valued at USD 8.5 Billion in 2024 and is projected to reach USD 12.78 Billion by 2033, with an expected CAGR of 6% during the forecast period. The Destination Management Service (DMS) Market is centered on offering various services that assist in the planning, coordination, and administration of travel experiences for tourists and visitors to designated locations. These offerings encompass itinerary creation, travel logistics, guided excursions, lodging reservations, event coordination, and personalized local experiences designed for both leisure and corporate travelers. DMS providers collaborate with local suppliers, companies, and service providers to guarantee smooth, high-quality experiences for travelers. The market is influenced by expanding international travel, an increasing desire for tailored and immersive travel experiences, and the rising trend of sustainable tourism. As travelers look for more tailored, genuine, and unforgettable experiences, the importance of destination management services grows in facilitating seamless, pleasurable travel adventures. Furthermore, improvements in digital tools and platforms are increasing service providers' capability to deliver real-time information, flexible booking options, and personalized recommendations. The Destination Management Service Market is projected to expand considerably, particularly due to the surge in experiential travel, greater emphasis on local and cultural experiences, and the rising demand.
Destination Management Service Market Concentration & Characteristics
The destination management service market is fragmented with a large number of key players operating at the regional and local levels. However, several large-scale corporations dominate the market at the global level. The industry is characterized by a high level of innovation and ongoing advancements in technology. End users, such as individuals, travel agencies, and event planners, are highly fragmented, leading to intense competition among service providers. Merger and acquisition (M&A) activity is also prevalent in the market, as companies seek to expand their global reach and diversify their service offerings.
Destination Management Service Market Trends
- Personalized Experiences: The increasing demand for tailored and immersive travel experiences is fueling the growth of the market. Destination management companies are offering highly customized services to cater to the unique needs and preferences of individual travelers.
- Technological Advancements: The integration of advanced technologies, such as artificial intelligence (AI), big data analytics, and virtual reality (VR), is transforming the destination management industry. These technologies enhance operational efficiency, improve customer engagement, and provide real-time insights into traveler preferences.
- Sustainable Tourism: The growing awareness of environmental sustainability is driving the demand for eco-friendly destination management services. Providers are implementing sustainable practices to reduce their carbon footprint and promote responsible tourism.

Key Region or Country & Segment to Dominate the Market
Dominant Region: North America is the largest market for destination management services, followed by Europe and Asia Pacific. The region's well-developed tourism infrastructure, high disposable income, and strong business travel demand are contributing factors to its dominance.
Dominant Service Segment: Event management is the largest service segment in the destination management market. The increasing number of corporate events, conferences, and incentive travel programs is driving the growth of this segment.
Dominant Application Segment: Corporate travel is the largest application segment, accounting for over 50% of the market revenue. The growing trend of global business collaborations and the increasing need for seamless travel arrangements are contributing to the dominance of this segment.
Driving Forces: What's Propelling the Destination Management Service Market
- Rising disposable income and increasing demand for luxury travel experiences
- Growing popularity of off-the-beaten-path destinations and cultural immersion
- Proliferation of online travel agencies (OTAs) and digital travel platforms
- Government initiatives to promote tourism and invest in tourism infrastructure
Challenges and Restraints in Destination Management Service Market
- Currency fluctuations and economic uncertainties
- Intense competition and price sensitivity
- Lack of regulation and standardization
- Security concerns and geopolitical instability
Emerging Trends in Destination Management Service Market
- Immersive Experiences: Destination management companies are offering unique and immersive experiences, such as culinary tours, local community engagement programs, and behind-the-scenes access to cultural attractions.
- Data-Driven Personalization: Leveraging artificial intelligence and big data analytics, providers are tailoring services to each traveler's preferences, interests, and budget.
- Omni-Channel Presence: Companies are expanding their digital presence through various channels, such as websites, social media platforms, and online booking systems, to reach a wider customer base.
Leading Players in the Destination Management Service Market
- PRA
- Abercrombie & Kent
- Arabian Adventures
- Destination Asia
- DMC Network
- Euromic
- Global DMC
- Insight Vacations
- Ovation Global DMC
- RMC
Destination Management Service Market Segmentation
- 1. Service
- 1.1. Event Management
- 1.2. Accommodation Booking
- 1.3. Transportation & Logistics
- 2. Application
- 2.1. Corporate Travel
- 2.2. Leisure
- 2.3. Adventure Tourism
- 3. End-user
- 3.1. Individuals
- 3.1.1. Event Management
- 3.1.2. Accommodation Booking
- 3.1.3. Transportation & Logistics
- 3.2. Travel Agencies
- 3.2.1. Event Management
- 3.2.2. Accommodation Booking
- 3.2.3. Transportation & Logistics
- 3.3. Event Planners
- 3.3.1. Event Management
- 3.3.2. Accommodation Booking
- 3.3.3. Transportation & Logistics
- 3.1. Individuals
Destination Management Service Market Segmentation By Geography
- 1. North America
- 1.1. U.S.
- 1.2. Canada
- 2. Europe
- 2.1. UK
- 2.2. Germany
- 2.3. France
- 2.4. Russia
- 2.5. Italy
- 2.6. Spain
- 2.7. Nordics
- 2.8. Rest of Europe
- 3. Asia Pacific
- 3.1. China
- 3.2. India
- 3.3. Japan
- 3.4. South Korea
- 3.5. ANZ
- 3.6. Southeast Asia
- 3.7. Rest of Asia Pacific
- 4. Latin America
- 4.1. Brazil
- 4.2. Mexico
- 4.3. Argentina
- 4.4. Rest of Latin America
- 5. MEA
- 5.1. UAE
- 5.2. South Africa
- 5.3. Saudi Arabia
- 5.4. Rest of MEA

Destination Management Service Market REPORT HIGHLIGHTS
| Aspects | Details |
|---|---|
| Study Period | 2019-2033 |
| Base Year | 2024 |
| Estimated Year | 2025 |
| Forecast Period | 2025-2033 |
| Historical Period | 2019-2024 |
| Growth Rate | CAGR of 6% from 2019-2033 |
| Segmentation |
|
- 1. Introduction
- 1.1. Research Scope
- 1.2. Market Segmentation
- 1.3. Research Methodology
- 1.4. Definitions and Assumptions
- 2. Executive Summary
- 2.1. Introduction
- 3. Market Dynamics
- 3.1. Introduction
- 3.2. Market Drivers
- 3.2.1 Increasing global tourism demand
- 3.2.2 Supportive government policies and investments in infrastructure development
- 3.2.3 Growing awareness of environmental sustainability and responsible tourism practices
- 3.2.4 Rising popularity for soft tourism
- 3.3. Market Restrains
- 3.3.1 Intense competition among destination management companies
- 3.3.2 Compliance with complex and evolving regulations
- 3.4. Market Trends
- 4. Market Factor Analysis
- 4.1. Porters Five Forces
- 4.2. Supply/Value Chain
- 4.3. PESTEL analysis
- 4.4. Market Entropy
- 4.5. Patent/Trademark Analysis
- 5. Global Destination Management Service Market Analysis, Insights and Forecast, 2019-2031
- 5.1. Market Analysis, Insights and Forecast - by Service
- 5.1.1. Event Management
- 5.1.2. Accommodation Booking
- 5.1.3. Transportation & Logistics
- 5.2. Market Analysis, Insights and Forecast - by Application
- 5.2.1. Corporate Travel
- 5.2.2. Leisure
- 5.2.3. Adventure Tourism
- 5.3. Market Analysis, Insights and Forecast - by End-user
- 5.3.1. Individuals
- 5.3.1.1. Event Management
- 5.3.1.2. Accommodation Booking
- 5.3.1.3. Transportation & Logistics
- 5.3.2. Travel Agencies
- 5.3.2.1. Event Management
- 5.3.2.2. Accommodation Booking
- 5.3.2.3. Transportation & Logistics
- 5.3.3. Event Planners
- 5.3.3.1. Event Management
- 5.3.3.2. Accommodation Booking
- 5.3.3.3. Transportation & Logistics
- 5.3.1. Individuals
- 5.4. Market Analysis, Insights and Forecast - by Region
- 5.4.1. North America
- 5.4.2. Europe
- 5.4.3. Asia Pacific
- 5.4.4. Latin America
- 5.4.5. MEA
- 5.1. Market Analysis, Insights and Forecast - by Service
- 6. North America Destination Management Service Market Analysis, Insights and Forecast, 2019-2031
- 6.1. Market Analysis, Insights and Forecast - by Service
- 6.1.1. Event Management
- 6.1.2. Accommodation Booking
- 6.1.3. Transportation & Logistics
- 6.2. Market Analysis, Insights and Forecast - by Application
- 6.2.1. Corporate Travel
- 6.2.2. Leisure
- 6.2.3. Adventure Tourism
- 6.3. Market Analysis, Insights and Forecast - by End-user
- 6.3.1. Individuals
- 6.3.1.1. Event Management
- 6.3.1.2. Accommodation Booking
- 6.3.1.3. Transportation & Logistics
- 6.3.2. Travel Agencies
- 6.3.2.1. Event Management
- 6.3.2.2. Accommodation Booking
- 6.3.2.3. Transportation & Logistics
- 6.3.3. Event Planners
- 6.3.3.1. Event Management
- 6.3.3.2. Accommodation Booking
- 6.3.3.3. Transportation & Logistics
- 6.3.1. Individuals
- 6.1. Market Analysis, Insights and Forecast - by Service
- 7. Europe Destination Management Service Market Analysis, Insights and Forecast, 2019-2031
- 7.1. Market Analysis, Insights and Forecast - by Service
- 7.1.1. Event Management
- 7.1.2. Accommodation Booking
- 7.1.3. Transportation & Logistics
- 7.2. Market Analysis, Insights and Forecast - by Application
- 7.2.1. Corporate Travel
- 7.2.2. Leisure
- 7.2.3. Adventure Tourism
- 7.3. Market Analysis, Insights and Forecast - by End-user
- 7.3.1. Individuals
- 7.3.1.1. Event Management
- 7.3.1.2. Accommodation Booking
- 7.3.1.3. Transportation & Logistics
- 7.3.2. Travel Agencies
- 7.3.2.1. Event Management
- 7.3.2.2. Accommodation Booking
- 7.3.2.3. Transportation & Logistics
- 7.3.3. Event Planners
- 7.3.3.1. Event Management
- 7.3.3.2. Accommodation Booking
- 7.3.3.3. Transportation & Logistics
- 7.3.1. Individuals
- 7.1. Market Analysis, Insights and Forecast - by Service
- 8. Asia Pacific Destination Management Service Market Analysis, Insights and Forecast, 2019-2031
- 8.1. Market Analysis, Insights and Forecast - by Service
- 8.1.1. Event Management
- 8.1.2. Accommodation Booking
- 8.1.3. Transportation & Logistics
- 8.2. Market Analysis, Insights and Forecast - by Application
- 8.2.1. Corporate Travel
- 8.2.2. Leisure
- 8.2.3. Adventure Tourism
- 8.3. Market Analysis, Insights and Forecast - by End-user
- 8.3.1. Individuals
- 8.3.1.1. Event Management
- 8.3.1.2. Accommodation Booking
- 8.3.1.3. Transportation & Logistics
- 8.3.2. Travel Agencies
- 8.3.2.1. Event Management
- 8.3.2.2. Accommodation Booking
- 8.3.2.3. Transportation & Logistics
- 8.3.3. Event Planners
- 8.3.3.1. Event Management
- 8.3.3.2. Accommodation Booking
- 8.3.3.3. Transportation & Logistics
- 8.3.1. Individuals
- 8.1. Market Analysis, Insights and Forecast - by Service
- 9. Latin America Destination Management Service Market Analysis, Insights and Forecast, 2019-2031
- 9.1. Market Analysis, Insights and Forecast - by Service
- 9.1.1. Event Management
- 9.1.2. Accommodation Booking
- 9.1.3. Transportation & Logistics
- 9.2. Market Analysis, Insights and Forecast - by Application
- 9.2.1. Corporate Travel
- 9.2.2. Leisure
- 9.2.3. Adventure Tourism
- 9.3. Market Analysis, Insights and Forecast - by End-user
- 9.3.1. Individuals
- 9.3.1.1. Event Management
- 9.3.1.2. Accommodation Booking
- 9.3.1.3. Transportation & Logistics
- 9.3.2. Travel Agencies
- 9.3.2.1. Event Management
- 9.3.2.2. Accommodation Booking
- 9.3.2.3. Transportation & Logistics
- 9.3.3. Event Planners
- 9.3.3.1. Event Management
- 9.3.3.2. Accommodation Booking
- 9.3.3.3. Transportation & Logistics
- 9.3.1. Individuals
- 9.1. Market Analysis, Insights and Forecast - by Service
- 10. MEA Destination Management Service Market Analysis, Insights and Forecast, 2019-2031
- 10.1. Market Analysis, Insights and Forecast - by Service
- 10.1.1. Event Management
- 10.1.2. Accommodation Booking
- 10.1.3. Transportation & Logistics
- 10.2. Market Analysis, Insights and Forecast - by Application
- 10.2.1. Corporate Travel
- 10.2.2. Leisure
- 10.2.3. Adventure Tourism
- 10.3. Market Analysis, Insights and Forecast - by End-user
- 10.3.1. Individuals
- 10.3.1.1. Event Management
- 10.3.1.2. Accommodation Booking
- 10.3.1.3. Transportation & Logistics
- 10.3.2. Travel Agencies
- 10.3.2.1. Event Management
- 10.3.2.2. Accommodation Booking
- 10.3.2.3. Transportation & Logistics
- 10.3.3. Event Planners
- 10.3.3.1. Event Management
- 10.3.3.2. Accommodation Booking
- 10.3.3.3. Transportation & Logistics
- 10.3.1. Individuals
- 10.1. Market Analysis, Insights and Forecast - by Service
- 11. Competitive Analysis
- 11.1. Global Market Share Analysis 2024
- 11.2. Company Profiles
- 11.2.1 PRA
- 11.2.1.1. Overview
- 11.2.1.2. Products
- 11.2.1.3. SWOT Analysis
- 11.2.1.4. Recent Developments
- 11.2.1.5. Financials (Based on Availability)
- 11.2.2 Abercrombie & Kent
- 11.2.2.1. Overview
- 11.2.2.2. Products
- 11.2.2.3. SWOT Analysis
- 11.2.2.4. Recent Developments
- 11.2.2.5. Financials (Based on Availability)
- 11.2.3 Arabian Adventures
- 11.2.3.1. Overview
- 11.2.3.2. Products
- 11.2.3.3. SWOT Analysis
- 11.2.3.4. Recent Developments
- 11.2.3.5. Financials (Based on Availability)
- 11.2.4 Destination Asia
- 11.2.4.1. Overview
- 11.2.4.2. Products
- 11.2.4.3. SWOT Analysis
- 11.2.4.4. Recent Developments
- 11.2.4.5. Financials (Based on Availability)
- 11.2.5 DMC Network
- 11.2.5.1. Overview
- 11.2.5.2. Products
- 11.2.5.3. SWOT Analysis
- 11.2.5.4. Recent Developments
- 11.2.5.5. Financials (Based on Availability)
- 11.2.6 Euromic
- 11.2.6.1. Overview
- 11.2.6.2. Products
- 11.2.6.3. SWOT Analysis
- 11.2.6.4. Recent Developments
- 11.2.6.5. Financials (Based on Availability)
- 11.2.7 Global DMC
- 11.2.7.1. Overview
- 11.2.7.2. Products
- 11.2.7.3. SWOT Analysis
- 11.2.7.4. Recent Developments
- 11.2.7.5. Financials (Based on Availability)
- 11.2.8 Insight Vacations
- 11.2.8.1. Overview
- 11.2.8.2. Products
- 11.2.8.3. SWOT Analysis
- 11.2.8.4. Recent Developments
- 11.2.8.5. Financials (Based on Availability)
- 11.2.9 Ovation Global DMC
- 11.2.9.1. Overview
- 11.2.9.2. Products
- 11.2.9.3. SWOT Analysis
- 11.2.9.4. Recent Developments
- 11.2.9.5. Financials (Based on Availability)
- 11.2.10 RMC
- 11.2.10.1. Overview
- 11.2.10.2. Products
- 11.2.10.3. SWOT Analysis
- 11.2.10.4. Recent Developments
- 11.2.10.5. Financials (Based on Availability)
- 11.2.1 PRA
- Figure 1: Global Destination Management Service Market Revenue Breakdown (Billion, %) by Region 2024 & 2032
- Figure 2: Global Destination Management Service Market Volume Breakdown (K Tons, %) by Region 2024 & 2032
- Figure 3: North America Destination Management Service Market Revenue (Billion), by Service 2024 & 2032
- Figure 4: North America Destination Management Service Market Volume (K Tons), by Service 2024 & 2032
- Figure 5: North America Destination Management Service Market Revenue Share (%), by Service 2024 & 2032
- Figure 6: North America Destination Management Service Market Volume Share (%), by Service 2024 & 2032
- Figure 7: North America Destination Management Service Market Revenue (Billion), by Application 2024 & 2032
- Figure 8: North America Destination Management Service Market Volume (K Tons), by Application 2024 & 2032
- Figure 9: North America Destination Management Service Market Revenue Share (%), by Application 2024 & 2032
- Figure 10: North America Destination Management Service Market Volume Share (%), by Application 2024 & 2032
- Figure 11: North America Destination Management Service Market Revenue (Billion), by End-user 2024 & 2032
- Figure 12: North America Destination Management Service Market Volume (K Tons), by End-user 2024 & 2032
- Figure 13: North America Destination Management Service Market Revenue Share (%), by End-user 2024 & 2032
- Figure 14: North America Destination Management Service Market Volume Share (%), by End-user 2024 & 2032
- Figure 15: North America Destination Management Service Market Revenue (Billion), by Country 2024 & 2032
- Figure 16: North America Destination Management Service Market Volume (K Tons), by Country 2024 & 2032
- Figure 17: North America Destination Management Service Market Revenue Share (%), by Country 2024 & 2032
- Figure 18: North America Destination Management Service Market Volume Share (%), by Country 2024 & 2032
- Figure 19: Europe Destination Management Service Market Revenue (Billion), by Service 2024 & 2032
- Figure 20: Europe Destination Management Service Market Volume (K Tons), by Service 2024 & 2032
- Figure 21: Europe Destination Management Service Market Revenue Share (%), by Service 2024 & 2032
- Figure 22: Europe Destination Management Service Market Volume Share (%), by Service 2024 & 2032
- Figure 23: Europe Destination Management Service Market Revenue (Billion), by Application 2024 & 2032
- Figure 24: Europe Destination Management Service Market Volume (K Tons), by Application 2024 & 2032
- Figure 25: Europe Destination Management Service Market Revenue Share (%), by Application 2024 & 2032
- Figure 26: Europe Destination Management Service Market Volume Share (%), by Application 2024 & 2032
- Figure 27: Europe Destination Management Service Market Revenue (Billion), by End-user 2024 & 2032
- Figure 28: Europe Destination Management Service Market Volume (K Tons), by End-user 2024 & 2032
- Figure 29: Europe Destination Management Service Market Revenue Share (%), by End-user 2024 & 2032
- Figure 30: Europe Destination Management Service Market Volume Share (%), by End-user 2024 & 2032
- Figure 31: Europe Destination Management Service Market Revenue (Billion), by Country 2024 & 2032
- Figure 32: Europe Destination Management Service Market Volume (K Tons), by Country 2024 & 2032
- Figure 33: Europe Destination Management Service Market Revenue Share (%), by Country 2024 & 2032
- Figure 34: Europe Destination Management Service Market Volume Share (%), by Country 2024 & 2032
- Figure 35: Asia Pacific Destination Management Service Market Revenue (Billion), by Service 2024 & 2032
- Figure 36: Asia Pacific Destination Management Service Market Volume (K Tons), by Service 2024 & 2032
- Figure 37: Asia Pacific Destination Management Service Market Revenue Share (%), by Service 2024 & 2032
- Figure 38: Asia Pacific Destination Management Service Market Volume Share (%), by Service 2024 & 2032
- Figure 39: Asia Pacific Destination Management Service Market Revenue (Billion), by Application 2024 & 2032
- Figure 40: Asia Pacific Destination Management Service Market Volume (K Tons), by Application 2024 & 2032
- Figure 41: Asia Pacific Destination Management Service Market Revenue Share (%), by Application 2024 & 2032
- Figure 42: Asia Pacific Destination Management Service Market Volume Share (%), by Application 2024 & 2032
- Figure 43: Asia Pacific Destination Management Service Market Revenue (Billion), by End-user 2024 & 2032
- Figure 44: Asia Pacific Destination Management Service Market Volume (K Tons), by End-user 2024 & 2032
- Figure 45: Asia Pacific Destination Management Service Market Revenue Share (%), by End-user 2024 & 2032
- Figure 46: Asia Pacific Destination Management Service Market Volume Share (%), by End-user 2024 & 2032
- Figure 47: Asia Pacific Destination Management Service Market Revenue (Billion), by Country 2024 & 2032
- Figure 48: Asia Pacific Destination Management Service Market Volume (K Tons), by Country 2024 & 2032
- Figure 49: Asia Pacific Destination Management Service Market Revenue Share (%), by Country 2024 & 2032
- Figure 50: Asia Pacific Destination Management Service Market Volume Share (%), by Country 2024 & 2032
- Figure 51: Latin America Destination Management Service Market Revenue (Billion), by Service 2024 & 2032
- Figure 52: Latin America Destination Management Service Market Volume (K Tons), by Service 2024 & 2032
- Figure 53: Latin America Destination Management Service Market Revenue Share (%), by Service 2024 & 2032
- Figure 54: Latin America Destination Management Service Market Volume Share (%), by Service 2024 & 2032
- Figure 55: Latin America Destination Management Service Market Revenue (Billion), by Application 2024 & 2032
- Figure 56: Latin America Destination Management Service Market Volume (K Tons), by Application 2024 & 2032
- Figure 57: Latin America Destination Management Service Market Revenue Share (%), by Application 2024 & 2032
- Figure 58: Latin America Destination Management Service Market Volume Share (%), by Application 2024 & 2032
- Figure 59: Latin America Destination Management Service Market Revenue (Billion), by End-user 2024 & 2032
- Figure 60: Latin America Destination Management Service Market Volume (K Tons), by End-user 2024 & 2032
- Figure 61: Latin America Destination Management Service Market Revenue Share (%), by End-user 2024 & 2032
- Figure 62: Latin America Destination Management Service Market Volume Share (%), by End-user 2024 & 2032
- Figure 63: Latin America Destination Management Service Market Revenue (Billion), by Country 2024 & 2032
- Figure 64: Latin America Destination Management Service Market Volume (K Tons), by Country 2024 & 2032
- Figure 65: Latin America Destination Management Service Market Revenue Share (%), by Country 2024 & 2032
- Figure 66: Latin America Destination Management Service Market Volume Share (%), by Country 2024 & 2032
- Figure 67: MEA Destination Management Service Market Revenue (Billion), by Service 2024 & 2032
- Figure 68: MEA Destination Management Service Market Volume (K Tons), by Service 2024 & 2032
- Figure 69: MEA Destination Management Service Market Revenue Share (%), by Service 2024 & 2032
- Figure 70: MEA Destination Management Service Market Volume Share (%), by Service 2024 & 2032
- Figure 71: MEA Destination Management Service Market Revenue (Billion), by Application 2024 & 2032
- Figure 72: MEA Destination Management Service Market Volume (K Tons), by Application 2024 & 2032
- Figure 73: MEA Destination Management Service Market Revenue Share (%), by Application 2024 & 2032
- Figure 74: MEA Destination Management Service Market Volume Share (%), by Application 2024 & 2032
- Figure 75: MEA Destination Management Service Market Revenue (Billion), by End-user 2024 & 2032
- Figure 76: MEA Destination Management Service Market Volume (K Tons), by End-user 2024 & 2032
- Figure 77: MEA Destination Management Service Market Revenue Share (%), by End-user 2024 & 2032
- Figure 78: MEA Destination Management Service Market Volume Share (%), by End-user 2024 & 2032
- Figure 79: MEA Destination Management Service Market Revenue (Billion), by Country 2024 & 2032
- Figure 80: MEA Destination Management Service Market Volume (K Tons), by Country 2024 & 2032
- Figure 81: MEA Destination Management Service Market Revenue Share (%), by Country 2024 & 2032
- Figure 82: MEA Destination Management Service Market Volume Share (%), by Country 2024 & 2032
- Table 1: Global Destination Management Service Market Revenue Billion Forecast, by Region 2019 & 2032
- Table 2: Global Destination Management Service Market Volume K Tons Forecast, by Region 2019 & 2032
- Table 3: Global Destination Management Service Market Revenue Billion Forecast, by Service 2019 & 2032
- Table 4: Global Destination Management Service Market Volume K Tons Forecast, by Service 2019 & 2032
- Table 5: Global Destination Management Service Market Revenue Billion Forecast, by Application 2019 & 2032
- Table 6: Global Destination Management Service Market Volume K Tons Forecast, by Application 2019 & 2032
- Table 7: Global Destination Management Service Market Revenue Billion Forecast, by End-user 2019 & 2032
- Table 8: Global Destination Management Service Market Volume K Tons Forecast, by End-user 2019 & 2032
- Table 9: Global Destination Management Service Market Revenue Billion Forecast, by Region 2019 & 2032
- Table 10: Global Destination Management Service Market Volume K Tons Forecast, by Region 2019 & 2032
- Table 11: Global Destination Management Service Market Revenue Billion Forecast, by Service 2019 & 2032
- Table 12: Global Destination Management Service Market Volume K Tons Forecast, by Service 2019 & 2032
- Table 13: Global Destination Management Service Market Revenue Billion Forecast, by Application 2019 & 2032
- Table 14: Global Destination Management Service Market Volume K Tons Forecast, by Application 2019 & 2032
- Table 15: Global Destination Management Service Market Revenue Billion Forecast, by End-user 2019 & 2032
- Table 16: Global Destination Management Service Market Volume K Tons Forecast, by End-user 2019 & 2032
- Table 17: Global Destination Management Service Market Revenue Billion Forecast, by Country 2019 & 2032
- Table 18: Global Destination Management Service Market Volume K Tons Forecast, by Country 2019 & 2032
- Table 19: U.S. Destination Management Service Market Revenue (Billion) Forecast, by Application 2019 & 2032
- Table 20: U.S. Destination Management Service Market Volume (K Tons) Forecast, by Application 2019 & 2032
- Table 21: Canada Destination Management Service Market Revenue (Billion) Forecast, by Application 2019 & 2032
- Table 22: Canada Destination Management Service Market Volume (K Tons) Forecast, by Application 2019 & 2032
- Table 23: Global Destination Management Service Market Revenue Billion Forecast, by Service 2019 & 2032
- Table 24: Global Destination Management Service Market Volume K Tons Forecast, by Service 2019 & 2032
- Table 25: Global Destination Management Service Market Revenue Billion Forecast, by Application 2019 & 2032
- Table 26: Global Destination Management Service Market Volume K Tons Forecast, by Application 2019 & 2032
- Table 27: Global Destination Management Service Market Revenue Billion Forecast, by End-user 2019 & 2032
- Table 28: Global Destination Management Service Market Volume K Tons Forecast, by End-user 2019 & 2032
- Table 29: Global Destination Management Service Market Revenue Billion Forecast, by Country 2019 & 2032
- Table 30: Global Destination Management Service Market Volume K Tons Forecast, by Country 2019 & 2032
- Table 31: UK Destination Management Service Market Revenue (Billion) Forecast, by Application 2019 & 2032
- Table 32: UK Destination Management Service Market Volume (K Tons) Forecast, by Application 2019 & 2032
- Table 33: Germany Destination Management Service Market Revenue (Billion) Forecast, by Application 2019 & 2032
- Table 34: Germany Destination Management Service Market Volume (K Tons) Forecast, by Application 2019 & 2032
- Table 35: France Destination Management Service Market Revenue (Billion) Forecast, by Application 2019 & 2032
- Table 36: France Destination Management Service Market Volume (K Tons) Forecast, by Application 2019 & 2032
- Table 37: Russia Destination Management Service Market Revenue (Billion) Forecast, by Application 2019 & 2032
- Table 38: Russia Destination Management Service Market Volume (K Tons) Forecast, by Application 2019 & 2032
- Table 39: Italy Destination Management Service Market Revenue (Billion) Forecast, by Application 2019 & 2032
- Table 40: Italy Destination Management Service Market Volume (K Tons) Forecast, by Application 2019 & 2032
- Table 41: Spain Destination Management Service Market Revenue (Billion) Forecast, by Application 2019 & 2032
- Table 42: Spain Destination Management Service Market Volume (K Tons) Forecast, by Application 2019 & 2032
- Table 43: Nordics Destination Management Service Market Revenue (Billion) Forecast, by Application 2019 & 2032
- Table 44: Nordics Destination Management Service Market Volume (K Tons) Forecast, by Application 2019 & 2032
- Table 45: Rest of Europe Destination Management Service Market Revenue (Billion) Forecast, by Application 2019 & 2032
- Table 46: Rest of Europe Destination Management Service Market Volume (K Tons) Forecast, by Application 2019 & 2032
- Table 47: Global Destination Management Service Market Revenue Billion Forecast, by Service 2019 & 2032
- Table 48: Global Destination Management Service Market Volume K Tons Forecast, by Service 2019 & 2032
- Table 49: Global Destination Management Service Market Revenue Billion Forecast, by Application 2019 & 2032
- Table 50: Global Destination Management Service Market Volume K Tons Forecast, by Application 2019 & 2032
- Table 51: Global Destination Management Service Market Revenue Billion Forecast, by End-user 2019 & 2032
- Table 52: Global Destination Management Service Market Volume K Tons Forecast, by End-user 2019 & 2032
- Table 53: Global Destination Management Service Market Revenue Billion Forecast, by Country 2019 & 2032
- Table 54: Global Destination Management Service Market Volume K Tons Forecast, by Country 2019 & 2032
- Table 55: China Destination Management Service Market Revenue (Billion) Forecast, by Application 2019 & 2032
- Table 56: China Destination Management Service Market Volume (K Tons) Forecast, by Application 2019 & 2032
- Table 57: India Destination Management Service Market Revenue (Billion) Forecast, by Application 2019 & 2032
- Table 58: India Destination Management Service Market Volume (K Tons) Forecast, by Application 2019 & 2032
- Table 59: Japan Destination Management Service Market Revenue (Billion) Forecast, by Application 2019 & 2032
- Table 60: Japan Destination Management Service Market Volume (K Tons) Forecast, by Application 2019 & 2032
- Table 61: South Korea Destination Management Service Market Revenue (Billion) Forecast, by Application 2019 & 2032
- Table 62: South Korea Destination Management Service Market Volume (K Tons) Forecast, by Application 2019 & 2032
- Table 63: ANZ Destination Management Service Market Revenue (Billion) Forecast, by Application 2019 & 2032
- Table 64: ANZ Destination Management Service Market Volume (K Tons) Forecast, by Application 2019 & 2032
- Table 65: Southeast Asia Destination Management Service Market Revenue (Billion) Forecast, by Application 2019 & 2032
- Table 66: Southeast Asia Destination Management Service Market Volume (K Tons) Forecast, by Application 2019 & 2032
- Table 67: Rest of Asia Pacific Destination Management Service Market Revenue (Billion) Forecast, by Application 2019 & 2032
- Table 68: Rest of Asia Pacific Destination Management Service Market Volume (K Tons) Forecast, by Application 2019 & 2032
- Table 69: Global Destination Management Service Market Revenue Billion Forecast, by Service 2019 & 2032
- Table 70: Global Destination Management Service Market Volume K Tons Forecast, by Service 2019 & 2032
- Table 71: Global Destination Management Service Market Revenue Billion Forecast, by Application 2019 & 2032
- Table 72: Global Destination Management Service Market Volume K Tons Forecast, by Application 2019 & 2032
- Table 73: Global Destination Management Service Market Revenue Billion Forecast, by End-user 2019 & 2032
- Table 74: Global Destination Management Service Market Volume K Tons Forecast, by End-user 2019 & 2032
- Table 75: Global Destination Management Service Market Revenue Billion Forecast, by Country 2019 & 2032
- Table 76: Global Destination Management Service Market Volume K Tons Forecast, by Country 2019 & 2032
- Table 77: Brazil Destination Management Service Market Revenue (Billion) Forecast, by Application 2019 & 2032
- Table 78: Brazil Destination Management Service Market Volume (K Tons) Forecast, by Application 2019 & 2032
- Table 79: Mexico Destination Management Service Market Revenue (Billion) Forecast, by Application 2019 & 2032
- Table 80: Mexico Destination Management Service Market Volume (K Tons) Forecast, by Application 2019 & 2032
- Table 81: Argentina Destination Management Service Market Revenue (Billion) Forecast, by Application 2019 & 2032
- Table 82: Argentina Destination Management Service Market Volume (K Tons) Forecast, by Application 2019 & 2032
- Table 83: Rest of Latin America Destination Management Service Market Revenue (Billion) Forecast, by Application 2019 & 2032
- Table 84: Rest of Latin America Destination Management Service Market Volume (K Tons) Forecast, by Application 2019 & 2032
- Table 85: Global Destination Management Service Market Revenue Billion Forecast, by Service 2019 & 2032
- Table 86: Global Destination Management Service Market Volume K Tons Forecast, by Service 2019 & 2032
- Table 87: Global Destination Management Service Market Revenue Billion Forecast, by Application 2019 & 2032
- Table 88: Global Destination Management Service Market Volume K Tons Forecast, by Application 2019 & 2032
- Table 89: Global Destination Management Service Market Revenue Billion Forecast, by End-user 2019 & 2032
- Table 90: Global Destination Management Service Market Volume K Tons Forecast, by End-user 2019 & 2032
- Table 91: Global Destination Management Service Market Revenue Billion Forecast, by Country 2019 & 2032
- Table 92: Global Destination Management Service Market Volume K Tons Forecast, by Country 2019 & 2032
- Table 93: UAE Destination Management Service Market Revenue (Billion) Forecast, by Application 2019 & 2032
- Table 94: UAE Destination Management Service Market Volume (K Tons) Forecast, by Application 2019 & 2032
- Table 95: South Africa Destination Management Service Market Revenue (Billion) Forecast, by Application 2019 & 2032
- Table 96: South Africa Destination Management Service Market Volume (K Tons) Forecast, by Application 2019 & 2032
- Table 97: Saudi Arabia Destination Management Service Market Revenue (Billion) Forecast, by Application 2019 & 2032
- Table 98: Saudi Arabia Destination Management Service Market Volume (K Tons) Forecast, by Application 2019 & 2032
- Table 99: Rest of MEA Destination Management Service Market Revenue (Billion) Forecast, by Application 2019 & 2032
- Table 100: Rest of MEA Destination Management Service Market Volume (K Tons) Forecast, by Application 2019 & 2032
STEP 1 - Identification of Relevant Samples Size from Population Database


STEP 2 - Approaches for Defining Global Market Size (Value, Volume* & Price*)

Note* : In applicable scenarios
STEP 3 - Data Sources
Primary Research
- Web Analytics
- Survey Reports
- Research Institute
- Latest Research Reports
- Opinion Leaders
Secondary Research
- Annual Reports
- White Paper
- Latest Press Release
- Industry Association
- Paid Database
- Investor Presentations

STEP 4 - Data Triangulation
Involves using different sources of information in order to increase the validity of a study
These sources are likely to be stakeholders in a program - participants, other researchers, program staff, other community members, and so on.
Then we put all data in single framework & apply various statistical tools to find out the dynamic on the market.
During the analysis stage, feedback from the stakeholder groups would be compared to determine areas of agreement as well as areas of divergence
Frequently Asked Questions
Related Reports
See the similar reports


About Market Insights Report
Market Insights Reports offers comprehensive market research reports and analysis, giving businesses important information about their clients, rivals, and sector to help them make well-informed decisions on operations, marketing, and business strategy. We offer a variety of services in addition to market research, data analysis, and strategy planning. In order to find opportunities and learn more about our competitors and the industry at large, we employ competitive analysis. To identify areas for development, we also evaluate our performance against that of our rivals. We can determine the places at which we can offer our clients the most value by performing value chain analysis.
Additionally, clients receive a thorough overview of their industry business environment. We can find trends that help us forecast future possibilities and threats by examining global macroeconomic dynamics and consumer behavior patterns. By analyzing their features and advantages, contrasting them with comparable items on the market, and evaluating both their quantitative and qualitative performance, we comprehensively evaluate our clients' products. This allows us to assist customers in determining how their goods compare to those of their rivals and in creating successful marketing plans. Our group has been successful in gaining a thorough grasp of our clients' requirements and offering them creative solutions. We currently provide services to more than 50 nations in Europe, the Middle East, Africa, Latin America, Asia Pacific, and North America. Because of our global reach, we have been able to establish trusting bonds with our partners and clients in various nations, improving customer service and forging a more cohesive worldwide presence.