
.jpg&w=3840&q=100)
Market
Insights
Reports delivered globally, covering a wide range of industries and sectors.
Clients who trust our expertise and rely on our insights for business decisions.
Managed Reports, ensuring seamless updates and premium service.
Satisfied Customers, committed to delivering exceptional value and quality.
Automated Test Equipment Market Size, Share, and Growth Report: In-Depth Analysis and Forecast to 2033"
Automated Test Equipment Market by ATE (Memory ATE, Non-memory ATE, Discrete ATE, Others), by Product (Functional testers, In-circuit testers, Mixed-signal testers, Radio frequency testers, Optical testers, Others), by Application (Semiconductor testing, Wireless communication testing, Automotive electronics testing, Aerospace & defense testing, Others), by End-User Industry (Aerospace & defense, Consumer electronics, IT & telecommunications, Automotive, Other), by North America (U.S., Canada), by Europe (UK, Germany, France, Italy, Spain, Russia, Nordics, Rest of Europe), by Asia Pacific (China, India, Japan, South Korea, ANZ, Southeast Asia, Rest of Asia Pacific), by Latin America (Brazil, Mexico, Argentina, Rest of Latin America), by MEA (South Africa, UAE, Saudi Arabia, Rest of MEA) Forecast 2025-2033
Automated Test Equipment Market Size, Share, and Growth Report: In-Depth Analysis and Forecast to 2033"
Key Insights
The size of the Automated Test Equipment Market was valued at USD 9.6 Billion in 2024 and is projected to reach USD 18.71 Billion by 2033, with an expected CAGR of 10% during the forecast period. This growth is based on the large-scale requirements for accelerating fast and efficient automated testing solutions in various different industries. The electronic device revolution, advance in semiconductor manufacturing process, and the complexity of modern technologies require exact and reliable testing. Automotive electronics, aerospace & defense, and wireless communication are major segments that invest heavily in ATE. With the development of 5G technology, IoT-enabled devices, and AI-driven applications, the demand in the market is certainly going to accelerate. As there are continuous innovations in testing methodologies, ATE will play an important role as part of optimizing production cycles, reducing time-to-market, and enhancing reliability of electronic components. The ATE market will continue to experience growth and innovation as industries change.

Automated Test Equipment Market Concentration & Characteristics
The Automated Test Equipment market is characterized by a high level of concentration. The top players in the industry, such as Advantest, Teradyne, and National Instruments, hold a significant market share. These companies offer a wide range of ATE solutions, including functional testers, in-circuit testers, and mixed-signal testers, catering to the diverse needs of end-user industries.
Innovation plays a crucial role in the ATE market. Manufacturers are constantly striving to develop new technologies to improve the speed, accuracy, and efficiency of their testing solutions. The integration of artificial intelligence (AI) and machine learning (ML) is gaining traction, enabling ATE systems to perform more complex and autonomous testing tasks.
Automated Test Equipment Market Trends
One of the key trends shaping the ATE market is the rise of Industry 4.0 and the adoption of smart manufacturing practices. This has led to an increasing demand for automated and connected test systems that can be integrated with manufacturing execution systems (MES) and other enterprise resource planning (ERP) systems.
Another notable trend is the growing adoption of cloud-based ATE solutions. Cloud-based ATE offers several advantages, including reduced capital expenditure, increased scalability, and access to remote testing capabilities. This trend is particularly relevant for small and medium-sized enterprises (SMEs) and companies looking to optimize their testing operations.

Key Region or Country & Segment to Dominate the Market
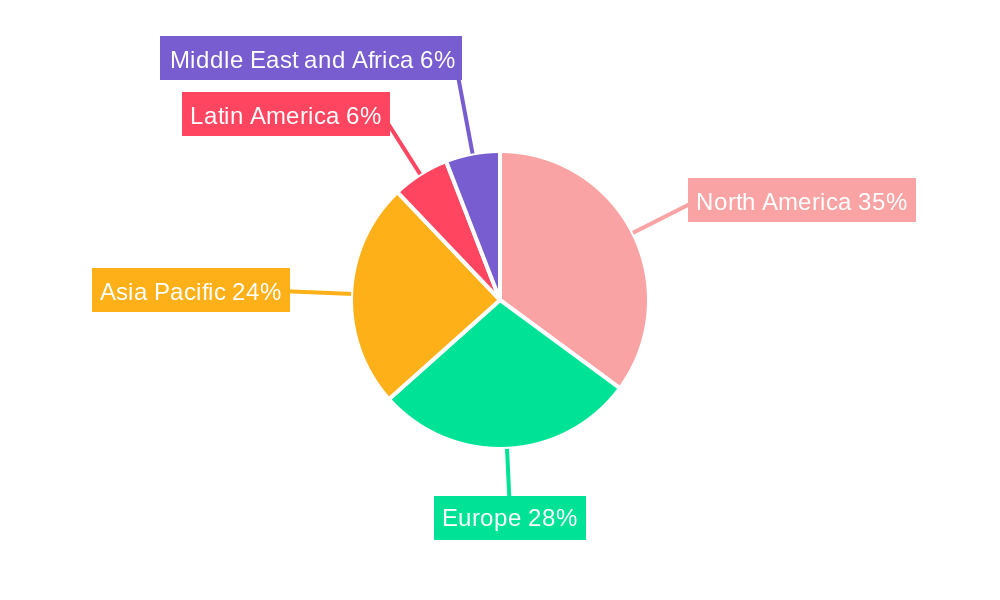
Key Region: Asia Pacific is anticipated to dominate the ATE market due to the presence of major electronics and semiconductor manufacturing hubs in China, Japan, and South Korea. The region's rapid economic growth and increasing investment in electronics infrastructure are driving the demand for automated testing solutions.
Key Segment: The semiconductor testing segment is expected to account for a significant share of the ATE market. The increasing demand for faster and more reliable semiconductors, coupled with the growing complexity of semiconductor designs, is driving the need for advanced ATE solutions.
Automated Test Equipment Market Product Insights Report Coverage & Deliverables
The report provides comprehensive insights into the ATE market, including market size, market share, and growth projections. It covers the various segments of the market, including product type, application, and end-user industry. The report also includes company profiles of leading players, analysis of market trends, and key market drivers and challenges.
Automated Test Equipment Market Analysis
In terms of market size, the global ATE market is estimated to reach $20.3 billion by 2028, growing at a CAGR of 10% from 2023 to 2028. The growing demand for electronics and semiconductors, coupled with technological advancements, is expected to drive market growth.
The largest market share is held by functional testers, followed by in-circuit testers and mixed-signal testers. The semiconductor testing application accounts for the largest share of the market, while the aerospace & defense industry is expected to witness significant growth in the coming years.
Automated Test Equipment Market Regional Insights
- North America:
- U.S.
- Canada
- Europe:
- UK
- Germany
- France
- Italy
- Spain
- Russia
- Nordics
- Rest of Europe
- Asia Pacific:
- China
- India
- Japan
- South Korea
- ANZ
- Southeast Asia
- Rest of Asia Pacific
- Latin America:
- Brazil
- Mexico
- Argentina
- Rest of Latin America
- MEA:
- South Africa
- UAE
- Saudi Arabia
- Rest of MEA
Driving Forces: What's Propelling the Automated Test Equipment Market
- Increasing demand for faster and more efficient testing solutions
- Proliferation of electronic devices and semiconductor industry growth
- Rising concerns over product quality and safety
- Government regulations and standards
- Technological advancements (AI, ML, cloud-based solutions)
Challenges and Restraints in Automated Test Equipment Market
- High cost of ATE equipment
- Complexity of testing complex electronics
- Lack of skilled labor in some regions
- Fluctuations in raw material prices
Emerging Trends in Automated Test Equipment Market
- Integration of AI and ML for autonomous testing
- Adoption of cloud-based ATE solutions
- Rise of Industry 4.0 and smart manufacturing
- Increased demand for non-intrusive testing methods
Automated Test Equipment Industry News
June 2023: Probe Test Solutions Ltd (PTSL) launches the PhazorRF product family, featuring advanced RF probe cards operating at 120GHz for testing high-frequency RF integrated circuits and complex SoCs.
March 2024: Airties unveils Orbit, a continuous test automation tool designed specifically for managed Wi-Fi networks, aiming to enhance the effectiveness and precision of testing procedures.
Leading Players in the Automated Test Equipment Market
- Advantest Corporation
- Teradyne, Inc.
- National Instruments
- Chroma ATE Inc.
- Keysight Technologies
- Anritsu Corporation
- Marvin Test Solutions, Inc.
Automated Test Equipment Market Segmentation
- 1. ATE
- 1.1. Memory ATE
- 1.2. Non-memory ATE
- 1.3. Discrete ATE
- 1.4. Others
- 2. Product
- 2.1. Functional testers
- 2.2. In-circuit testers
- 2.3. Mixed-signal testers
- 2.4. Radio frequency testers
- 2.5. Optical testers
- 2.6. Others
- 3. Application
- 3.1. Semiconductor testing
- 3.2. Wireless communication testing
- 3.3. Automotive electronics testing
- 3.4. Aerospace & defense testing
- 3.5. Others
- 4. End-User Industry
- 4.1. Aerospace & defense
- 4.2. Consumer electronics
- 4.3. IT & telecommunications
- 4.4. Automotive
- 4.5. Other
Automated Test Equipment Market Segmentation By Geography
- 1. North America
- 1.1. U.S.
- 1.2. Canada
- 2. Europe
- 2.1. UK
- 2.2. Germany
- 2.3. France
- 2.4. Italy
- 2.5. Spain
- 2.6. Russia
- 2.7. Nordics
- 2.8. Rest of Europe
- 3. Asia Pacific
- 3.1. China
- 3.2. India
- 3.3. Japan
- 3.4. South Korea
- 3.5. ANZ
- 3.6. Southeast Asia
- 3.7. Rest of Asia Pacific
- 4. Latin America
- 4.1. Brazil
- 4.2. Mexico
- 4.3. Argentina
- 4.4. Rest of Latin America
- 5. MEA
- 5.1. South Africa
- 5.2. UAE
- 5.3. Saudi Arabia
- 5.4. Rest of MEA
Automated Test Equipment Market REPORT HIGHLIGHTS
| Aspects | Details |
|---|---|
| Study Period | 2019-2033 |
| Base Year | 2024 |
| Estimated Year | 2025 |
| Forecast Period | 2025-2033 |
| Historical Period | 2019-2024 |
| Growth Rate | CAGR of 10% from 2019-2033 |
| Segmentation |
|
- 1. Introduction
- 1.1. Research Scope
- 1.2. Market Segmentation
- 1.3. Research Methodology
- 1.4. Definitions and Assumptions
- 2. Executive Summary
- 2.1. Introduction
- 3. Market Dynamics
- 3.1. Introduction
- 3.2. Market Drivers
- 3.2.1 Expansion of 5G networks and technology
- 3.2.2 Rise in electric and autonomous vehicles
- 3.2.3 Advancements in consumer electronics and IoT
- 3.2.4 Growth in aerospace and defense technologies
- 3.3. Market Restrains
- 3.3.1 High initial investment and implementation costs
- 3.3.2 Rapid technological advancements requiring frequent upgrades
- 3.4. Market Trends
- 3.4.1. One of the key trends shaping the ATE market is the rise of Industry 4.0 and the adoption of smart manufacturing practices. This has led to an increasing demand for automated and connected test systems that can be integrated with manufacturing execution systems (MES) and other enterprise resource planning (ERP) systems.
- 4. Market Factor Analysis
- 4.1. Porters Five Forces
- 4.2. Supply/Value Chain
- 4.3. PESTEL analysis
- 4.4. Market Entropy
- 4.5. Patent/Trademark Analysis
- 5. Global Automated Test Equipment Market Analysis, Insights and Forecast, 2019-2031
- 5.1. Market Analysis, Insights and Forecast - by ATE
- 5.1.1. Memory ATE
- 5.1.2. Non-memory ATE
- 5.1.3. Discrete ATE
- 5.1.4. Others
- 5.2. Market Analysis, Insights and Forecast - by Product
- 5.2.1. Functional testers
- 5.2.2. In-circuit testers
- 5.2.3. Mixed-signal testers
- 5.2.4. Radio frequency testers
- 5.2.5. Optical testers
- 5.2.6. Others
- 5.3. Market Analysis, Insights and Forecast - by Application
- 5.3.1. Semiconductor testing
- 5.3.2. Wireless communication testing
- 5.3.3. Automotive electronics testing
- 5.3.4. Aerospace & defense testing
- 5.3.5. Others
- 5.4. Market Analysis, Insights and Forecast - by End-User Industry
- 5.4.1. Aerospace & defense
- 5.4.2. Consumer electronics
- 5.4.3. IT & telecommunications
- 5.4.4. Automotive
- 5.4.5. Other
- 5.5. Market Analysis, Insights and Forecast - by Region
- 5.5.1. North America
- 5.5.2. Europe
- 5.5.3. Asia Pacific
- 5.5.4. Latin America
- 5.5.5. MEA
- 5.1. Market Analysis, Insights and Forecast - by ATE
- 6. North America Automated Test Equipment Market Analysis, Insights and Forecast, 2019-2031
- 6.1. Market Analysis, Insights and Forecast - by ATE
- 6.1.1. Memory ATE
- 6.1.2. Non-memory ATE
- 6.1.3. Discrete ATE
- 6.1.4. Others
- 6.2. Market Analysis, Insights and Forecast - by Product
- 6.2.1. Functional testers
- 6.2.2. In-circuit testers
- 6.2.3. Mixed-signal testers
- 6.2.4. Radio frequency testers
- 6.2.5. Optical testers
- 6.2.6. Others
- 6.3. Market Analysis, Insights and Forecast - by Application
- 6.3.1. Semiconductor testing
- 6.3.2. Wireless communication testing
- 6.3.3. Automotive electronics testing
- 6.3.4. Aerospace & defense testing
- 6.3.5. Others
- 6.4. Market Analysis, Insights and Forecast - by End-User Industry
- 6.4.1. Aerospace & defense
- 6.4.2. Consumer electronics
- 6.4.3. IT & telecommunications
- 6.4.4. Automotive
- 6.4.5. Other
- 6.1. Market Analysis, Insights and Forecast - by ATE
- 7. Europe Automated Test Equipment Market Analysis, Insights and Forecast, 2019-2031
- 7.1. Market Analysis, Insights and Forecast - by ATE
- 7.1.1. Memory ATE
- 7.1.2. Non-memory ATE
- 7.1.3. Discrete ATE
- 7.1.4. Others
- 7.2. Market Analysis, Insights and Forecast - by Product
- 7.2.1. Functional testers
- 7.2.2. In-circuit testers
- 7.2.3. Mixed-signal testers
- 7.2.4. Radio frequency testers
- 7.2.5. Optical testers
- 7.2.6. Others
- 7.3. Market Analysis, Insights and Forecast - by Application
- 7.3.1. Semiconductor testing
- 7.3.2. Wireless communication testing
- 7.3.3. Automotive electronics testing
- 7.3.4. Aerospace & defense testing
- 7.3.5. Others
- 7.4. Market Analysis, Insights and Forecast - by End-User Industry
- 7.4.1. Aerospace & defense
- 7.4.2. Consumer electronics
- 7.4.3. IT & telecommunications
- 7.4.4. Automotive
- 7.4.5. Other
- 7.1. Market Analysis, Insights and Forecast - by ATE
- 8. Asia Pacific Automated Test Equipment Market Analysis, Insights and Forecast, 2019-2031
- 8.1. Market Analysis, Insights and Forecast - by ATE
- 8.1.1. Memory ATE
- 8.1.2. Non-memory ATE
- 8.1.3. Discrete ATE
- 8.1.4. Others
- 8.2. Market Analysis, Insights and Forecast - by Product
- 8.2.1. Functional testers
- 8.2.2. In-circuit testers
- 8.2.3. Mixed-signal testers
- 8.2.4. Radio frequency testers
- 8.2.5. Optical testers
- 8.2.6. Others
- 8.3. Market Analysis, Insights and Forecast - by Application
- 8.3.1. Semiconductor testing
- 8.3.2. Wireless communication testing
- 8.3.3. Automotive electronics testing
- 8.3.4. Aerospace & defense testing
- 8.3.5. Others
- 8.4. Market Analysis, Insights and Forecast - by End-User Industry
- 8.4.1. Aerospace & defense
- 8.4.2. Consumer electronics
- 8.4.3. IT & telecommunications
- 8.4.4. Automotive
- 8.4.5. Other
- 8.1. Market Analysis, Insights and Forecast - by ATE
- 9. Latin America Automated Test Equipment Market Analysis, Insights and Forecast, 2019-2031
- 9.1. Market Analysis, Insights and Forecast - by ATE
- 9.1.1. Memory ATE
- 9.1.2. Non-memory ATE
- 9.1.3. Discrete ATE
- 9.1.4. Others
- 9.2. Market Analysis, Insights and Forecast - by Product
- 9.2.1. Functional testers
- 9.2.2. In-circuit testers
- 9.2.3. Mixed-signal testers
- 9.2.4. Radio frequency testers
- 9.2.5. Optical testers
- 9.2.6. Others
- 9.3. Market Analysis, Insights and Forecast - by Application
- 9.3.1. Semiconductor testing
- 9.3.2. Wireless communication testing
- 9.3.3. Automotive electronics testing
- 9.3.4. Aerospace & defense testing
- 9.3.5. Others
- 9.4. Market Analysis, Insights and Forecast - by End-User Industry
- 9.4.1. Aerospace & defense
- 9.4.2. Consumer electronics
- 9.4.3. IT & telecommunications
- 9.4.4. Automotive
- 9.4.5. Other
- 9.1. Market Analysis, Insights and Forecast - by ATE
- 10. MEA Automated Test Equipment Market Analysis, Insights and Forecast, 2019-2031
- 10.1. Market Analysis, Insights and Forecast - by ATE
- 10.1.1. Memory ATE
- 10.1.2. Non-memory ATE
- 10.1.3. Discrete ATE
- 10.1.4. Others
- 10.2. Market Analysis, Insights and Forecast - by Product
- 10.2.1. Functional testers
- 10.2.2. In-circuit testers
- 10.2.3. Mixed-signal testers
- 10.2.4. Radio frequency testers
- 10.2.5. Optical testers
- 10.2.6. Others
- 10.3. Market Analysis, Insights and Forecast - by Application
- 10.3.1. Semiconductor testing
- 10.3.2. Wireless communication testing
- 10.3.3. Automotive electronics testing
- 10.3.4. Aerospace & defense testing
- 10.3.5. Others
- 10.4. Market Analysis, Insights and Forecast - by End-User Industry
- 10.4.1. Aerospace & defense
- 10.4.2. Consumer electronics
- 10.4.3. IT & telecommunications
- 10.4.4. Automotive
- 10.4.5. Other
- 10.1. Market Analysis, Insights and Forecast - by ATE
- 11. Competitive Analysis
- 11.1. Global Market Share Analysis 2024
- 11.2. Company Profiles
- 11.2.1 Advantest Corporation
- 11.2.1.1. Overview
- 11.2.1.2. Products
- 11.2.1.3. SWOT Analysis
- 11.2.1.4. Recent Developments
- 11.2.1.5. Financials (Based on Availability)
- 11.2.2 Teradyne Inc.
- 11.2.2.1. Overview
- 11.2.2.2. Products
- 11.2.2.3. SWOT Analysis
- 11.2.2.4. Recent Developments
- 11.2.2.5. Financials (Based on Availability)
- 11.2.3 National Instruments
- 11.2.3.1. Overview
- 11.2.3.2. Products
- 11.2.3.3. SWOT Analysis
- 11.2.3.4. Recent Developments
- 11.2.3.5. Financials (Based on Availability)
- 11.2.4 Chroma ATE Inc.
- 11.2.4.1. Overview
- 11.2.4.2. Products
- 11.2.4.3. SWOT Analysis
- 11.2.4.4. Recent Developments
- 11.2.4.5. Financials (Based on Availability)
- 11.2.5 Keysight Technologies
- 11.2.5.1. Overview
- 11.2.5.2. Products
- 11.2.5.3. SWOT Analysis
- 11.2.5.4. Recent Developments
- 11.2.5.5. Financials (Based on Availability)
- 11.2.6 Anritsu Corporation
- 11.2.6.1. Overview
- 11.2.6.2. Products
- 11.2.6.3. SWOT Analysis
- 11.2.6.4. Recent Developments
- 11.2.6.5. Financials (Based on Availability)
- 11.2.7 Marvin Test Solutions Inc.
- 11.2.7.1. Overview
- 11.2.7.2. Products
- 11.2.7.3. SWOT Analysis
- 11.2.7.4. Recent Developments
- 11.2.7.5. Financials (Based on Availability)
- 11.2.1 Advantest Corporation
- Figure 1: Global Automated Test Equipment Market Revenue Breakdown (Billion, %) by Region 2024 & 2032
- Figure 2: Global Automated Test Equipment Market Volume Breakdown (units, %) by Region 2024 & 2032
- Figure 3: North America Automated Test Equipment Market Revenue (Billion), by ATE 2024 & 2032
- Figure 4: North America Automated Test Equipment Market Volume (units), by ATE 2024 & 2032
- Figure 5: North America Automated Test Equipment Market Revenue Share (%), by ATE 2024 & 2032
- Figure 6: North America Automated Test Equipment Market Volume Share (%), by ATE 2024 & 2032
- Figure 7: North America Automated Test Equipment Market Revenue (Billion), by Product 2024 & 2032
- Figure 8: North America Automated Test Equipment Market Volume (units), by Product 2024 & 2032
- Figure 9: North America Automated Test Equipment Market Revenue Share (%), by Product 2024 & 2032
- Figure 10: North America Automated Test Equipment Market Volume Share (%), by Product 2024 & 2032
- Figure 11: North America Automated Test Equipment Market Revenue (Billion), by Application 2024 & 2032
- Figure 12: North America Automated Test Equipment Market Volume (units), by Application 2024 & 2032
- Figure 13: North America Automated Test Equipment Market Revenue Share (%), by Application 2024 & 2032
- Figure 14: North America Automated Test Equipment Market Volume Share (%), by Application 2024 & 2032
- Figure 15: North America Automated Test Equipment Market Revenue (Billion), by End-User Industry 2024 & 2032
- Figure 16: North America Automated Test Equipment Market Volume (units), by End-User Industry 2024 & 2032
- Figure 17: North America Automated Test Equipment Market Revenue Share (%), by End-User Industry 2024 & 2032
- Figure 18: North America Automated Test Equipment Market Volume Share (%), by End-User Industry 2024 & 2032
- Figure 19: North America Automated Test Equipment Market Revenue (Billion), by Country 2024 & 2032
- Figure 20: North America Automated Test Equipment Market Volume (units), by Country 2024 & 2032
- Figure 21: North America Automated Test Equipment Market Revenue Share (%), by Country 2024 & 2032
- Figure 22: North America Automated Test Equipment Market Volume Share (%), by Country 2024 & 2032
- Figure 23: Europe Automated Test Equipment Market Revenue (Billion), by ATE 2024 & 2032
- Figure 24: Europe Automated Test Equipment Market Volume (units), by ATE 2024 & 2032
- Figure 25: Europe Automated Test Equipment Market Revenue Share (%), by ATE 2024 & 2032
- Figure 26: Europe Automated Test Equipment Market Volume Share (%), by ATE 2024 & 2032
- Figure 27: Europe Automated Test Equipment Market Revenue (Billion), by Product 2024 & 2032
- Figure 28: Europe Automated Test Equipment Market Volume (units), by Product 2024 & 2032
- Figure 29: Europe Automated Test Equipment Market Revenue Share (%), by Product 2024 & 2032
- Figure 30: Europe Automated Test Equipment Market Volume Share (%), by Product 2024 & 2032
- Figure 31: Europe Automated Test Equipment Market Revenue (Billion), by Application 2024 & 2032
- Figure 32: Europe Automated Test Equipment Market Volume (units), by Application 2024 & 2032
- Figure 33: Europe Automated Test Equipment Market Revenue Share (%), by Application 2024 & 2032
- Figure 34: Europe Automated Test Equipment Market Volume Share (%), by Application 2024 & 2032
- Figure 35: Europe Automated Test Equipment Market Revenue (Billion), by End-User Industry 2024 & 2032
- Figure 36: Europe Automated Test Equipment Market Volume (units), by End-User Industry 2024 & 2032
- Figure 37: Europe Automated Test Equipment Market Revenue Share (%), by End-User Industry 2024 & 2032
- Figure 38: Europe Automated Test Equipment Market Volume Share (%), by End-User Industry 2024 & 2032
- Figure 39: Europe Automated Test Equipment Market Revenue (Billion), by Country 2024 & 2032
- Figure 40: Europe Automated Test Equipment Market Volume (units), by Country 2024 & 2032
- Figure 41: Europe Automated Test Equipment Market Revenue Share (%), by Country 2024 & 2032
- Figure 42: Europe Automated Test Equipment Market Volume Share (%), by Country 2024 & 2032
- Figure 43: Asia Pacific Automated Test Equipment Market Revenue (Billion), by ATE 2024 & 2032
- Figure 44: Asia Pacific Automated Test Equipment Market Volume (units), by ATE 2024 & 2032
- Figure 45: Asia Pacific Automated Test Equipment Market Revenue Share (%), by ATE 2024 & 2032
- Figure 46: Asia Pacific Automated Test Equipment Market Volume Share (%), by ATE 2024 & 2032
- Figure 47: Asia Pacific Automated Test Equipment Market Revenue (Billion), by Product 2024 & 2032
- Figure 48: Asia Pacific Automated Test Equipment Market Volume (units), by Product 2024 & 2032
- Figure 49: Asia Pacific Automated Test Equipment Market Revenue Share (%), by Product 2024 & 2032
- Figure 50: Asia Pacific Automated Test Equipment Market Volume Share (%), by Product 2024 & 2032
- Figure 51: Asia Pacific Automated Test Equipment Market Revenue (Billion), by Application 2024 & 2032
- Figure 52: Asia Pacific Automated Test Equipment Market Volume (units), by Application 2024 & 2032
- Figure 53: Asia Pacific Automated Test Equipment Market Revenue Share (%), by Application 2024 & 2032
- Figure 54: Asia Pacific Automated Test Equipment Market Volume Share (%), by Application 2024 & 2032
- Figure 55: Asia Pacific Automated Test Equipment Market Revenue (Billion), by End-User Industry 2024 & 2032
- Figure 56: Asia Pacific Automated Test Equipment Market Volume (units), by End-User Industry 2024 & 2032
- Figure 57: Asia Pacific Automated Test Equipment Market Revenue Share (%), by End-User Industry 2024 & 2032
- Figure 58: Asia Pacific Automated Test Equipment Market Volume Share (%), by End-User Industry 2024 & 2032
- Figure 59: Asia Pacific Automated Test Equipment Market Revenue (Billion), by Country 2024 & 2032
- Figure 60: Asia Pacific Automated Test Equipment Market Volume (units), by Country 2024 & 2032
- Figure 61: Asia Pacific Automated Test Equipment Market Revenue Share (%), by Country 2024 & 2032
- Figure 62: Asia Pacific Automated Test Equipment Market Volume Share (%), by Country 2024 & 2032
- Figure 63: Latin America Automated Test Equipment Market Revenue (Billion), by ATE 2024 & 2032
- Figure 64: Latin America Automated Test Equipment Market Volume (units), by ATE 2024 & 2032
- Figure 65: Latin America Automated Test Equipment Market Revenue Share (%), by ATE 2024 & 2032
- Figure 66: Latin America Automated Test Equipment Market Volume Share (%), by ATE 2024 & 2032
- Figure 67: Latin America Automated Test Equipment Market Revenue (Billion), by Product 2024 & 2032
- Figure 68: Latin America Automated Test Equipment Market Volume (units), by Product 2024 & 2032
- Figure 69: Latin America Automated Test Equipment Market Revenue Share (%), by Product 2024 & 2032
- Figure 70: Latin America Automated Test Equipment Market Volume Share (%), by Product 2024 & 2032
- Figure 71: Latin America Automated Test Equipment Market Revenue (Billion), by Application 2024 & 2032
- Figure 72: Latin America Automated Test Equipment Market Volume (units), by Application 2024 & 2032
- Figure 73: Latin America Automated Test Equipment Market Revenue Share (%), by Application 2024 & 2032
- Figure 74: Latin America Automated Test Equipment Market Volume Share (%), by Application 2024 & 2032
- Figure 75: Latin America Automated Test Equipment Market Revenue (Billion), by End-User Industry 2024 & 2032
- Figure 76: Latin America Automated Test Equipment Market Volume (units), by End-User Industry 2024 & 2032
- Figure 77: Latin America Automated Test Equipment Market Revenue Share (%), by End-User Industry 2024 & 2032
- Figure 78: Latin America Automated Test Equipment Market Volume Share (%), by End-User Industry 2024 & 2032
- Figure 79: Latin America Automated Test Equipment Market Revenue (Billion), by Country 2024 & 2032
- Figure 80: Latin America Automated Test Equipment Market Volume (units), by Country 2024 & 2032
- Figure 81: Latin America Automated Test Equipment Market Revenue Share (%), by Country 2024 & 2032
- Figure 82: Latin America Automated Test Equipment Market Volume Share (%), by Country 2024 & 2032
- Figure 83: MEA Automated Test Equipment Market Revenue (Billion), by ATE 2024 & 2032
- Figure 84: MEA Automated Test Equipment Market Volume (units), by ATE 2024 & 2032
- Figure 85: MEA Automated Test Equipment Market Revenue Share (%), by ATE 2024 & 2032
- Figure 86: MEA Automated Test Equipment Market Volume Share (%), by ATE 2024 & 2032
- Figure 87: MEA Automated Test Equipment Market Revenue (Billion), by Product 2024 & 2032
- Figure 88: MEA Automated Test Equipment Market Volume (units), by Product 2024 & 2032
- Figure 89: MEA Automated Test Equipment Market Revenue Share (%), by Product 2024 & 2032
- Figure 90: MEA Automated Test Equipment Market Volume Share (%), by Product 2024 & 2032
- Figure 91: MEA Automated Test Equipment Market Revenue (Billion), by Application 2024 & 2032
- Figure 92: MEA Automated Test Equipment Market Volume (units), by Application 2024 & 2032
- Figure 93: MEA Automated Test Equipment Market Revenue Share (%), by Application 2024 & 2032
- Figure 94: MEA Automated Test Equipment Market Volume Share (%), by Application 2024 & 2032
- Figure 95: MEA Automated Test Equipment Market Revenue (Billion), by End-User Industry 2024 & 2032
- Figure 96: MEA Automated Test Equipment Market Volume (units), by End-User Industry 2024 & 2032
- Figure 97: MEA Automated Test Equipment Market Revenue Share (%), by End-User Industry 2024 & 2032
- Figure 98: MEA Automated Test Equipment Market Volume Share (%), by End-User Industry 2024 & 2032
- Figure 99: MEA Automated Test Equipment Market Revenue (Billion), by Country 2024 & 2032
- Figure 100: MEA Automated Test Equipment Market Volume (units), by Country 2024 & 2032
- Figure 101: MEA Automated Test Equipment Market Revenue Share (%), by Country 2024 & 2032
- Figure 102: MEA Automated Test Equipment Market Volume Share (%), by Country 2024 & 2032
- Table 1: Global Automated Test Equipment Market Revenue Billion Forecast, by Region 2019 & 2032
- Table 2: Global Automated Test Equipment Market Volume units Forecast, by Region 2019 & 2032
- Table 3: Global Automated Test Equipment Market Revenue Billion Forecast, by ATE 2019 & 2032
- Table 4: Global Automated Test Equipment Market Volume units Forecast, by ATE 2019 & 2032
- Table 5: Global Automated Test Equipment Market Revenue Billion Forecast, by Product 2019 & 2032
- Table 6: Global Automated Test Equipment Market Volume units Forecast, by Product 2019 & 2032
- Table 7: Global Automated Test Equipment Market Revenue Billion Forecast, by Application 2019 & 2032
- Table 8: Global Automated Test Equipment Market Volume units Forecast, by Application 2019 & 2032
- Table 9: Global Automated Test Equipment Market Revenue Billion Forecast, by End-User Industry 2019 & 2032
- Table 10: Global Automated Test Equipment Market Volume units Forecast, by End-User Industry 2019 & 2032
- Table 11: Global Automated Test Equipment Market Revenue Billion Forecast, by Region 2019 & 2032
- Table 12: Global Automated Test Equipment Market Volume units Forecast, by Region 2019 & 2032
- Table 13: Global Automated Test Equipment Market Revenue Billion Forecast, by ATE 2019 & 2032
- Table 14: Global Automated Test Equipment Market Volume units Forecast, by ATE 2019 & 2032
- Table 15: Global Automated Test Equipment Market Revenue Billion Forecast, by Product 2019 & 2032
- Table 16: Global Automated Test Equipment Market Volume units Forecast, by Product 2019 & 2032
- Table 17: Global Automated Test Equipment Market Revenue Billion Forecast, by Application 2019 & 2032
- Table 18: Global Automated Test Equipment Market Volume units Forecast, by Application 2019 & 2032
- Table 19: Global Automated Test Equipment Market Revenue Billion Forecast, by End-User Industry 2019 & 2032
- Table 20: Global Automated Test Equipment Market Volume units Forecast, by End-User Industry 2019 & 2032
- Table 21: Global Automated Test Equipment Market Revenue Billion Forecast, by Country 2019 & 2032
- Table 22: Global Automated Test Equipment Market Volume units Forecast, by Country 2019 & 2032
- Table 23: U.S. Automated Test Equipment Market Revenue (Billion) Forecast, by Application 2019 & 2032
- Table 24: U.S. Automated Test Equipment Market Volume (units) Forecast, by Application 2019 & 2032
- Table 25: Canada Automated Test Equipment Market Revenue (Billion) Forecast, by Application 2019 & 2032
- Table 26: Canada Automated Test Equipment Market Volume (units) Forecast, by Application 2019 & 2032
- Table 27: Global Automated Test Equipment Market Revenue Billion Forecast, by ATE 2019 & 2032
- Table 28: Global Automated Test Equipment Market Volume units Forecast, by ATE 2019 & 2032
- Table 29: Global Automated Test Equipment Market Revenue Billion Forecast, by Product 2019 & 2032
- Table 30: Global Automated Test Equipment Market Volume units Forecast, by Product 2019 & 2032
- Table 31: Global Automated Test Equipment Market Revenue Billion Forecast, by Application 2019 & 2032
- Table 32: Global Automated Test Equipment Market Volume units Forecast, by Application 2019 & 2032
- Table 33: Global Automated Test Equipment Market Revenue Billion Forecast, by End-User Industry 2019 & 2032
- Table 34: Global Automated Test Equipment Market Volume units Forecast, by End-User Industry 2019 & 2032
- Table 35: Global Automated Test Equipment Market Revenue Billion Forecast, by Country 2019 & 2032
- Table 36: Global Automated Test Equipment Market Volume units Forecast, by Country 2019 & 2032
- Table 37: UK Automated Test Equipment Market Revenue (Billion) Forecast, by Application 2019 & 2032
- Table 38: UK Automated Test Equipment Market Volume (units) Forecast, by Application 2019 & 2032
- Table 39: Germany Automated Test Equipment Market Revenue (Billion) Forecast, by Application 2019 & 2032
- Table 40: Germany Automated Test Equipment Market Volume (units) Forecast, by Application 2019 & 2032
- Table 41: France Automated Test Equipment Market Revenue (Billion) Forecast, by Application 2019 & 2032
- Table 42: France Automated Test Equipment Market Volume (units) Forecast, by Application 2019 & 2032
- Table 43: Italy Automated Test Equipment Market Revenue (Billion) Forecast, by Application 2019 & 2032
- Table 44: Italy Automated Test Equipment Market Volume (units) Forecast, by Application 2019 & 2032
- Table 45: Spain Automated Test Equipment Market Revenue (Billion) Forecast, by Application 2019 & 2032
- Table 46: Spain Automated Test Equipment Market Volume (units) Forecast, by Application 2019 & 2032
- Table 47: Russia Automated Test Equipment Market Revenue (Billion) Forecast, by Application 2019 & 2032
- Table 48: Russia Automated Test Equipment Market Volume (units) Forecast, by Application 2019 & 2032
- Table 49: Nordics Automated Test Equipment Market Revenue (Billion) Forecast, by Application 2019 & 2032
- Table 50: Nordics Automated Test Equipment Market Volume (units) Forecast, by Application 2019 & 2032
- Table 51: Rest of Europe Automated Test Equipment Market Revenue (Billion) Forecast, by Application 2019 & 2032
- Table 52: Rest of Europe Automated Test Equipment Market Volume (units) Forecast, by Application 2019 & 2032
- Table 53: Global Automated Test Equipment Market Revenue Billion Forecast, by ATE 2019 & 2032
- Table 54: Global Automated Test Equipment Market Volume units Forecast, by ATE 2019 & 2032
- Table 55: Global Automated Test Equipment Market Revenue Billion Forecast, by Product 2019 & 2032
- Table 56: Global Automated Test Equipment Market Volume units Forecast, by Product 2019 & 2032
- Table 57: Global Automated Test Equipment Market Revenue Billion Forecast, by Application 2019 & 2032
- Table 58: Global Automated Test Equipment Market Volume units Forecast, by Application 2019 & 2032
- Table 59: Global Automated Test Equipment Market Revenue Billion Forecast, by End-User Industry 2019 & 2032
- Table 60: Global Automated Test Equipment Market Volume units Forecast, by End-User Industry 2019 & 2032
- Table 61: Global Automated Test Equipment Market Revenue Billion Forecast, by Country 2019 & 2032
- Table 62: Global Automated Test Equipment Market Volume units Forecast, by Country 2019 & 2032
- Table 63: China Automated Test Equipment Market Revenue (Billion) Forecast, by Application 2019 & 2032
- Table 64: China Automated Test Equipment Market Volume (units) Forecast, by Application 2019 & 2032
- Table 65: India Automated Test Equipment Market Revenue (Billion) Forecast, by Application 2019 & 2032
- Table 66: India Automated Test Equipment Market Volume (units) Forecast, by Application 2019 & 2032
- Table 67: Japan Automated Test Equipment Market Revenue (Billion) Forecast, by Application 2019 & 2032
- Table 68: Japan Automated Test Equipment Market Volume (units) Forecast, by Application 2019 & 2032
- Table 69: South Korea Automated Test Equipment Market Revenue (Billion) Forecast, by Application 2019 & 2032
- Table 70: South Korea Automated Test Equipment Market Volume (units) Forecast, by Application 2019 & 2032
- Table 71: ANZ Automated Test Equipment Market Revenue (Billion) Forecast, by Application 2019 & 2032
- Table 72: ANZ Automated Test Equipment Market Volume (units) Forecast, by Application 2019 & 2032
- Table 73: Southeast Asia Automated Test Equipment Market Revenue (Billion) Forecast, by Application 2019 & 2032
- Table 74: Southeast Asia Automated Test Equipment Market Volume (units) Forecast, by Application 2019 & 2032
- Table 75: Rest of Asia Pacific Automated Test Equipment Market Revenue (Billion) Forecast, by Application 2019 & 2032
- Table 76: Rest of Asia Pacific Automated Test Equipment Market Volume (units) Forecast, by Application 2019 & 2032
- Table 77: Global Automated Test Equipment Market Revenue Billion Forecast, by ATE 2019 & 2032
- Table 78: Global Automated Test Equipment Market Volume units Forecast, by ATE 2019 & 2032
- Table 79: Global Automated Test Equipment Market Revenue Billion Forecast, by Product 2019 & 2032
- Table 80: Global Automated Test Equipment Market Volume units Forecast, by Product 2019 & 2032
- Table 81: Global Automated Test Equipment Market Revenue Billion Forecast, by Application 2019 & 2032
- Table 82: Global Automated Test Equipment Market Volume units Forecast, by Application 2019 & 2032
- Table 83: Global Automated Test Equipment Market Revenue Billion Forecast, by End-User Industry 2019 & 2032
- Table 84: Global Automated Test Equipment Market Volume units Forecast, by End-User Industry 2019 & 2032
- Table 85: Global Automated Test Equipment Market Revenue Billion Forecast, by Country 2019 & 2032
- Table 86: Global Automated Test Equipment Market Volume units Forecast, by Country 2019 & 2032
- Table 87: Brazil Automated Test Equipment Market Revenue (Billion) Forecast, by Application 2019 & 2032
- Table 88: Brazil Automated Test Equipment Market Volume (units) Forecast, by Application 2019 & 2032
- Table 89: Mexico Automated Test Equipment Market Revenue (Billion) Forecast, by Application 2019 & 2032
- Table 90: Mexico Automated Test Equipment Market Volume (units) Forecast, by Application 2019 & 2032
- Table 91: Argentina Automated Test Equipment Market Revenue (Billion) Forecast, by Application 2019 & 2032
- Table 92: Argentina Automated Test Equipment Market Volume (units) Forecast, by Application 2019 & 2032
- Table 93: Rest of Latin America Automated Test Equipment Market Revenue (Billion) Forecast, by Application 2019 & 2032
- Table 94: Rest of Latin America Automated Test Equipment Market Volume (units) Forecast, by Application 2019 & 2032
- Table 95: Global Automated Test Equipment Market Revenue Billion Forecast, by ATE 2019 & 2032
- Table 96: Global Automated Test Equipment Market Volume units Forecast, by ATE 2019 & 2032
- Table 97: Global Automated Test Equipment Market Revenue Billion Forecast, by Product 2019 & 2032
- Table 98: Global Automated Test Equipment Market Volume units Forecast, by Product 2019 & 2032
- Table 99: Global Automated Test Equipment Market Revenue Billion Forecast, by Application 2019 & 2032
- Table 100: Global Automated Test Equipment Market Volume units Forecast, by Application 2019 & 2032
- Table 101: Global Automated Test Equipment Market Revenue Billion Forecast, by End-User Industry 2019 & 2032
- Table 102: Global Automated Test Equipment Market Volume units Forecast, by End-User Industry 2019 & 2032
- Table 103: Global Automated Test Equipment Market Revenue Billion Forecast, by Country 2019 & 2032
- Table 104: Global Automated Test Equipment Market Volume units Forecast, by Country 2019 & 2032
- Table 105: South Africa Automated Test Equipment Market Revenue (Billion) Forecast, by Application 2019 & 2032
- Table 106: South Africa Automated Test Equipment Market Volume (units) Forecast, by Application 2019 & 2032
- Table 107: UAE Automated Test Equipment Market Revenue (Billion) Forecast, by Application 2019 & 2032
- Table 108: UAE Automated Test Equipment Market Volume (units) Forecast, by Application 2019 & 2032
- Table 109: Saudi Arabia Automated Test Equipment Market Revenue (Billion) Forecast, by Application 2019 & 2032
- Table 110: Saudi Arabia Automated Test Equipment Market Volume (units) Forecast, by Application 2019 & 2032
- Table 111: Rest of MEA Automated Test Equipment Market Revenue (Billion) Forecast, by Application 2019 & 2032
- Table 112: Rest of MEA Automated Test Equipment Market Volume (units) Forecast, by Application 2019 & 2032
STEP 1 - Identification of Relevant Samples Size from Population Database


STEP 2 - Approaches for Defining Global Market Size (Value, Volume* & Price*)

Note* : In applicable scenarios
STEP 3 - Data Sources
Primary Research
- Web Analytics
- Survey Reports
- Research Institute
- Latest Research Reports
- Opinion Leaders
Secondary Research
- Annual Reports
- White Paper
- Latest Press Release
- Industry Association
- Paid Database
- Investor Presentations

STEP 4 - Data Triangulation
Involves using different sources of information in order to increase the validity of a study
These sources are likely to be stakeholders in a program - participants, other researchers, program staff, other community members, and so on.
Then we put all data in single framework & apply various statistical tools to find out the dynamic on the market.
During the analysis stage, feedback from the stakeholder groups would be compared to determine areas of agreement as well as areas of divergence
Frequently Asked Questions
Related Reports
See the similar reports


About Market Insights Report
Market Insights Reports offers comprehensive market research reports and analysis, giving businesses important information about their clients, rivals, and sector to help them make well-informed decisions on operations, marketing, and business strategy. We offer a variety of services in addition to market research, data analysis, and strategy planning. In order to find opportunities and learn more about our competitors and the industry at large, we employ competitive analysis. To identify areas for development, we also evaluate our performance against that of our rivals. We can determine the places at which we can offer our clients the most value by performing value chain analysis.
Additionally, clients receive a thorough overview of their industry business environment. We can find trends that help us forecast future possibilities and threats by examining global macroeconomic dynamics and consumer behavior patterns. By analyzing their features and advantages, contrasting them with comparable items on the market, and evaluating both their quantitative and qualitative performance, we comprehensively evaluate our clients' products. This allows us to assist customers in determining how their goods compare to those of their rivals and in creating successful marketing plans. Our group has been successful in gaining a thorough grasp of our clients' requirements and offering them creative solutions. We currently provide services to more than 50 nations in Europe, the Middle East, Africa, Latin America, Asia Pacific, and North America. Because of our global reach, we have been able to establish trusting bonds with our partners and clients in various nations, improving customer service and forging a more cohesive worldwide presence.