
.jpg&w=3840&q=100)
Market
Insights
Reports delivered globally, covering a wide range of industries and sectors.
Clients who trust our expertise and rely on our insights for business decisions.
Managed Reports, ensuring seamless updates and premium service.
Satisfied Customers, committed to delivering exceptional value and quality.
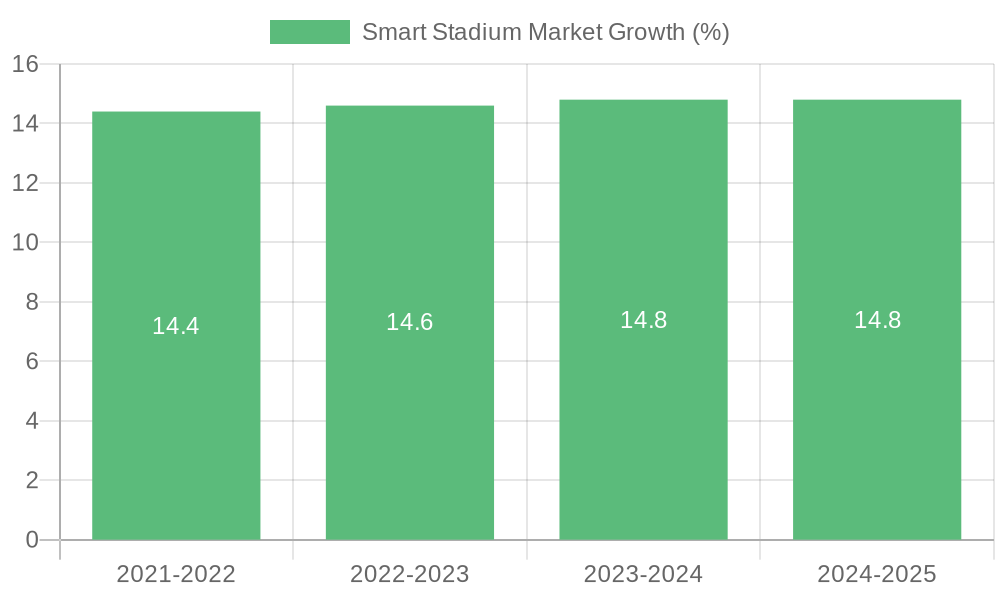
Smart Stadium Market Decade Long Trends, Analysis and Forecast 2025-2033
Smart Stadium Market by Offering (Solution, Services), by Deployment (On-premises, Cloud-based), by Capacity (Small (capacity up to 5, 000), Medium (capacity 5, 001-15, 000), Large (capacity above 15, 000)), by End User (Sport Venues, Concert Venues, Stadiums, Others), by North America (U.S., Canada), by Europe (Germany, UK, France, Italy, Spain, Rest of Europe), by Asia Pacific (China, Japan, India, South Korea, ANZ, Rest of Asia Pacific), by Latin America (Brazil, Mexico, Rest of Latin America), by MEA (UAE, Saudi Arabia, South Africa, Rest of MEA) Forecast 2025-2033
Smart Stadium Market Decade Long Trends, Analysis and Forecast 2025-2033
Key Insights
The Smart Stadium market is experiencing robust growth, projected to reach $15.47 billion in 2025 and exhibiting a Compound Annual Growth Rate (CAGR) of 19.5%. This expansion is driven by several key factors. Firstly, the increasing demand for enhanced fan experience is a major catalyst. Smart stadium solutions, encompassing advanced technologies like IoT-enabled infrastructure, AI-powered analytics, and immersive digital experiences, significantly improve fan engagement and satisfaction, leading to increased revenue streams for stadium owners. Secondly, the rising adoption of cloud-based solutions offers scalability and cost-effectiveness, making smart stadium technologies more accessible to venues of all sizes. The integration of these technologies also improves operational efficiency, allowing for better crowd management, security enhancement, and resource optimization. Finally, the growing popularity of sports and entertainment events globally fuels the demand for advanced infrastructure capable of handling large crowds and providing a seamless experience. The market is segmented by offering (solutions and services), deployment (on-premises and cloud-based), capacity (small, medium, and large), and end-user (sport venues, concert venues, stadiums, and others). North America currently holds a significant market share due to early adoption and technological advancements, but the Asia-Pacific region is expected to witness substantial growth in the coming years fueled by increasing investments in infrastructure and rising disposable incomes.
The competitive landscape is characterized by a mix of established technology providers and specialized stadium solutions companies. Key players like Cisco, IBM, Intel, Huawei, NEC, Johnson Controls, and Honeywell are actively investing in developing and deploying cutting-edge technologies for smart stadiums. The market is poised for continued growth, driven by ongoing technological advancements, increasing demand for data-driven insights, and the persistent focus on enhancing the overall fan experience. Future growth will likely be influenced by factors like 5G rollout, further development of AI and machine learning applications within stadiums, and the increasing integration of sustainable technologies aimed at reducing environmental impact. The market segmentation will continue to evolve as new technologies and use cases emerge, creating opportunities for both established players and new entrants.

Smart Stadium Market Concentration & Characteristics
The smart stadium market is moderately concentrated, with a handful of large technology providers like Cisco, IBM, and Huawei holding significant market share. However, the market exhibits a high degree of fragmentation at the solution provider level, with numerous smaller companies specializing in specific areas such as access control, digital signage, or analytics. Innovation is driven by advancements in areas like AI, IoT, 5G connectivity, and data analytics, enabling enhanced fan experience, optimized operations, and increased revenue generation for stadium owners.
- Concentration Areas: Large technology vendors in networking, security, and data management dominate the core infrastructure solutions. Smaller companies specialize in niche applications and integration services.
- Characteristics of Innovation: Focus on improving fan engagement (e.g., personalized experiences, interactive apps), enhancing operational efficiency (e.g., predictive maintenance, resource optimization), and boosting revenue streams (e.g., dynamic pricing, targeted advertising).
- Impact of Regulations: Data privacy regulations (GDPR, CCPA) and security standards (e.g., NIST Cybersecurity Framework) heavily influence system design and implementation. Compliance costs represent a significant factor.
- Product Substitutes: While direct substitutes are limited, improvements in traditional stadium infrastructure (e.g., better Wi-Fi) can partially mitigate the need for some smart stadium features.
- End User Concentration: Large, multi-purpose stadiums and arenas constitute the largest segment of end-users, with significant influence on market trends and demand for advanced solutions.
- Level of M&A: Moderate M&A activity is expected as larger players seek to expand their product portfolios and gain access to new technologies and expertise. The market value of M&A activities in this space is estimated to be around $2 Billion annually.
Smart Stadium Market Trends
The smart stadium market is experiencing rapid growth driven by several key trends. The increasing demand for enhanced fan experiences is pushing the adoption of technologies like personalized mobile apps, interactive displays, and immersive entertainment systems. Stadium owners are also focusing on improving operational efficiency through predictive maintenance, optimized energy consumption, and streamlined resource management. Furthermore, the integration of data analytics is providing valuable insights into fan behavior, enabling more effective marketing strategies and revenue generation. The use of 5G technology offers possibilities for high-bandwidth applications, enhancing connectivity and streaming capabilities. Sustainability is also emerging as a critical factor, with stadium operators adopting solutions to minimize their environmental impact. Finally, the increasing focus on safety and security is driving adoption of advanced security systems and crowd management solutions. These converging trends are shaping the market towards a more data-driven, fan-centric, and sustainable future.
Key Region or Country & Segment to Dominate the Market
The North American market, particularly the U.S., is projected to dominate the smart stadium market due to the high concentration of large sporting and entertainment venues and the early adoption of advanced technologies. Within the segments, the "Large" capacity segment (capacity above 15,000) is expected to lead the market because of the greater need for advanced infrastructure and technologies. The large-scale deployments in major stadiums often influence overall technological advancements.
- North America (U.S.): High adoption rate of new technologies, substantial investment in sports and entertainment infrastructure, and the presence of major technology providers contribute to the region's dominance.
- Large Capacity Segment: The need for robust and scalable systems to support high attendance and diverse applications is driving demand in this segment. This requires substantial initial investments but results in higher return on investments and better experience.
- Solutions Offering: Solutions are in higher demand, and are usually followed by the needed services. The need for the solutions segment to be higher in demand will push the market value higher as the smart stadium market expands.
The overall market value is predicted to exceed $15 Billion by 2028. The large capacity segment is anticipated to account for approximately 60% of this value, owing to its higher technological requirements and substantial upfront investment.
Smart Stadium Market Product Insights Report Coverage & Deliverables
This report provides a comprehensive analysis of the smart stadium market, covering market size and growth projections, key market trends and drivers, regional and segmental analysis, competitive landscape, and future outlook. The report offers insights into product categories, including solutions (e.g., access control, security systems, digital signage) and services (e.g., consulting, integration, maintenance). It also analyzes the deployment models (on-premises and cloud-based) and capacity segments (small, medium, large). The deliverables include market sizing, segmentation, competitive landscape assessment, and future forecast.
Smart Stadium Market Analysis
The global smart stadium market is experiencing robust growth, driven by increasing investments in stadium infrastructure and the rising demand for enhanced fan experiences and operational efficiencies. The market size was estimated at approximately $8 Billion in 2023 and is projected to reach $15 Billion by 2028, exhibiting a Compound Annual Growth Rate (CAGR) of around 15%. This growth is attributed to several factors, including the widespread adoption of 5G technology, the increasing integration of IoT devices, and advancements in data analytics and artificial intelligence. Key players are focusing on innovative solutions to cater to evolving fan expectations and improve stadium operations. The market share is currently dominated by a few large technology providers, but the presence of several smaller companies catering to specialized needs contributes to a dynamic competitive landscape.
Smart Stadium Market Regional Insights
- North America
- U.S.: Leading market due to high adoption of technology and substantial investments.
- Canada: Moderate growth, driven by investments in major sporting venues.
- Europe
- Germany, UK, France, Italy, Spain: Significant market presence, driven by modernization initiatives in existing stadiums.
- Rest of Europe: Growing market, with increasing adoption of smart stadium technologies.
- Asia Pacific
- China, Japan, India: Rapid growth, driven by increasing investments in new stadium construction and upgrades.
- South Korea, ANZ, Rest of Asia Pacific: Emerging markets, with potential for strong future growth.
- Latin America
- Brazil, Mexico: Moderate growth, with increasing focus on improving fan experience and stadium operations.
- Rest of Latin America: Limited growth, due to lower investment in stadium infrastructure.
- MEA
- UAE, Saudi Arabia, South Africa: Growing market, with investment in large-scale sporting events.
- Rest of MEA: Limited market size, due to lower investment in stadium infrastructure.
Driving Forces: What's Propelling the Smart Stadium Market
The increasing demand for enhanced fan experiences, the need for improved operational efficiency, the growing adoption of advanced technologies like AI and IoT, and the expanding use of 5G networks are the primary drivers of the smart stadium market growth. The focus on data analytics to optimize revenue generation and improve security are also crucial factors.
Challenges and Restraints in Smart Stadium Market
High initial investment costs, the complexity of integrating various systems, concerns about data security and privacy, and the need for skilled workforce to operate and maintain the systems are the major challenges faced by stadium operators. The lack of standardized technologies can also create compatibility issues.
Emerging Trends in Smart Stadium Market
The integration of edge computing for real-time data processing, the use of augmented reality (AR) and virtual reality (VR) to enhance the fan experience, the growing adoption of blockchain technology for secure ticketing and access control, and the increasing focus on sustainability initiatives are emerging trends that are shaping the smart stadium market.
Smart Stadium Industry News
- May 2024: Ericsson and Tele2 partnered to bring 5G technology to Friends Arena in Stockholm.
- February 2023: Fujitsu and EintrachtTech GmbH partnered to develop sustainable solutions for Deutsche Bank Park.
Leading Players in the Smart Stadium Market
- Cisco Systems, Inc.
- IBM Corporation
- Intel Corporation
- Huawei Technologies Co., Ltd.
- NEC Corporation
- Johnson Controls International plc
- Honeywell International Inc.
Smart Stadium Market Segmentation
-
1. Offering
- 1.1. Solution
- 1.2. Services
-
2. Deployment
- 2.1. On-premises
- 2.2. Cloud-based
-
3. Capacity
- 3.1. Small (capacity up to 5,000)
- 3.2. Medium (capacity 5,001-15,000)
- 3.3. Large (capacity above 15,000)
-
4. End User
- 4.1. Sport Venues
- 4.2. Concert Venues
- 4.3. Stadiums
- 4.4. Others
Smart Stadium Market Segmentation By Geography
-
1. North America
- 1.1. U.S.
- 1.2. Canada
-
2. Europe
- 2.1. Germany
- 2.2. UK
- 2.3. France
- 2.4. Italy
- 2.5. Spain
- 2.6. Rest of Europe
-
3. Asia Pacific
- 3.1. China
- 3.2. Japan
- 3.3. India
- 3.4. South Korea
- 3.5. ANZ
- 3.6. Rest of Asia Pacific
-
4. Latin America
- 4.1. Brazil
- 4.2. Mexico
- 4.3. Rest of Latin America
-
5. MEA
- 5.1. UAE
- 5.2. Saudi Arabia
- 5.3. South Africa
- 5.4. Rest of MEA

Smart Stadium Market REPORT HIGHLIGHTS
| Aspects | Details |
|---|---|
| Study Period | 2019-2033 |
| Base Year | 2024 |
| Estimated Year | 2025 |
| Forecast Period | 2025-2033 |
| Historical Period | 2019-2024 |
| Growth Rate | CAGR of 19.5% from 2019-2033 |
| Segmentation |
|
- 1. Introduction
- 1.1. Research Scope
- 1.2. Market Segmentation
- 1.3. Research Methodology
- 1.4. Definitions and Assumptions
- 2. Executive Summary
- 2.1. Introduction
- 3. Market Dynamics
- 3.1. Introduction
- 3.2. Market Drivers
- 3.2.1 Increasing investment in smart stadium
- 3.2.2 Technological advancements
- 3.2.3 Enhanced fan experience
- 3.2.4 Revenue generation opportunities
- 3.2.5 Operational efficiency and cost savings
- 3.3. Market Restrains
- 3.3.1 High initial investment and implementation costs
- 3.3.2 Data privacy and security concerns
- 3.4. Market Trends
- 4. Market Factor Analysis
- 4.1. Porters Five Forces
- 4.2. Supply/Value Chain
- 4.3. PESTEL analysis
- 4.4. Market Entropy
- 4.5. Patent/Trademark Analysis
- 5. Global Smart Stadium Market Analysis, Insights and Forecast, 2019-2031
- 5.1. Market Analysis, Insights and Forecast - by Offering
- 5.1.1. Solution
- 5.1.2. Services
- 5.2. Market Analysis, Insights and Forecast - by Deployment
- 5.2.1. On-premises
- 5.2.2. Cloud-based
- 5.3. Market Analysis, Insights and Forecast - by Capacity
- 5.3.1. Small (capacity up to 5,000)
- 5.3.2. Medium (capacity 5,001-15,000)
- 5.3.3. Large (capacity above 15,000)
- 5.4. Market Analysis, Insights and Forecast - by End User
- 5.4.1. Sport Venues
- 5.4.2. Concert Venues
- 5.4.3. Stadiums
- 5.4.4. Others
- 5.5. Market Analysis, Insights and Forecast - by Region
- 5.5.1. North America
- 5.5.2. Europe
- 5.5.3. Asia Pacific
- 5.5.4. Latin America
- 5.5.5. MEA
- 5.1. Market Analysis, Insights and Forecast - by Offering
- 6. North America Smart Stadium Market Analysis, Insights and Forecast, 2019-2031
- 6.1. Market Analysis, Insights and Forecast - by Offering
- 6.1.1. Solution
- 6.1.2. Services
- 6.2. Market Analysis, Insights and Forecast - by Deployment
- 6.2.1. On-premises
- 6.2.2. Cloud-based
- 6.3. Market Analysis, Insights and Forecast - by Capacity
- 6.3.1. Small (capacity up to 5,000)
- 6.3.2. Medium (capacity 5,001-15,000)
- 6.3.3. Large (capacity above 15,000)
- 6.4. Market Analysis, Insights and Forecast - by End User
- 6.4.1. Sport Venues
- 6.4.2. Concert Venues
- 6.4.3. Stadiums
- 6.4.4. Others
- 6.1. Market Analysis, Insights and Forecast - by Offering
- 7. Europe Smart Stadium Market Analysis, Insights and Forecast, 2019-2031
- 7.1. Market Analysis, Insights and Forecast - by Offering
- 7.1.1. Solution
- 7.1.2. Services
- 7.2. Market Analysis, Insights and Forecast - by Deployment
- 7.2.1. On-premises
- 7.2.2. Cloud-based
- 7.3. Market Analysis, Insights and Forecast - by Capacity
- 7.3.1. Small (capacity up to 5,000)
- 7.3.2. Medium (capacity 5,001-15,000)
- 7.3.3. Large (capacity above 15,000)
- 7.4. Market Analysis, Insights and Forecast - by End User
- 7.4.1. Sport Venues
- 7.4.2. Concert Venues
- 7.4.3. Stadiums
- 7.4.4. Others
- 7.1. Market Analysis, Insights and Forecast - by Offering
- 8. Asia Pacific Smart Stadium Market Analysis, Insights and Forecast, 2019-2031
- 8.1. Market Analysis, Insights and Forecast - by Offering
- 8.1.1. Solution
- 8.1.2. Services
- 8.2. Market Analysis, Insights and Forecast - by Deployment
- 8.2.1. On-premises
- 8.2.2. Cloud-based
- 8.3. Market Analysis, Insights and Forecast - by Capacity
- 8.3.1. Small (capacity up to 5,000)
- 8.3.2. Medium (capacity 5,001-15,000)
- 8.3.3. Large (capacity above 15,000)
- 8.4. Market Analysis, Insights and Forecast - by End User
- 8.4.1. Sport Venues
- 8.4.2. Concert Venues
- 8.4.3. Stadiums
- 8.4.4. Others
- 8.1. Market Analysis, Insights and Forecast - by Offering
- 9. Latin America Smart Stadium Market Analysis, Insights and Forecast, 2019-2031
- 9.1. Market Analysis, Insights and Forecast - by Offering
- 9.1.1. Solution
- 9.1.2. Services
- 9.2. Market Analysis, Insights and Forecast - by Deployment
- 9.2.1. On-premises
- 9.2.2. Cloud-based
- 9.3. Market Analysis, Insights and Forecast - by Capacity
- 9.3.1. Small (capacity up to 5,000)
- 9.3.2. Medium (capacity 5,001-15,000)
- 9.3.3. Large (capacity above 15,000)
- 9.4. Market Analysis, Insights and Forecast - by End User
- 9.4.1. Sport Venues
- 9.4.2. Concert Venues
- 9.4.3. Stadiums
- 9.4.4. Others
- 9.1. Market Analysis, Insights and Forecast - by Offering
- 10. MEA Smart Stadium Market Analysis, Insights and Forecast, 2019-2031
- 10.1. Market Analysis, Insights and Forecast - by Offering
- 10.1.1. Solution
- 10.1.2. Services
- 10.2. Market Analysis, Insights and Forecast - by Deployment
- 10.2.1. On-premises
- 10.2.2. Cloud-based
- 10.3. Market Analysis, Insights and Forecast - by Capacity
- 10.3.1. Small (capacity up to 5,000)
- 10.3.2. Medium (capacity 5,001-15,000)
- 10.3.3. Large (capacity above 15,000)
- 10.4. Market Analysis, Insights and Forecast - by End User
- 10.4.1. Sport Venues
- 10.4.2. Concert Venues
- 10.4.3. Stadiums
- 10.4.4. Others
- 10.1. Market Analysis, Insights and Forecast - by Offering
- 11. Competitive Analysis
- 11.1. Global Market Share Analysis 2024
- 11.2. Company Profiles
- 11.2.1 Cisco Systems Inc.
- 11.2.1.1. Overview
- 11.2.1.2. Products
- 11.2.1.3. SWOT Analysis
- 11.2.1.4. Recent Developments
- 11.2.1.5. Financials (Based on Availability)
- 11.2.2 IBM Corporation
- 11.2.2.1. Overview
- 11.2.2.2. Products
- 11.2.2.3. SWOT Analysis
- 11.2.2.4. Recent Developments
- 11.2.2.5. Financials (Based on Availability)
- 11.2.3 Intel Corporation
- 11.2.3.1. Overview
- 11.2.3.2. Products
- 11.2.3.3. SWOT Analysis
- 11.2.3.4. Recent Developments
- 11.2.3.5. Financials (Based on Availability)
- 11.2.4 Huawei Technologies Co. Ltd.
- 11.2.4.1. Overview
- 11.2.4.2. Products
- 11.2.4.3. SWOT Analysis
- 11.2.4.4. Recent Developments
- 11.2.4.5. Financials (Based on Availability)
- 11.2.5 NEC Corporation
- 11.2.5.1. Overview
- 11.2.5.2. Products
- 11.2.5.3. SWOT Analysis
- 11.2.5.4. Recent Developments
- 11.2.5.5. Financials (Based on Availability)
- 11.2.6 Johnson Controls International plc
- 11.2.6.1. Overview
- 11.2.6.2. Products
- 11.2.6.3. SWOT Analysis
- 11.2.6.4. Recent Developments
- 11.2.6.5. Financials (Based on Availability)
- 11.2.7 Honeywell International Inc.
- 11.2.7.1. Overview
- 11.2.7.2. Products
- 11.2.7.3. SWOT Analysis
- 11.2.7.4. Recent Developments
- 11.2.7.5. Financials (Based on Availability)
- 11.2.1 Cisco Systems Inc.
- Figure 1: Global Smart Stadium Market Revenue Breakdown (Billion, %) by Region 2024 & 2032
- Figure 2: Global Smart Stadium Market Volume Breakdown (K Units, %) by Region 2024 & 2032
- Figure 3: North America Smart Stadium Market Revenue (Billion), by Offering 2024 & 2032
- Figure 4: North America Smart Stadium Market Volume (K Units), by Offering 2024 & 2032
- Figure 5: North America Smart Stadium Market Revenue Share (%), by Offering 2024 & 2032
- Figure 6: North America Smart Stadium Market Volume Share (%), by Offering 2024 & 2032
- Figure 7: North America Smart Stadium Market Revenue (Billion), by Deployment 2024 & 2032
- Figure 8: North America Smart Stadium Market Volume (K Units), by Deployment 2024 & 2032
- Figure 9: North America Smart Stadium Market Revenue Share (%), by Deployment 2024 & 2032
- Figure 10: North America Smart Stadium Market Volume Share (%), by Deployment 2024 & 2032
- Figure 11: North America Smart Stadium Market Revenue (Billion), by Capacity 2024 & 2032
- Figure 12: North America Smart Stadium Market Volume (K Units), by Capacity 2024 & 2032
- Figure 13: North America Smart Stadium Market Revenue Share (%), by Capacity 2024 & 2032
- Figure 14: North America Smart Stadium Market Volume Share (%), by Capacity 2024 & 2032
- Figure 15: North America Smart Stadium Market Revenue (Billion), by End User 2024 & 2032
- Figure 16: North America Smart Stadium Market Volume (K Units), by End User 2024 & 2032
- Figure 17: North America Smart Stadium Market Revenue Share (%), by End User 2024 & 2032
- Figure 18: North America Smart Stadium Market Volume Share (%), by End User 2024 & 2032
- Figure 19: North America Smart Stadium Market Revenue (Billion), by Country 2024 & 2032
- Figure 20: North America Smart Stadium Market Volume (K Units), by Country 2024 & 2032
- Figure 21: North America Smart Stadium Market Revenue Share (%), by Country 2024 & 2032
- Figure 22: North America Smart Stadium Market Volume Share (%), by Country 2024 & 2032
- Figure 23: Europe Smart Stadium Market Revenue (Billion), by Offering 2024 & 2032
- Figure 24: Europe Smart Stadium Market Volume (K Units), by Offering 2024 & 2032
- Figure 25: Europe Smart Stadium Market Revenue Share (%), by Offering 2024 & 2032
- Figure 26: Europe Smart Stadium Market Volume Share (%), by Offering 2024 & 2032
- Figure 27: Europe Smart Stadium Market Revenue (Billion), by Deployment 2024 & 2032
- Figure 28: Europe Smart Stadium Market Volume (K Units), by Deployment 2024 & 2032
- Figure 29: Europe Smart Stadium Market Revenue Share (%), by Deployment 2024 & 2032
- Figure 30: Europe Smart Stadium Market Volume Share (%), by Deployment 2024 & 2032
- Figure 31: Europe Smart Stadium Market Revenue (Billion), by Capacity 2024 & 2032
- Figure 32: Europe Smart Stadium Market Volume (K Units), by Capacity 2024 & 2032
- Figure 33: Europe Smart Stadium Market Revenue Share (%), by Capacity 2024 & 2032
- Figure 34: Europe Smart Stadium Market Volume Share (%), by Capacity 2024 & 2032
- Figure 35: Europe Smart Stadium Market Revenue (Billion), by End User 2024 & 2032
- Figure 36: Europe Smart Stadium Market Volume (K Units), by End User 2024 & 2032
- Figure 37: Europe Smart Stadium Market Revenue Share (%), by End User 2024 & 2032
- Figure 38: Europe Smart Stadium Market Volume Share (%), by End User 2024 & 2032
- Figure 39: Europe Smart Stadium Market Revenue (Billion), by Country 2024 & 2032
- Figure 40: Europe Smart Stadium Market Volume (K Units), by Country 2024 & 2032
- Figure 41: Europe Smart Stadium Market Revenue Share (%), by Country 2024 & 2032
- Figure 42: Europe Smart Stadium Market Volume Share (%), by Country 2024 & 2032
- Figure 43: Asia Pacific Smart Stadium Market Revenue (Billion), by Offering 2024 & 2032
- Figure 44: Asia Pacific Smart Stadium Market Volume (K Units), by Offering 2024 & 2032
- Figure 45: Asia Pacific Smart Stadium Market Revenue Share (%), by Offering 2024 & 2032
- Figure 46: Asia Pacific Smart Stadium Market Volume Share (%), by Offering 2024 & 2032
- Figure 47: Asia Pacific Smart Stadium Market Revenue (Billion), by Deployment 2024 & 2032
- Figure 48: Asia Pacific Smart Stadium Market Volume (K Units), by Deployment 2024 & 2032
- Figure 49: Asia Pacific Smart Stadium Market Revenue Share (%), by Deployment 2024 & 2032
- Figure 50: Asia Pacific Smart Stadium Market Volume Share (%), by Deployment 2024 & 2032
- Figure 51: Asia Pacific Smart Stadium Market Revenue (Billion), by Capacity 2024 & 2032
- Figure 52: Asia Pacific Smart Stadium Market Volume (K Units), by Capacity 2024 & 2032
- Figure 53: Asia Pacific Smart Stadium Market Revenue Share (%), by Capacity 2024 & 2032
- Figure 54: Asia Pacific Smart Stadium Market Volume Share (%), by Capacity 2024 & 2032
- Figure 55: Asia Pacific Smart Stadium Market Revenue (Billion), by End User 2024 & 2032
- Figure 56: Asia Pacific Smart Stadium Market Volume (K Units), by End User 2024 & 2032
- Figure 57: Asia Pacific Smart Stadium Market Revenue Share (%), by End User 2024 & 2032
- Figure 58: Asia Pacific Smart Stadium Market Volume Share (%), by End User 2024 & 2032
- Figure 59: Asia Pacific Smart Stadium Market Revenue (Billion), by Country 2024 & 2032
- Figure 60: Asia Pacific Smart Stadium Market Volume (K Units), by Country 2024 & 2032
- Figure 61: Asia Pacific Smart Stadium Market Revenue Share (%), by Country 2024 & 2032
- Figure 62: Asia Pacific Smart Stadium Market Volume Share (%), by Country 2024 & 2032
- Figure 63: Latin America Smart Stadium Market Revenue (Billion), by Offering 2024 & 2032
- Figure 64: Latin America Smart Stadium Market Volume (K Units), by Offering 2024 & 2032
- Figure 65: Latin America Smart Stadium Market Revenue Share (%), by Offering 2024 & 2032
- Figure 66: Latin America Smart Stadium Market Volume Share (%), by Offering 2024 & 2032
- Figure 67: Latin America Smart Stadium Market Revenue (Billion), by Deployment 2024 & 2032
- Figure 68: Latin America Smart Stadium Market Volume (K Units), by Deployment 2024 & 2032
- Figure 69: Latin America Smart Stadium Market Revenue Share (%), by Deployment 2024 & 2032
- Figure 70: Latin America Smart Stadium Market Volume Share (%), by Deployment 2024 & 2032
- Figure 71: Latin America Smart Stadium Market Revenue (Billion), by Capacity 2024 & 2032
- Figure 72: Latin America Smart Stadium Market Volume (K Units), by Capacity 2024 & 2032
- Figure 73: Latin America Smart Stadium Market Revenue Share (%), by Capacity 2024 & 2032
- Figure 74: Latin America Smart Stadium Market Volume Share (%), by Capacity 2024 & 2032
- Figure 75: Latin America Smart Stadium Market Revenue (Billion), by End User 2024 & 2032
- Figure 76: Latin America Smart Stadium Market Volume (K Units), by End User 2024 & 2032
- Figure 77: Latin America Smart Stadium Market Revenue Share (%), by End User 2024 & 2032
- Figure 78: Latin America Smart Stadium Market Volume Share (%), by End User 2024 & 2032
- Figure 79: Latin America Smart Stadium Market Revenue (Billion), by Country 2024 & 2032
- Figure 80: Latin America Smart Stadium Market Volume (K Units), by Country 2024 & 2032
- Figure 81: Latin America Smart Stadium Market Revenue Share (%), by Country 2024 & 2032
- Figure 82: Latin America Smart Stadium Market Volume Share (%), by Country 2024 & 2032
- Figure 83: MEA Smart Stadium Market Revenue (Billion), by Offering 2024 & 2032
- Figure 84: MEA Smart Stadium Market Volume (K Units), by Offering 2024 & 2032
- Figure 85: MEA Smart Stadium Market Revenue Share (%), by Offering 2024 & 2032
- Figure 86: MEA Smart Stadium Market Volume Share (%), by Offering 2024 & 2032
- Figure 87: MEA Smart Stadium Market Revenue (Billion), by Deployment 2024 & 2032
- Figure 88: MEA Smart Stadium Market Volume (K Units), by Deployment 2024 & 2032
- Figure 89: MEA Smart Stadium Market Revenue Share (%), by Deployment 2024 & 2032
- Figure 90: MEA Smart Stadium Market Volume Share (%), by Deployment 2024 & 2032
- Figure 91: MEA Smart Stadium Market Revenue (Billion), by Capacity 2024 & 2032
- Figure 92: MEA Smart Stadium Market Volume (K Units), by Capacity 2024 & 2032
- Figure 93: MEA Smart Stadium Market Revenue Share (%), by Capacity 2024 & 2032
- Figure 94: MEA Smart Stadium Market Volume Share (%), by Capacity 2024 & 2032
- Figure 95: MEA Smart Stadium Market Revenue (Billion), by End User 2024 & 2032
- Figure 96: MEA Smart Stadium Market Volume (K Units), by End User 2024 & 2032
- Figure 97: MEA Smart Stadium Market Revenue Share (%), by End User 2024 & 2032
- Figure 98: MEA Smart Stadium Market Volume Share (%), by End User 2024 & 2032
- Figure 99: MEA Smart Stadium Market Revenue (Billion), by Country 2024 & 2032
- Figure 100: MEA Smart Stadium Market Volume (K Units), by Country 2024 & 2032
- Figure 101: MEA Smart Stadium Market Revenue Share (%), by Country 2024 & 2032
- Figure 102: MEA Smart Stadium Market Volume Share (%), by Country 2024 & 2032
- Table 1: Global Smart Stadium Market Revenue Billion Forecast, by Region 2019 & 2032
- Table 2: Global Smart Stadium Market Volume K Units Forecast, by Region 2019 & 2032
- Table 3: Global Smart Stadium Market Revenue Billion Forecast, by Offering 2019 & 2032
- Table 4: Global Smart Stadium Market Volume K Units Forecast, by Offering 2019 & 2032
- Table 5: Global Smart Stadium Market Revenue Billion Forecast, by Deployment 2019 & 2032
- Table 6: Global Smart Stadium Market Volume K Units Forecast, by Deployment 2019 & 2032
- Table 7: Global Smart Stadium Market Revenue Billion Forecast, by Capacity 2019 & 2032
- Table 8: Global Smart Stadium Market Volume K Units Forecast, by Capacity 2019 & 2032
- Table 9: Global Smart Stadium Market Revenue Billion Forecast, by End User 2019 & 2032
- Table 10: Global Smart Stadium Market Volume K Units Forecast, by End User 2019 & 2032
- Table 11: Global Smart Stadium Market Revenue Billion Forecast, by Region 2019 & 2032
- Table 12: Global Smart Stadium Market Volume K Units Forecast, by Region 2019 & 2032
- Table 13: Global Smart Stadium Market Revenue Billion Forecast, by Offering 2019 & 2032
- Table 14: Global Smart Stadium Market Volume K Units Forecast, by Offering 2019 & 2032
- Table 15: Global Smart Stadium Market Revenue Billion Forecast, by Deployment 2019 & 2032
- Table 16: Global Smart Stadium Market Volume K Units Forecast, by Deployment 2019 & 2032
- Table 17: Global Smart Stadium Market Revenue Billion Forecast, by Capacity 2019 & 2032
- Table 18: Global Smart Stadium Market Volume K Units Forecast, by Capacity 2019 & 2032
- Table 19: Global Smart Stadium Market Revenue Billion Forecast, by End User 2019 & 2032
- Table 20: Global Smart Stadium Market Volume K Units Forecast, by End User 2019 & 2032
- Table 21: Global Smart Stadium Market Revenue Billion Forecast, by Country 2019 & 2032
- Table 22: Global Smart Stadium Market Volume K Units Forecast, by Country 2019 & 2032
- Table 23: U.S. Smart Stadium Market Revenue (Billion) Forecast, by Application 2019 & 2032
- Table 24: U.S. Smart Stadium Market Volume (K Units) Forecast, by Application 2019 & 2032
- Table 25: Canada Smart Stadium Market Revenue (Billion) Forecast, by Application 2019 & 2032
- Table 26: Canada Smart Stadium Market Volume (K Units) Forecast, by Application 2019 & 2032
- Table 27: Global Smart Stadium Market Revenue Billion Forecast, by Offering 2019 & 2032
- Table 28: Global Smart Stadium Market Volume K Units Forecast, by Offering 2019 & 2032
- Table 29: Global Smart Stadium Market Revenue Billion Forecast, by Deployment 2019 & 2032
- Table 30: Global Smart Stadium Market Volume K Units Forecast, by Deployment 2019 & 2032
- Table 31: Global Smart Stadium Market Revenue Billion Forecast, by Capacity 2019 & 2032
- Table 32: Global Smart Stadium Market Volume K Units Forecast, by Capacity 2019 & 2032
- Table 33: Global Smart Stadium Market Revenue Billion Forecast, by End User 2019 & 2032
- Table 34: Global Smart Stadium Market Volume K Units Forecast, by End User 2019 & 2032
- Table 35: Global Smart Stadium Market Revenue Billion Forecast, by Country 2019 & 2032
- Table 36: Global Smart Stadium Market Volume K Units Forecast, by Country 2019 & 2032
- Table 37: Germany Smart Stadium Market Revenue (Billion) Forecast, by Application 2019 & 2032
- Table 38: Germany Smart Stadium Market Volume (K Units) Forecast, by Application 2019 & 2032
- Table 39: UK Smart Stadium Market Revenue (Billion) Forecast, by Application 2019 & 2032
- Table 40: UK Smart Stadium Market Volume (K Units) Forecast, by Application 2019 & 2032
- Table 41: France Smart Stadium Market Revenue (Billion) Forecast, by Application 2019 & 2032
- Table 42: France Smart Stadium Market Volume (K Units) Forecast, by Application 2019 & 2032
- Table 43: Italy Smart Stadium Market Revenue (Billion) Forecast, by Application 2019 & 2032
- Table 44: Italy Smart Stadium Market Volume (K Units) Forecast, by Application 2019 & 2032
- Table 45: Spain Smart Stadium Market Revenue (Billion) Forecast, by Application 2019 & 2032
- Table 46: Spain Smart Stadium Market Volume (K Units) Forecast, by Application 2019 & 2032
- Table 47: Rest of Europe Smart Stadium Market Revenue (Billion) Forecast, by Application 2019 & 2032
- Table 48: Rest of Europe Smart Stadium Market Volume (K Units) Forecast, by Application 2019 & 2032
- Table 49: Global Smart Stadium Market Revenue Billion Forecast, by Offering 2019 & 2032
- Table 50: Global Smart Stadium Market Volume K Units Forecast, by Offering 2019 & 2032
- Table 51: Global Smart Stadium Market Revenue Billion Forecast, by Deployment 2019 & 2032
- Table 52: Global Smart Stadium Market Volume K Units Forecast, by Deployment 2019 & 2032
- Table 53: Global Smart Stadium Market Revenue Billion Forecast, by Capacity 2019 & 2032
- Table 54: Global Smart Stadium Market Volume K Units Forecast, by Capacity 2019 & 2032
- Table 55: Global Smart Stadium Market Revenue Billion Forecast, by End User 2019 & 2032
- Table 56: Global Smart Stadium Market Volume K Units Forecast, by End User 2019 & 2032
- Table 57: Global Smart Stadium Market Revenue Billion Forecast, by Country 2019 & 2032
- Table 58: Global Smart Stadium Market Volume K Units Forecast, by Country 2019 & 2032
- Table 59: China Smart Stadium Market Revenue (Billion) Forecast, by Application 2019 & 2032
- Table 60: China Smart Stadium Market Volume (K Units) Forecast, by Application 2019 & 2032
- Table 61: Japan Smart Stadium Market Revenue (Billion) Forecast, by Application 2019 & 2032
- Table 62: Japan Smart Stadium Market Volume (K Units) Forecast, by Application 2019 & 2032
- Table 63: India Smart Stadium Market Revenue (Billion) Forecast, by Application 2019 & 2032
- Table 64: India Smart Stadium Market Volume (K Units) Forecast, by Application 2019 & 2032
- Table 65: South Korea Smart Stadium Market Revenue (Billion) Forecast, by Application 2019 & 2032
- Table 66: South Korea Smart Stadium Market Volume (K Units) Forecast, by Application 2019 & 2032
- Table 67: ANZ Smart Stadium Market Revenue (Billion) Forecast, by Application 2019 & 2032
- Table 68: ANZ Smart Stadium Market Volume (K Units) Forecast, by Application 2019 & 2032
- Table 69: Rest of Asia Pacific Smart Stadium Market Revenue (Billion) Forecast, by Application 2019 & 2032
- Table 70: Rest of Asia Pacific Smart Stadium Market Volume (K Units) Forecast, by Application 2019 & 2032
- Table 71: Global Smart Stadium Market Revenue Billion Forecast, by Offering 2019 & 2032
- Table 72: Global Smart Stadium Market Volume K Units Forecast, by Offering 2019 & 2032
- Table 73: Global Smart Stadium Market Revenue Billion Forecast, by Deployment 2019 & 2032
- Table 74: Global Smart Stadium Market Volume K Units Forecast, by Deployment 2019 & 2032
- Table 75: Global Smart Stadium Market Revenue Billion Forecast, by Capacity 2019 & 2032
- Table 76: Global Smart Stadium Market Volume K Units Forecast, by Capacity 2019 & 2032
- Table 77: Global Smart Stadium Market Revenue Billion Forecast, by End User 2019 & 2032
- Table 78: Global Smart Stadium Market Volume K Units Forecast, by End User 2019 & 2032
- Table 79: Global Smart Stadium Market Revenue Billion Forecast, by Country 2019 & 2032
- Table 80: Global Smart Stadium Market Volume K Units Forecast, by Country 2019 & 2032
- Table 81: Brazil Smart Stadium Market Revenue (Billion) Forecast, by Application 2019 & 2032
- Table 82: Brazil Smart Stadium Market Volume (K Units) Forecast, by Application 2019 & 2032
- Table 83: Mexico Smart Stadium Market Revenue (Billion) Forecast, by Application 2019 & 2032
- Table 84: Mexico Smart Stadium Market Volume (K Units) Forecast, by Application 2019 & 2032
- Table 85: Rest of Latin America Smart Stadium Market Revenue (Billion) Forecast, by Application 2019 & 2032
- Table 86: Rest of Latin America Smart Stadium Market Volume (K Units) Forecast, by Application 2019 & 2032
- Table 87: Global Smart Stadium Market Revenue Billion Forecast, by Offering 2019 & 2032
- Table 88: Global Smart Stadium Market Volume K Units Forecast, by Offering 2019 & 2032
- Table 89: Global Smart Stadium Market Revenue Billion Forecast, by Deployment 2019 & 2032
- Table 90: Global Smart Stadium Market Volume K Units Forecast, by Deployment 2019 & 2032
- Table 91: Global Smart Stadium Market Revenue Billion Forecast, by Capacity 2019 & 2032
- Table 92: Global Smart Stadium Market Volume K Units Forecast, by Capacity 2019 & 2032
- Table 93: Global Smart Stadium Market Revenue Billion Forecast, by End User 2019 & 2032
- Table 94: Global Smart Stadium Market Volume K Units Forecast, by End User 2019 & 2032
- Table 95: Global Smart Stadium Market Revenue Billion Forecast, by Country 2019 & 2032
- Table 96: Global Smart Stadium Market Volume K Units Forecast, by Country 2019 & 2032
- Table 97: UAE Smart Stadium Market Revenue (Billion) Forecast, by Application 2019 & 2032
- Table 98: UAE Smart Stadium Market Volume (K Units) Forecast, by Application 2019 & 2032
- Table 99: Saudi Arabia Smart Stadium Market Revenue (Billion) Forecast, by Application 2019 & 2032
- Table 100: Saudi Arabia Smart Stadium Market Volume (K Units) Forecast, by Application 2019 & 2032
- Table 101: South Africa Smart Stadium Market Revenue (Billion) Forecast, by Application 2019 & 2032
- Table 102: South Africa Smart Stadium Market Volume (K Units) Forecast, by Application 2019 & 2032
- Table 103: Rest of MEA Smart Stadium Market Revenue (Billion) Forecast, by Application 2019 & 2032
- Table 104: Rest of MEA Smart Stadium Market Volume (K Units) Forecast, by Application 2019 & 2032
STEP 1 - Identification of Relevant Samples Size from Population Database


STEP 2 - Approaches for Defining Global Market Size (Value, Volume* & Price*)

Note* : In applicable scenarios
STEP 3 - Data Sources
Primary Research
- Web Analytics
- Survey Reports
- Research Institute
- Latest Research Reports
- Opinion Leaders
Secondary Research
- Annual Reports
- White Paper
- Latest Press Release
- Industry Association
- Paid Database
- Investor Presentations

STEP 4 - Data Triangulation
Involves using different sources of information in order to increase the validity of a study
These sources are likely to be stakeholders in a program - participants, other researchers, program staff, other community members, and so on.
Then we put all data in single framework & apply various statistical tools to find out the dynamic on the market.
During the analysis stage, feedback from the stakeholder groups would be compared to determine areas of agreement as well as areas of divergence
Frequently Asked Questions
Related Reports
See the similar reports


About Market Insights Report
Market Insights Reports offers comprehensive market research reports and analysis, giving businesses important information about their clients, rivals, and sector to help them make well-informed decisions on operations, marketing, and business strategy. We offer a variety of services in addition to market research, data analysis, and strategy planning. In order to find opportunities and learn more about our competitors and the industry at large, we employ competitive analysis. To identify areas for development, we also evaluate our performance against that of our rivals. We can determine the places at which we can offer our clients the most value by performing value chain analysis.
Additionally, clients receive a thorough overview of their industry business environment. We can find trends that help us forecast future possibilities and threats by examining global macroeconomic dynamics and consumer behavior patterns. By analyzing their features and advantages, contrasting them with comparable items on the market, and evaluating both their quantitative and qualitative performance, we comprehensively evaluate our clients' products. This allows us to assist customers in determining how their goods compare to those of their rivals and in creating successful marketing plans. Our group has been successful in gaining a thorough grasp of our clients' requirements and offering them creative solutions. We currently provide services to more than 50 nations in Europe, the Middle East, Africa, Latin America, Asia Pacific, and North America. Because of our global reach, we have been able to establish trusting bonds with our partners and clients in various nations, improving customer service and forging a more cohesive worldwide presence.