
.jpg&w=3840&q=100)
Market
Insights
Reports delivered globally, covering a wide range of industries and sectors.
Clients who trust our expertise and rely on our insights for business decisions.
Managed Reports, ensuring seamless updates and premium service.
Satisfied Customers, committed to delivering exceptional value and quality.
Branded Generics Market 2025-2033 Trends: Unveiling Growth Opportunities and Competitor Dynamics
Branded Generics Market by Drug Class (Anti-hypertensive, Hormones, Antimetabolites, Anti-depressants, Alkylating agents, Lipid lowering drugs, Anti-epileptics, Anti-psychotics, Other drug classes), by Application (Oncology, Cardiovascular diseases, Neurological diseases, Gastrointestinal diseases, Dermatological diseases, Acute & chronic pain, Other applications), by Route of Administration (Oral, Topical, Parenteral, Other routes of administration), by Distribution Channel (Hospital pharmacy, Retail pharmacy, Online pharmacy), by North America (U.S., Canada), by Europe (Germany, UK, France, Spain, Italy, Rest of Europe), by Asia Pacific (Japan, China, India, Australia, Rest of Asia Pacific), by Latin America (Brazil, Mexico, Rest of Latin America), by Middle East & Africa (South Africa, Saudi Arabia, Rest of Middle East & Africa) Forecast 2025-2033
Branded Generics Market 2025-2033 Trends: Unveiling Growth Opportunities and Competitor Dynamics
Key Insights
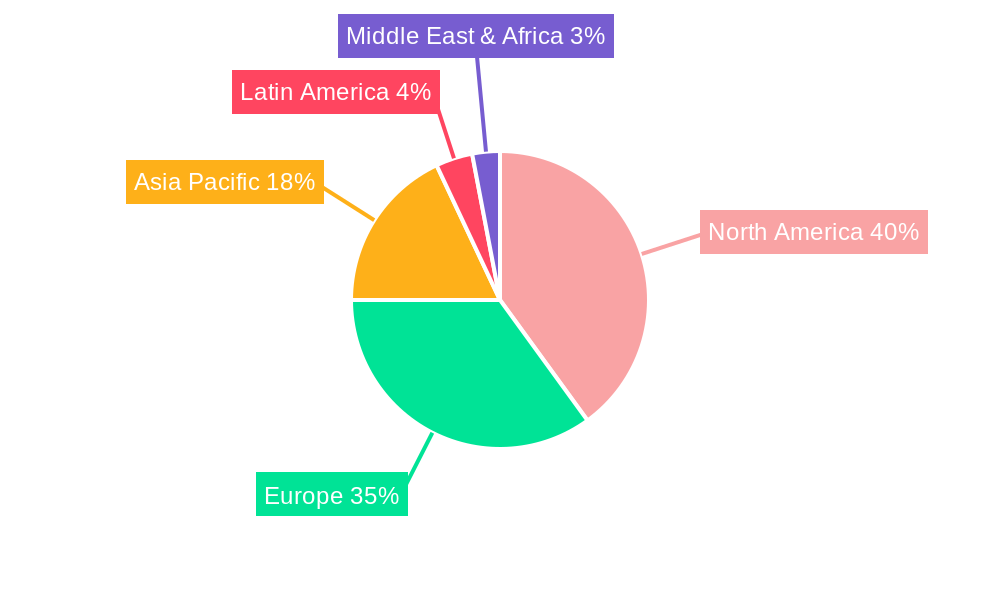
The Branded Generics market, valued at $238.4 billion in 2025, is projected to experience robust growth, driven by several key factors. The increasing prevalence of chronic diseases like cardiovascular diseases, neurological disorders, and cancer fuels demand for affordable yet reliable medication. The rising healthcare costs globally are pushing patients and healthcare systems towards cost-effective branded generic alternatives, contributing significantly to market expansion. Furthermore, the continuous development and launch of new branded generic drugs across various therapeutic areas, including oncology and cardiovascular diseases, are expected to propel market growth. Stringent regulatory approvals and increasing investments in research and development are also shaping the market landscape. Different routes of administration (oral, topical, parenteral) cater to diverse patient needs and preferences, further diversifying the market. The distribution channels are also evolving, with online pharmacies gaining traction alongside traditional hospital and retail pharmacies. Competition among established players like Teva, Lupin, Sanofi, Sun Pharma, Dr. Reddy's, and Endo International is intense, driving innovation and pricing strategies. Geographical variations exist, with North America and Europe currently holding significant market shares, but the Asia-Pacific region is poised for substantial growth due to its expanding population and rising healthcare expenditure.
The market segmentation by drug class reveals a diverse product portfolio, with anti-hypertensives, hormones, and lipid-lowering drugs forming substantial segments. The oncology segment shows significant promise due to the high prevalence of cancer and the increasing demand for effective and affordable cancer treatments. Similarly, the cardiovascular diseases segment remains substantial due to the high prevalence of heart conditions globally. The forecast period (2025-2033) anticipates a consistent CAGR of 6.1%, indicating sustained growth momentum driven by the factors mentioned above. However, challenges such as price erosion due to competition and potential regulatory hurdles might influence market trajectory. Nevertheless, the overall outlook remains positive, with the branded generics market poised for significant expansion in the coming years.

Branded Generics Market Concentration & Characteristics
The branded generics market is moderately concentrated, with a few large multinational pharmaceutical companies holding significant market share. However, the market is also characterized by a large number of smaller regional players, particularly in emerging markets. Innovation in this sector focuses on improving formulations, developing niche generics for underserved patient populations, and leveraging technological advancements in manufacturing and delivery systems. This includes developing extended-release formulations, novel drug delivery systems, and biosimilars.
- Concentration Areas: North America and Europe account for a substantial portion of the market revenue, followed by Asia Pacific. However, growth is expected to be strongest in emerging markets.
- Characteristics of Innovation: Focus on improving existing generic products through reformulation, enhanced delivery systems, and improved bioavailability.
- Impact of Regulations: Stringent regulatory approvals and patent expirations heavily influence market entry and competition. Variations in regulatory landscapes across different regions create complexities.
- Product Substitutes: The presence of brand-name drugs and other generic alternatives influences the pricing and market penetration of branded generics. Biosimilars pose both a threat and opportunity for this sector.
- End-User Concentration: The market is largely driven by hospitals, retail pharmacies, and increasingly, online pharmacies. The shift towards online pharmacies presents both opportunities and challenges.
- Level of M&A: The branded generics market witnesses consistent merger and acquisition activity, as larger companies seek to expand their portfolios and market reach. This activity is predicted to continue, driven by consolidation and the desire for a broader product range. The total M&A activity in the last 5 years is estimated to be around $20 billion.
Branded Generics Market Trends
The branded generics market is experiencing significant growth driven by several factors. The increasing prevalence of chronic diseases globally fuels demand for affordable medications. Patent expirations of blockbuster drugs continuously open opportunities for generic entry. Simultaneously, rising healthcare costs worldwide put pressure on governments and consumers to seek cost-effective treatment options. Pharmaceutical companies are increasingly focusing on niche indications, developing branded generics for specific patient populations with unique needs. This focus on specialization allows companies to maintain higher profit margins even within the competitive generics market. Furthermore, the growth of online pharmacies is creating new distribution channels and expanding market access. However, price competition remains a significant challenge, especially in developed markets. The increasing trend towards biosimilars is reshaping the landscape, presenting both an opportunity and a threat to the traditional branded generics market. The global shift towards value-based healthcare models puts pressure on companies to demonstrate the clinical and cost-effectiveness of their products. This necessitates a greater focus on data-driven decision-making and post-market surveillance. Lastly, ongoing regulatory changes in various regions continue to influence market dynamics and pose challenges for market entry and pricing. The overall market is expected to display a compound annual growth rate (CAGR) of approximately 7% in the forecast period.

Key Region or Country & Segment to Dominate the Market
The North American market, particularly the United States, is currently the largest segment for branded generics, followed by Europe and then Asia-Pacific. This is largely due to the high prevalence of chronic diseases, a robust healthcare infrastructure, and a substantial number of patent expiries. However, high growth is anticipated in Asia-Pacific owing to increasing healthcare expenditure and rising prevalence of chronic diseases across developing economies within the region.
- Dominating Segments:
- Drug Class: Anti-hypertensive drugs consistently dominate the market due to the high prevalence of cardiovascular diseases globally. Lipid-lowering drugs also represent a significant segment.
- Application: Cardiovascular diseases and neurological diseases are major application areas, closely followed by oncology.
- Route of Administration: Oral medications hold the largest share due to convenience and ease of administration.
Within the drug classes, anti-hypertensives and lipid-lowering drugs represent the largest market segments due to the high prevalence of cardiovascular diseases globally, reaching approximately $15 billion and $12 billion respectively in market value. The oncology segment, within applications, is rapidly expanding due to the increasing incidence of cancer worldwide, projected to be worth around $10 billion in the coming years. The oral route of administration, in terms of routes of administration, retains the largest market share due to its convenience.
Branded Generics Market Product Insights Report Coverage & Deliverables
This report provides comprehensive analysis of the branded generics market, encompassing market size, growth projections, key players, market segmentation (by drug class, application, route of administration, distribution channel), regional analysis, competitive landscape, and future trends. It includes detailed market sizing and forecasting, a thorough competitive analysis including profiles of major players, and an in-depth assessment of market drivers, challenges, and emerging opportunities.
Branded Generics Market Analysis
The global branded generics market is valued at approximately $80 billion. The market is projected to experience substantial growth, reaching an estimated value of $120 billion within the next five years. This growth is primarily fueled by the increasing prevalence of chronic diseases, rising healthcare costs, and a growing preference for cost-effective treatment options. The market is highly competitive, with numerous large and small pharmaceutical companies vying for market share. The market share is currently distributed amongst several key players with no single entity holding a dominant position. However, major players like Teva Pharmaceutical Industries, Dr. Reddy's Laboratories, and Lupin hold significant portions of the market. This competitive landscape leads to price pressure, requiring manufacturers to focus on operational efficiencies and innovative product differentiation.
Branded Generics Market Regional Insights
- North America
- U.S.: The largest market, driven by high healthcare spending and patent expiries.
- Canada: A significant market with a growing focus on cost-containment measures.
- Europe
- Germany, UK, France, Spain, Italy: Major markets within Europe, with varying levels of regulation and healthcare spending.
- Rest of Europe: A growing market with opportunities for expansion.
- Asia Pacific
- Japan: A mature market with high regulatory standards.
- China, India: Rapidly growing markets with significant potential, driven by expanding healthcare infrastructure and increasing affordability.
- Australia, Rest of Asia Pacific: Markets exhibiting moderate growth, with varying levels of regulatory frameworks.
- Latin America
- Brazil, Mexico: Significant markets with a focus on cost-effectiveness.
- Rest of Latin America: Growing markets with potential for expansion.
- Middle East & Africa
- South Africa, Saudi Arabia: Moderate growth potential.
- Rest of Middle East & Africa: Significant growth potential, but challenges related to infrastructure and healthcare access remain.
Driving Forces: What's Propelling the Branded Generics Market
The increasing prevalence of chronic diseases globally, coupled with rising healthcare costs, is the primary driver of growth in the branded generics market. Patent expirations of branded drugs continually create opportunities for generic entry, fueling market expansion. The growing adoption of online pharmacies presents new distribution channels and enhances market access.
Challenges and Restraints in Branded Generics Market
Intense price competition among manufacturers, stringent regulatory approvals, and the need for constant product differentiation pose significant challenges. The emergence of biosimilars adds to the competitive pressures.
Emerging Trends in Branded Generics Market
A growing focus on developing niche branded generics for underserved populations and leveraging technological advancements in drug delivery systems are key emerging trends. The increased use of data analytics for market research and personalized medicine approaches is also gaining traction.
Branded Generics Industry News
- May 2021: Teva Pharmaceutical Industries Ltd. launched the first generic version of THIOLA (tiopronin) tablets in the U.S.
- April 2020: Dr. Reddy’s Laboratories Ltd. launched Invista, a formulation of Dasatinib in India.
Leading Players in the Branded Generics Market
- Teva Pharmaceutical Industries Ltd
- Lupin
- Sanofi
- Sun Pharmaceutical Industries Ltd.
- Dr. Reddy's Laboratories Ltd
- Endo International plc
Branded Generics Market Segmentation
-
1. Drug Class
- 1.1. Anti-hypertensive
- 1.2. Hormones
- 1.3. Antimetabolites
- 1.4. Anti-depressants
- 1.5. Alkylating agents
- 1.6. Lipid lowering drugs
- 1.7. Anti-epileptics
- 1.8. Anti-psychotics
- 1.9. Other drug classes
-
2. Application
- 2.1. Oncology
- 2.2. Cardiovascular diseases
- 2.3. Neurological diseases
- 2.4. Gastrointestinal diseases
- 2.5. Dermatological diseases
- 2.6. Acute & chronic pain
- 2.7. Other applications
-
3. Route of Administration
- 3.1. Oral
- 3.2. Topical
- 3.3. Parenteral
- 3.4. Other routes of administration
-
4. Distribution Channel
- 4.1. Hospital pharmacy
- 4.2. Retail pharmacy
- 4.3. Online pharmacy
Branded Generics Market Segmentation By Geography
-
1. North America
- 1.1. U.S.
- 1.2. Canada
-
2. Europe
- 2.1. Germany
- 2.2. UK
- 2.3. France
- 2.4. Spain
- 2.5. Italy
- 2.6. Rest of Europe
-
3. Asia Pacific
- 3.1. Japan
- 3.2. China
- 3.3. India
- 3.4. Australia
- 3.5. Rest of Asia Pacific
-
4. Latin America
- 4.1. Brazil
- 4.2. Mexico
- 4.3. Rest of Latin America
-
5. Middle East & Africa
- 5.1. South Africa
- 5.2. Saudi Arabia
- 5.3. Rest of Middle East & Africa
Branded Generics Market REPORT HIGHLIGHTS
| Aspects | Details |
|---|---|
| Study Period | 2019-2033 |
| Base Year | 2024 |
| Estimated Year | 2025 |
| Forecast Period | 2025-2033 |
| Historical Period | 2019-2024 |
| Growth Rate | CAGR of 6.1% from 2019-2033 |
| Segmentation |
|
- 1. Introduction
- 1.1. Research Scope
- 1.2. Market Segmentation
- 1.3. Research Methodology
- 1.4. Definitions and Assumptions
- 2. Executive Summary
- 2.1. Introduction
- 3. Market Dynamics
- 3.1. Introduction
- 3.2. Market Drivers
- 3.2.1 IUSD 238.4 Billionncreasing prevalence of chronic diseases
- 3.2.2 Rising number of expired patents
- 3.2.3 Increasing government initiatives to promote generic products
- 3.3. Market Restrains
- 3.3.1 Competition from standard generics and brand-name drugs
- 3.3.2 Regulatory barriers
- 3.4. Market Trends
- 4. Market Factor Analysis
- 4.1. Porters Five Forces
- 4.2. Supply/Value Chain
- 4.3. PESTEL analysis
- 4.4. Market Entropy
- 4.5. Patent/Trademark Analysis
- 5. Global Branded Generics Market Analysis, Insights and Forecast, 2019-2031
- 5.1. Market Analysis, Insights and Forecast - by Drug Class
- 5.1.1. Anti-hypertensive
- 5.1.2. Hormones
- 5.1.3. Antimetabolites
- 5.1.4. Anti-depressants
- 5.1.5. Alkylating agents
- 5.1.6. Lipid lowering drugs
- 5.1.7. Anti-epileptics
- 5.1.8. Anti-psychotics
- 5.1.9. Other drug classes
- 5.2. Market Analysis, Insights and Forecast - by Application
- 5.2.1. Oncology
- 5.2.2. Cardiovascular diseases
- 5.2.3. Neurological diseases
- 5.2.4. Gastrointestinal diseases
- 5.2.5. Dermatological diseases
- 5.2.6. Acute & chronic pain
- 5.2.7. Other applications
- 5.3. Market Analysis, Insights and Forecast - by Route of Administration
- 5.3.1. Oral
- 5.3.2. Topical
- 5.3.3. Parenteral
- 5.3.4. Other routes of administration
- 5.4. Market Analysis, Insights and Forecast - by Distribution Channel
- 5.4.1. Hospital pharmacy
- 5.4.2. Retail pharmacy
- 5.4.3. Online pharmacy
- 5.5. Market Analysis, Insights and Forecast - by Region
- 5.5.1. North America
- 5.5.2. Europe
- 5.5.3. Asia Pacific
- 5.5.4. Latin America
- 5.5.5. Middle East & Africa
- 5.1. Market Analysis, Insights and Forecast - by Drug Class
- 6. North America Branded Generics Market Analysis, Insights and Forecast, 2019-2031
- 6.1. Market Analysis, Insights and Forecast - by Drug Class
- 6.1.1. Anti-hypertensive
- 6.1.2. Hormones
- 6.1.3. Antimetabolites
- 6.1.4. Anti-depressants
- 6.1.5. Alkylating agents
- 6.1.6. Lipid lowering drugs
- 6.1.7. Anti-epileptics
- 6.1.8. Anti-psychotics
- 6.1.9. Other drug classes
- 6.2. Market Analysis, Insights and Forecast - by Application
- 6.2.1. Oncology
- 6.2.2. Cardiovascular diseases
- 6.2.3. Neurological diseases
- 6.2.4. Gastrointestinal diseases
- 6.2.5. Dermatological diseases
- 6.2.6. Acute & chronic pain
- 6.2.7. Other applications
- 6.3. Market Analysis, Insights and Forecast - by Route of Administration
- 6.3.1. Oral
- 6.3.2. Topical
- 6.3.3. Parenteral
- 6.3.4. Other routes of administration
- 6.4. Market Analysis, Insights and Forecast - by Distribution Channel
- 6.4.1. Hospital pharmacy
- 6.4.2. Retail pharmacy
- 6.4.3. Online pharmacy
- 6.1. Market Analysis, Insights and Forecast - by Drug Class
- 7. Europe Branded Generics Market Analysis, Insights and Forecast, 2019-2031
- 7.1. Market Analysis, Insights and Forecast - by Drug Class
- 7.1.1. Anti-hypertensive
- 7.1.2. Hormones
- 7.1.3. Antimetabolites
- 7.1.4. Anti-depressants
- 7.1.5. Alkylating agents
- 7.1.6. Lipid lowering drugs
- 7.1.7. Anti-epileptics
- 7.1.8. Anti-psychotics
- 7.1.9. Other drug classes
- 7.2. Market Analysis, Insights and Forecast - by Application
- 7.2.1. Oncology
- 7.2.2. Cardiovascular diseases
- 7.2.3. Neurological diseases
- 7.2.4. Gastrointestinal diseases
- 7.2.5. Dermatological diseases
- 7.2.6. Acute & chronic pain
- 7.2.7. Other applications
- 7.3. Market Analysis, Insights and Forecast - by Route of Administration
- 7.3.1. Oral
- 7.3.2. Topical
- 7.3.3. Parenteral
- 7.3.4. Other routes of administration
- 7.4. Market Analysis, Insights and Forecast - by Distribution Channel
- 7.4.1. Hospital pharmacy
- 7.4.2. Retail pharmacy
- 7.4.3. Online pharmacy
- 7.1. Market Analysis, Insights and Forecast - by Drug Class
- 8. Asia Pacific Branded Generics Market Analysis, Insights and Forecast, 2019-2031
- 8.1. Market Analysis, Insights and Forecast - by Drug Class
- 8.1.1. Anti-hypertensive
- 8.1.2. Hormones
- 8.1.3. Antimetabolites
- 8.1.4. Anti-depressants
- 8.1.5. Alkylating agents
- 8.1.6. Lipid lowering drugs
- 8.1.7. Anti-epileptics
- 8.1.8. Anti-psychotics
- 8.1.9. Other drug classes
- 8.2. Market Analysis, Insights and Forecast - by Application
- 8.2.1. Oncology
- 8.2.2. Cardiovascular diseases
- 8.2.3. Neurological diseases
- 8.2.4. Gastrointestinal diseases
- 8.2.5. Dermatological diseases
- 8.2.6. Acute & chronic pain
- 8.2.7. Other applications
- 8.3. Market Analysis, Insights and Forecast - by Route of Administration
- 8.3.1. Oral
- 8.3.2. Topical
- 8.3.3. Parenteral
- 8.3.4. Other routes of administration
- 8.4. Market Analysis, Insights and Forecast - by Distribution Channel
- 8.4.1. Hospital pharmacy
- 8.4.2. Retail pharmacy
- 8.4.3. Online pharmacy
- 8.1. Market Analysis, Insights and Forecast - by Drug Class
- 9. Latin America Branded Generics Market Analysis, Insights and Forecast, 2019-2031
- 9.1. Market Analysis, Insights and Forecast - by Drug Class
- 9.1.1. Anti-hypertensive
- 9.1.2. Hormones
- 9.1.3. Antimetabolites
- 9.1.4. Anti-depressants
- 9.1.5. Alkylating agents
- 9.1.6. Lipid lowering drugs
- 9.1.7. Anti-epileptics
- 9.1.8. Anti-psychotics
- 9.1.9. Other drug classes
- 9.2. Market Analysis, Insights and Forecast - by Application
- 9.2.1. Oncology
- 9.2.2. Cardiovascular diseases
- 9.2.3. Neurological diseases
- 9.2.4. Gastrointestinal diseases
- 9.2.5. Dermatological diseases
- 9.2.6. Acute & chronic pain
- 9.2.7. Other applications
- 9.3. Market Analysis, Insights and Forecast - by Route of Administration
- 9.3.1. Oral
- 9.3.2. Topical
- 9.3.3. Parenteral
- 9.3.4. Other routes of administration
- 9.4. Market Analysis, Insights and Forecast - by Distribution Channel
- 9.4.1. Hospital pharmacy
- 9.4.2. Retail pharmacy
- 9.4.3. Online pharmacy
- 9.1. Market Analysis, Insights and Forecast - by Drug Class
- 10. Middle East & Africa Branded Generics Market Analysis, Insights and Forecast, 2019-2031
- 10.1. Market Analysis, Insights and Forecast - by Drug Class
- 10.1.1. Anti-hypertensive
- 10.1.2. Hormones
- 10.1.3. Antimetabolites
- 10.1.4. Anti-depressants
- 10.1.5. Alkylating agents
- 10.1.6. Lipid lowering drugs
- 10.1.7. Anti-epileptics
- 10.1.8. Anti-psychotics
- 10.1.9. Other drug classes
- 10.2. Market Analysis, Insights and Forecast - by Application
- 10.2.1. Oncology
- 10.2.2. Cardiovascular diseases
- 10.2.3. Neurological diseases
- 10.2.4. Gastrointestinal diseases
- 10.2.5. Dermatological diseases
- 10.2.6. Acute & chronic pain
- 10.2.7. Other applications
- 10.3. Market Analysis, Insights and Forecast - by Route of Administration
- 10.3.1. Oral
- 10.3.2. Topical
- 10.3.3. Parenteral
- 10.3.4. Other routes of administration
- 10.4. Market Analysis, Insights and Forecast - by Distribution Channel
- 10.4.1. Hospital pharmacy
- 10.4.2. Retail pharmacy
- 10.4.3. Online pharmacy
- 10.1. Market Analysis, Insights and Forecast - by Drug Class
- 11. Competitive Analysis
- 11.1. Global Market Share Analysis 2024
- 11.2. Company Profiles
- 11.2.1 Teva Pharmaceutical Industries Ltd
- 11.2.1.1. Overview
- 11.2.1.2. Products
- 11.2.1.3. SWOT Analysis
- 11.2.1.4. Recent Developments
- 11.2.1.5. Financials (Based on Availability)
- 11.2.2 Lupin
- 11.2.2.1. Overview
- 11.2.2.2. Products
- 11.2.2.3. SWOT Analysis
- 11.2.2.4. Recent Developments
- 11.2.2.5. Financials (Based on Availability)
- 11.2.3 Sanofi
- 11.2.3.1. Overview
- 11.2.3.2. Products
- 11.2.3.3. SWOT Analysis
- 11.2.3.4. Recent Developments
- 11.2.3.5. Financials (Based on Availability)
- 11.2.4 Sun Pharmaceutical Industries Ltd.
- 11.2.4.1. Overview
- 11.2.4.2. Products
- 11.2.4.3. SWOT Analysis
- 11.2.4.4. Recent Developments
- 11.2.4.5. Financials (Based on Availability)
- 11.2.5 Dr. Reddy's Laboratories Ltd
- 11.2.5.1. Overview
- 11.2.5.2. Products
- 11.2.5.3. SWOT Analysis
- 11.2.5.4. Recent Developments
- 11.2.5.5. Financials (Based on Availability)
- 11.2.6 Endo International plc
- 11.2.6.1. Overview
- 11.2.6.2. Products
- 11.2.6.3. SWOT Analysis
- 11.2.6.4. Recent Developments
- 11.2.6.5. Financials (Based on Availability)
- 11.2.1 Teva Pharmaceutical Industries Ltd
- Figure 1: Global Branded Generics Market Revenue Breakdown (Billion, %) by Region 2024 & 2032
- Figure 2: North America Branded Generics Market Revenue (Billion), by Drug Class 2024 & 2032
- Figure 3: North America Branded Generics Market Revenue Share (%), by Drug Class 2024 & 2032
- Figure 4: North America Branded Generics Market Revenue (Billion), by Application 2024 & 2032
- Figure 5: North America Branded Generics Market Revenue Share (%), by Application 2024 & 2032
- Figure 6: North America Branded Generics Market Revenue (Billion), by Route of Administration 2024 & 2032
- Figure 7: North America Branded Generics Market Revenue Share (%), by Route of Administration 2024 & 2032
- Figure 8: North America Branded Generics Market Revenue (Billion), by Distribution Channel 2024 & 2032
- Figure 9: North America Branded Generics Market Revenue Share (%), by Distribution Channel 2024 & 2032
- Figure 10: North America Branded Generics Market Revenue (Billion), by Country 2024 & 2032
- Figure 11: North America Branded Generics Market Revenue Share (%), by Country 2024 & 2032
- Figure 12: Europe Branded Generics Market Revenue (Billion), by Drug Class 2024 & 2032
- Figure 13: Europe Branded Generics Market Revenue Share (%), by Drug Class 2024 & 2032
- Figure 14: Europe Branded Generics Market Revenue (Billion), by Application 2024 & 2032
- Figure 15: Europe Branded Generics Market Revenue Share (%), by Application 2024 & 2032
- Figure 16: Europe Branded Generics Market Revenue (Billion), by Route of Administration 2024 & 2032
- Figure 17: Europe Branded Generics Market Revenue Share (%), by Route of Administration 2024 & 2032
- Figure 18: Europe Branded Generics Market Revenue (Billion), by Distribution Channel 2024 & 2032
- Figure 19: Europe Branded Generics Market Revenue Share (%), by Distribution Channel 2024 & 2032
- Figure 20: Europe Branded Generics Market Revenue (Billion), by Country 2024 & 2032
- Figure 21: Europe Branded Generics Market Revenue Share (%), by Country 2024 & 2032
- Figure 22: Asia Pacific Branded Generics Market Revenue (Billion), by Drug Class 2024 & 2032
- Figure 23: Asia Pacific Branded Generics Market Revenue Share (%), by Drug Class 2024 & 2032
- Figure 24: Asia Pacific Branded Generics Market Revenue (Billion), by Application 2024 & 2032
- Figure 25: Asia Pacific Branded Generics Market Revenue Share (%), by Application 2024 & 2032
- Figure 26: Asia Pacific Branded Generics Market Revenue (Billion), by Route of Administration 2024 & 2032
- Figure 27: Asia Pacific Branded Generics Market Revenue Share (%), by Route of Administration 2024 & 2032
- Figure 28: Asia Pacific Branded Generics Market Revenue (Billion), by Distribution Channel 2024 & 2032
- Figure 29: Asia Pacific Branded Generics Market Revenue Share (%), by Distribution Channel 2024 & 2032
- Figure 30: Asia Pacific Branded Generics Market Revenue (Billion), by Country 2024 & 2032
- Figure 31: Asia Pacific Branded Generics Market Revenue Share (%), by Country 2024 & 2032
- Figure 32: Latin America Branded Generics Market Revenue (Billion), by Drug Class 2024 & 2032
- Figure 33: Latin America Branded Generics Market Revenue Share (%), by Drug Class 2024 & 2032
- Figure 34: Latin America Branded Generics Market Revenue (Billion), by Application 2024 & 2032
- Figure 35: Latin America Branded Generics Market Revenue Share (%), by Application 2024 & 2032
- Figure 36: Latin America Branded Generics Market Revenue (Billion), by Route of Administration 2024 & 2032
- Figure 37: Latin America Branded Generics Market Revenue Share (%), by Route of Administration 2024 & 2032
- Figure 38: Latin America Branded Generics Market Revenue (Billion), by Distribution Channel 2024 & 2032
- Figure 39: Latin America Branded Generics Market Revenue Share (%), by Distribution Channel 2024 & 2032
- Figure 40: Latin America Branded Generics Market Revenue (Billion), by Country 2024 & 2032
- Figure 41: Latin America Branded Generics Market Revenue Share (%), by Country 2024 & 2032
- Figure 42: Middle East & Africa Branded Generics Market Revenue (Billion), by Drug Class 2024 & 2032
- Figure 43: Middle East & Africa Branded Generics Market Revenue Share (%), by Drug Class 2024 & 2032
- Figure 44: Middle East & Africa Branded Generics Market Revenue (Billion), by Application 2024 & 2032
- Figure 45: Middle East & Africa Branded Generics Market Revenue Share (%), by Application 2024 & 2032
- Figure 46: Middle East & Africa Branded Generics Market Revenue (Billion), by Route of Administration 2024 & 2032
- Figure 47: Middle East & Africa Branded Generics Market Revenue Share (%), by Route of Administration 2024 & 2032
- Figure 48: Middle East & Africa Branded Generics Market Revenue (Billion), by Distribution Channel 2024 & 2032
- Figure 49: Middle East & Africa Branded Generics Market Revenue Share (%), by Distribution Channel 2024 & 2032
- Figure 50: Middle East & Africa Branded Generics Market Revenue (Billion), by Country 2024 & 2032
- Figure 51: Middle East & Africa Branded Generics Market Revenue Share (%), by Country 2024 & 2032
- Table 1: Global Branded Generics Market Revenue Billion Forecast, by Region 2019 & 2032
- Table 2: Global Branded Generics Market Revenue Billion Forecast, by Drug Class 2019 & 2032
- Table 3: Global Branded Generics Market Revenue Billion Forecast, by Application 2019 & 2032
- Table 4: Global Branded Generics Market Revenue Billion Forecast, by Route of Administration 2019 & 2032
- Table 5: Global Branded Generics Market Revenue Billion Forecast, by Distribution Channel 2019 & 2032
- Table 6: Global Branded Generics Market Revenue Billion Forecast, by Region 2019 & 2032
- Table 7: Global Branded Generics Market Revenue Billion Forecast, by Drug Class 2019 & 2032
- Table 8: Global Branded Generics Market Revenue Billion Forecast, by Application 2019 & 2032
- Table 9: Global Branded Generics Market Revenue Billion Forecast, by Route of Administration 2019 & 2032
- Table 10: Global Branded Generics Market Revenue Billion Forecast, by Distribution Channel 2019 & 2032
- Table 11: Global Branded Generics Market Revenue Billion Forecast, by Country 2019 & 2032
- Table 12: U.S. Branded Generics Market Revenue (Billion) Forecast, by Application 2019 & 2032
- Table 13: Canada Branded Generics Market Revenue (Billion) Forecast, by Application 2019 & 2032
- Table 14: Global Branded Generics Market Revenue Billion Forecast, by Drug Class 2019 & 2032
- Table 15: Global Branded Generics Market Revenue Billion Forecast, by Application 2019 & 2032
- Table 16: Global Branded Generics Market Revenue Billion Forecast, by Route of Administration 2019 & 2032
- Table 17: Global Branded Generics Market Revenue Billion Forecast, by Distribution Channel 2019 & 2032
- Table 18: Global Branded Generics Market Revenue Billion Forecast, by Country 2019 & 2032
- Table 19: Germany Branded Generics Market Revenue (Billion) Forecast, by Application 2019 & 2032
- Table 20: UK Branded Generics Market Revenue (Billion) Forecast, by Application 2019 & 2032
- Table 21: France Branded Generics Market Revenue (Billion) Forecast, by Application 2019 & 2032
- Table 22: Spain Branded Generics Market Revenue (Billion) Forecast, by Application 2019 & 2032
- Table 23: Italy Branded Generics Market Revenue (Billion) Forecast, by Application 2019 & 2032
- Table 24: Rest of Europe Branded Generics Market Revenue (Billion) Forecast, by Application 2019 & 2032
- Table 25: Global Branded Generics Market Revenue Billion Forecast, by Drug Class 2019 & 2032
- Table 26: Global Branded Generics Market Revenue Billion Forecast, by Application 2019 & 2032
- Table 27: Global Branded Generics Market Revenue Billion Forecast, by Route of Administration 2019 & 2032
- Table 28: Global Branded Generics Market Revenue Billion Forecast, by Distribution Channel 2019 & 2032
- Table 29: Global Branded Generics Market Revenue Billion Forecast, by Country 2019 & 2032
- Table 30: Japan Branded Generics Market Revenue (Billion) Forecast, by Application 2019 & 2032
- Table 31: China Branded Generics Market Revenue (Billion) Forecast, by Application 2019 & 2032
- Table 32: India Branded Generics Market Revenue (Billion) Forecast, by Application 2019 & 2032
- Table 33: Australia Branded Generics Market Revenue (Billion) Forecast, by Application 2019 & 2032
- Table 34: Rest of Asia Pacific Branded Generics Market Revenue (Billion) Forecast, by Application 2019 & 2032
- Table 35: Global Branded Generics Market Revenue Billion Forecast, by Drug Class 2019 & 2032
- Table 36: Global Branded Generics Market Revenue Billion Forecast, by Application 2019 & 2032
- Table 37: Global Branded Generics Market Revenue Billion Forecast, by Route of Administration 2019 & 2032
- Table 38: Global Branded Generics Market Revenue Billion Forecast, by Distribution Channel 2019 & 2032
- Table 39: Global Branded Generics Market Revenue Billion Forecast, by Country 2019 & 2032
- Table 40: Brazil Branded Generics Market Revenue (Billion) Forecast, by Application 2019 & 2032
- Table 41: Mexico Branded Generics Market Revenue (Billion) Forecast, by Application 2019 & 2032
- Table 42: Rest of Latin America Branded Generics Market Revenue (Billion) Forecast, by Application 2019 & 2032
- Table 43: Global Branded Generics Market Revenue Billion Forecast, by Drug Class 2019 & 2032
- Table 44: Global Branded Generics Market Revenue Billion Forecast, by Application 2019 & 2032
- Table 45: Global Branded Generics Market Revenue Billion Forecast, by Route of Administration 2019 & 2032
- Table 46: Global Branded Generics Market Revenue Billion Forecast, by Distribution Channel 2019 & 2032
- Table 47: Global Branded Generics Market Revenue Billion Forecast, by Country 2019 & 2032
- Table 48: South Africa Branded Generics Market Revenue (Billion) Forecast, by Application 2019 & 2032
- Table 49: Saudi Arabia Branded Generics Market Revenue (Billion) Forecast, by Application 2019 & 2032
- Table 50: Rest of Middle East & Africa Branded Generics Market Revenue (Billion) Forecast, by Application 2019 & 2032
STEP 1 - Identification of Relevant Samples Size from Population Database


STEP 2 - Approaches for Defining Global Market Size (Value, Volume* & Price*)

Note* : In applicable scenarios
STEP 3 - Data Sources
Primary Research
- Web Analytics
- Survey Reports
- Research Institute
- Latest Research Reports
- Opinion Leaders
Secondary Research
- Annual Reports
- White Paper
- Latest Press Release
- Industry Association
- Paid Database
- Investor Presentations

STEP 4 - Data Triangulation
Involves using different sources of information in order to increase the validity of a study
These sources are likely to be stakeholders in a program - participants, other researchers, program staff, other community members, and so on.
Then we put all data in single framework & apply various statistical tools to find out the dynamic on the market.
During the analysis stage, feedback from the stakeholder groups would be compared to determine areas of agreement as well as areas of divergence
Frequently Asked Questions
What pricing options are available for accessing the report?
Pricing options include single-user, multi-user, and enterprise licenses priced at USD 4,850 , USD 5,350, and USD 8,350 respectively.
Are there any specific market keywords associated with the report?
Yes, the market keyword associated with the report is "Branded Generics Market," which aids in identifying and referencing the specific market segment covered.
What are some drivers contributing to market growth?
IUSD 238.4 Billionncreasing prevalence of chronic diseases., Rising number of expired patents ., Increasing government initiatives to promote generic products.
Can you provide details about the market size?
The market size is estimated to be USD 238.4 Billion as of 2022.
How do I determine which pricing option suits my needs best?
The pricing options vary based on user requirements and access needs. Individual users may opt for single-user licenses, while businesses requiring broader access may choose multi-user or enterprise licenses for cost-effective access to the report.
Can you provide examples of recent developments in the market?
In May 2021, Teva Pharmaceutical Industries Ltd. launched the first generic version of THIOLA (tiopronin) tablets in the U.S. This medication is used for the prevention of cystine (kidney) stone formation in adults and pediatric patients 9 years of age and older with severe homozygous cystinuria. This strategy helped the company to expand their generics portfolio.
How can I stay updated on further developments or reports in the Branded Generics Market?
To stay informed about further developments, trends, and reports in the Branded Generics Market, consider subscribing to industry newsletters, following relevant companies and organizations, or regularly checking reputable industry news sources and publications.
Are there any additional resources or data provided in the report?
While the report offers comprehensive insights, it's advisable to review the specific contents or supplementary materials provided to ascertain if additional resources or data are available.
Related Reports
See the similar reports


About Market Insights Report
Market Insights Reports offers comprehensive market research reports and analysis, giving businesses important information about their clients, rivals, and sector to help them make well-informed decisions on operations, marketing, and business strategy. We offer a variety of services in addition to market research, data analysis, and strategy planning. In order to find opportunities and learn more about our competitors and the industry at large, we employ competitive analysis. To identify areas for development, we also evaluate our performance against that of our rivals. We can determine the places at which we can offer our clients the most value by performing value chain analysis.
Additionally, clients receive a thorough overview of their industry business environment. We can find trends that help us forecast future possibilities and threats by examining global macroeconomic dynamics and consumer behavior patterns. By analyzing their features and advantages, contrasting them with comparable items on the market, and evaluating both their quantitative and qualitative performance, we comprehensively evaluate our clients' products. This allows us to assist customers in determining how their goods compare to those of their rivals and in creating successful marketing plans. Our group has been successful in gaining a thorough grasp of our clients' requirements and offering them creative solutions. We currently provide services to more than 50 nations in Europe, the Middle East, Africa, Latin America, Asia Pacific, and North America. Because of our global reach, we have been able to establish trusting bonds with our partners and clients in various nations, improving customer service and forging a more cohesive worldwide presence.