
.jpg&w=3840&q=100)
Market
Insights
Reports delivered globally, covering a wide range of industries and sectors.
Clients who trust our expertise and rely on our insights for business decisions.
Managed Reports, ensuring seamless updates and premium service.
Satisfied Customers, committed to delivering exceptional value and quality.
Drive-in-Movie Theater Market Growth Opportunities and Market Forecast 2025-2033: A Strategic Analysis
Drive-in-Movie Theater Market by Screen Size (Up to 20 ft, 20-50 ft, Above 50 ft), by Area (Small-scale, Large-scale), by Technology (2D, 3D), by Application (Restaurant parking lots, Theater parking lots), by North America (U.S., Canada), by Europe (Germany, UK, France, Italy, Spain), by Asia Pacific (China, Japan, India, South Korea, ANZ), by Latin America (Brazil, Mexico), by MEA (UAE, Saudi Arabia, South Africa) Forecast 2025-2033
Drive-in-Movie Theater Market Growth Opportunities and Market Forecast 2025-2033: A Strategic Analysis
Key Insights
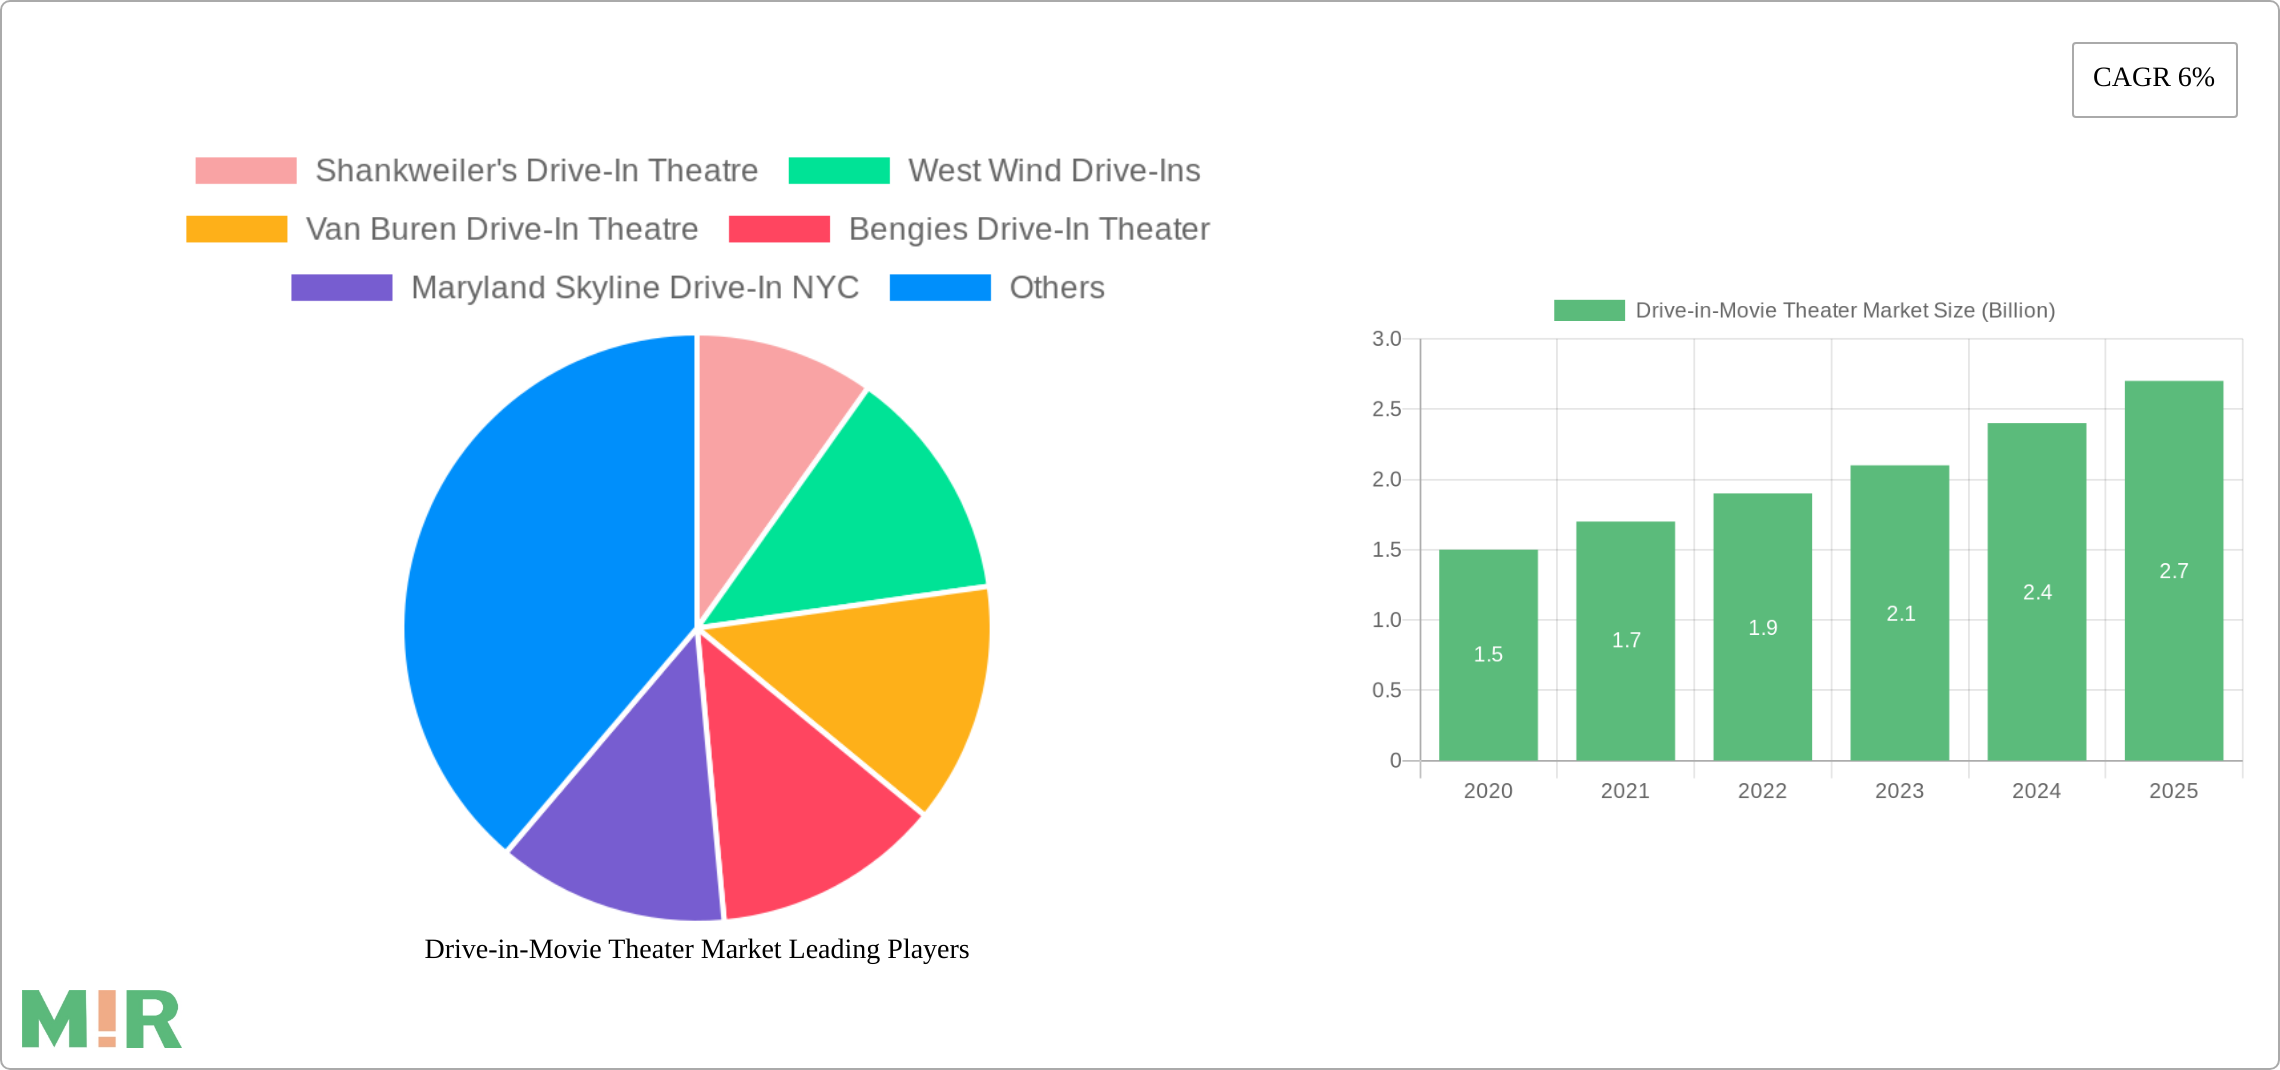
The Drive-in-Movie Theater Market, currently valued at $5.2 billion, is experiencing robust growth, exhibiting a Compound Annual Growth Rate (CAGR) of 6%. This resurgence is fueled by several key factors. The nostalgia factor, appealing to a generation yearning for a simpler, more communal entertainment experience, plays a significant role. Furthermore, the pandemic accelerated the adoption of drive-in theaters as a safe and socially distanced form of entertainment. Technological advancements, such as improved projection systems and enhanced sound quality, are enhancing the overall viewing experience, attracting a wider audience. The incorporation of additional amenities, such as food and beverage services, contributes to a more comprehensive and appealing entertainment package. Finally, strategic partnerships and new constructions, as seen with the Sun-Ray Cinema initiative in Jacksonville, demonstrate the industry's proactive approach to expansion and modernization, solidifying its position within the entertainment landscape.
Drive-in-Movie Theater Market Concentration & Characteristics
The drive-in movie theater market is characterized by a fragmented landscape, with a large number of independently owned and operated theaters. Market concentration is geographically dispersed, with clusters in areas that cater to specific demographics or possess unique market opportunities. Innovation in this sector focuses on enhancing the customer experience through technological upgrades, themed events, and improved on-site amenities. Regulations surrounding zoning, safety, and environmental impact influence the establishment and operation of these theaters. Product substitutes, such as streaming services and traditional indoor cinemas, present ongoing competition. End-user concentration is diverse, spanning families, young adults, and nostalgia-seeking consumers. The level of mergers and acquisitions (M&A) activity remains relatively low, reflecting the fragmented nature of the market, though strategic partnerships, as evidenced by the PVR Cinemas and Reliance Retail collaboration, are emerging as a significant growth strategy. This collaborative approach suggests that innovative business models and strategic alliances are becoming crucial to the expansion and profitability of drive-in theaters.
Drive-in-Movie Theater Market Trends
The drive-in movie theater market is undergoing a transformation fueled by several key trends. Nostalgia for a simpler, more communal cinematic experience is driving a resurgence in popularity. The pandemic acted as a significant catalyst, showcasing the drive-in's unique value proposition of safe, socially-distanced entertainment. This shift spurred innovation in technology, with upgrades in projection systems, sound quality, and digital capabilities aiming to enhance the viewer experience. The trend of incorporating additional amenities, such as food trucks, restaurants, and themed events, adds to the overall appeal and differentiates drive-in theaters from traditional cinemas. The emergence of rooftop drive-ins, as exemplified by the Jio World Drive mall initiative in Mumbai, represents a creative adaptation of the traditional model, expanding into new urban environments. Strategic partnerships between established entertainment chains and retail groups signal a growing confidence in the market's long-term potential. The rise of drive-ins also reflects a broader consumer desire for unique, experiential entertainment, moving beyond the purely passive consumption of media. Furthermore, marketing strategies focused on community engagement and themed events further enhance the allure of the drive-in experience, attracting diverse customer segments. The market is seeing a blurring of the lines between traditional drive-ins and other forms of entertainment, creating a hybrid model that combines the charm of classic drive-ins with modern amenities and experiences.

Key Region or Country & Segment to Dominate the Market
While the market is geographically dispersed, North America currently holds a significant share due to the established presence of numerous drive-in theaters and a strong nostalgic appeal among consumers. Within North America, the US market leads.
- Key Segments:
- Screen Size: The 20-50 ft screen size segment is likely to dominate due to its balance between cost-effectiveness and visual appeal for viewers.
- Area: Large-scale drive-ins have the potential to attract larger audiences and generate more revenue.
- Technology: While 2D remains the mainstay, the gradual adoption of 3D technology could drive growth in this segment.
- Application: Theater parking lots are the dominant application, providing a dedicated and purpose-built space.
The large-scale drive-in theaters offering 20-50ft screens located in established theater parking lots are likely to capture the largest market share in the near term. The integration of technology like 3D will eventually drive market growth but currently, 2D remains the most dominant factor. The appeal of large-scale venues stems from increased capacity and potential for higher revenue, while the preferred screen size provides an optimal balance between cost and viewer experience.
Drive-in-Movie Theater Market Product Insights Report Coverage & Deliverables
(This section would typically include a detailed outline of the report's structure, methodology, data sources, and deliverables. This might involve sections on market segmentation, revenue projections, competitive analysis, and SWOT analysis. Since that information is not provided in the prompt, it cannot be included.)
Drive-in-Movie Theater Market Analysis
The drive-in movie theater market, while currently fragmented, presents a sizable opportunity. The $5.2 billion valuation highlights the market’s overall worth and potential for growth. Market share is distributed among numerous independently owned theaters and a few larger regional chains. The growth trajectory, projected at a 6% CAGR, signals a promising outlook. This growth is attributable to factors such as nostalgia, the pandemic-driven surge in popularity, technological enhancements, and the adoption of innovative business models. This trend toward innovation is creating a dynamic market where the combination of traditional charm and modern amenities is proving to be a winning strategy. Further analysis would need to delve into specific regional markets and competitive landscapes to provide a granular understanding of market share distribution. The current valuation and growth rate highlight that further expansion into diverse geographical areas and incorporation of innovative offerings could potentially elevate the market valuation substantially in the years to come.
Drive-in-Movie Theater Market Regional Insights
- North America:
- U.S. (Dominant market within North America)
- Canada
- Europe:
- Germany
- UK
- France
- Italy
- Spain
- Asia Pacific:
- China
- Japan
- India
- South Korea
- ANZ (Australia and New Zealand)
- Latin America:
- Brazil
- Mexico
- MEA (Middle East and Africa):
- UAE
- Saudi Arabia
- South Africa
Driving Forces: What's Propelling the Drive-in-Movie Theater Market
- Nostalgia and the appeal of a unique entertainment experience.
- The pandemic's impact, highlighting the drive-in's safety and social distancing advantages.
- Technological advancements, improving projection, sound, and overall viewing quality.
- The addition of amenities such as food and beverage services, enhancing the overall experience.
- Strategic partnerships and new construction projects signaling industry confidence and growth.
Challenges and Restraints in Drive-in-Movie Theater Market
- Competition from streaming services and traditional cinemas.
- The high initial investment costs associated with establishing a drive-in theater.
- Weather dependency, impacting operational consistency.
- Finding suitable locations with sufficient space and appropriate zoning.
- Managing costs while maintaining competitive ticket pricing.
Emerging Trends in Drive-in-Movie Theater Market
- Rooftop drive-ins, expanding into urban environments.
- The incorporation of additional entertainment options beyond movies (e.g., live music).
- Enhanced food and beverage offerings, creating a more comprehensive entertainment package.
- Personalized experiences and tailored events to appeal to specific demographics.
- Strategic partnerships among existing entertainment players.
Drive-in-Movie Theater Industry News
- February 2023: Sun-Ray Cinema announced plans for a new drive-in theater in Jacksonville, Florida, marking the city's first dedicated drive-in in over a decade. The project signifies the growing resurgence of drive-in theaters and the willingness of established companies to invest in this sector. Sun-Ray's previous success with temporary drive-in venues during the pandemic demonstrates a clear market demand and established operational expertise.
- November 2021: PVR Cinemas and Reliance Retail partnered to open a rooftop drive-in theater at Mumbai's Jio World Drive mall, demonstrating innovation in location and market expansion. The scale of this project (295 cars) indicates significant investment and confidence in the drive-in model.
Leading Players in the Drive-in-Movie Theater Market
- Snyk
- Checkmarx
- Aqua Security
- JFrog
- GitLab
- Sonatype
- Contrast Security
- Palo Alto Networks
- Synopsys
- Anchore
- Tenable
- Mend (formerly WhiteSource)
- Veracode
- Datadog
- HashiCorp
Drive-in-Movie Theater Market Segmentation
- 1. Screen Size
- 1.1. Up to 20 ft
- 1.2. 20-50 ft
- 1.3. Above 50 ft
- 2. Area
- 2.1. Small-scale
- 2.2. Large-scale
- 3. Technology
- 3.1. 2D
- 3.2. 3D
- 4. Application
- 4.1. Restaurant parking lots
- 4.2. Theater parking lots
Drive-in-Movie Theater Market Segmentation By Geography
- 1. North America
- 1.1. U.S.
- 1.2. Canada
- 2. Europe
- 2.1. Germany
- 2.2. UK
- 2.3. France
- 2.4. Italy
- 2.5. Spain
- 3. Asia Pacific
- 3.1. China
- 3.2. Japan
- 3.3. India
- 3.4. South Korea
- 3.5. ANZ
- 4. Latin America
- 4.1. Brazil
- 4.2. Mexico
- 5. MEA
- 5.1. UAE
- 5.2. Saudi Arabia
- 5.3. South Africa

Drive-in-Movie Theater Market REPORT HIGHLIGHTS
| Aspects | Details |
|---|---|
| Study Period | 2019-2033 |
| Base Year | 2024 |
| Estimated Year | 2025 |
| Forecast Period | 2025-2033 |
| Historical Period | 2019-2024 |
| Growth Rate | CAGR of 6% from 2019-2033 |
| Segmentation |
|
- 1. Introduction
- 1.1. Research Scope
- 1.2. Market Segmentation
- 1.3. Research Methodology
- 1.4. Definitions and Assumptions
- 2. Executive Summary
- 2.1. Introduction
- 3. Market Dynamics
- 3.1. Introduction
- 3.2. Market Drivers
- 3.2.1 Rise in inclination of youth and middle age groups towards drive-in-movie theaters
- 3.2.2 Incorporation of advanced technologies and enhancement of drive through areas
- 3.2.3 Wide usage of restaurant parking lots for drive-in movie theaters
- 3.2.4 Rising consumer spending as well as digitization in the entertainment industry
- 3.2.5 Increase in number of drive-in-movie theaters
- 3.3. Market Restrains
- 3.3.1 Seasonal nature and weather dependence
- 3.3.2 High initial setup costs
- 3.4. Market Trends
- 4. Market Factor Analysis
- 4.1. Porters Five Forces
- 4.2. Supply/Value Chain
- 4.3. PESTEL analysis
- 4.4. Market Entropy
- 4.5. Patent/Trademark Analysis
- 5. Global Drive-in-Movie Theater Market Analysis, Insights and Forecast, 2019-2031
- 5.1. Market Analysis, Insights and Forecast - by Screen Size
- 5.1.1. Up to 20 ft
- 5.1.2. 20-50 ft
- 5.1.3. Above 50 ft
- 5.2. Market Analysis, Insights and Forecast - by Area
- 5.2.1. Small-scale
- 5.2.2. Large-scale
- 5.3. Market Analysis, Insights and Forecast - by Technology
- 5.3.1. 2D
- 5.3.2. 3D
- 5.4. Market Analysis, Insights and Forecast - by Application
- 5.4.1. Restaurant parking lots
- 5.4.2. Theater parking lots
- 5.5. Market Analysis, Insights and Forecast - by Region
- 5.5.1. North America
- 5.5.2. Europe
- 5.5.3. Asia Pacific
- 5.5.4. Latin America
- 5.5.5. MEA
- 5.1. Market Analysis, Insights and Forecast - by Screen Size
- 6. North America Drive-in-Movie Theater Market Analysis, Insights and Forecast, 2019-2031
- 6.1. Market Analysis, Insights and Forecast - by Screen Size
- 6.1.1. Up to 20 ft
- 6.1.2. 20-50 ft
- 6.1.3. Above 50 ft
- 6.2. Market Analysis, Insights and Forecast - by Area
- 6.2.1. Small-scale
- 6.2.2. Large-scale
- 6.3. Market Analysis, Insights and Forecast - by Technology
- 6.3.1. 2D
- 6.3.2. 3D
- 6.4. Market Analysis, Insights and Forecast - by Application
- 6.4.1. Restaurant parking lots
- 6.4.2. Theater parking lots
- 6.1. Market Analysis, Insights and Forecast - by Screen Size
- 7. Europe Drive-in-Movie Theater Market Analysis, Insights and Forecast, 2019-2031
- 7.1. Market Analysis, Insights and Forecast - by Screen Size
- 7.1.1. Up to 20 ft
- 7.1.2. 20-50 ft
- 7.1.3. Above 50 ft
- 7.2. Market Analysis, Insights and Forecast - by Area
- 7.2.1. Small-scale
- 7.2.2. Large-scale
- 7.3. Market Analysis, Insights and Forecast - by Technology
- 7.3.1. 2D
- 7.3.2. 3D
- 7.4. Market Analysis, Insights and Forecast - by Application
- 7.4.1. Restaurant parking lots
- 7.4.2. Theater parking lots
- 7.1. Market Analysis, Insights and Forecast - by Screen Size
- 8. Asia Pacific Drive-in-Movie Theater Market Analysis, Insights and Forecast, 2019-2031
- 8.1. Market Analysis, Insights and Forecast - by Screen Size
- 8.1.1. Up to 20 ft
- 8.1.2. 20-50 ft
- 8.1.3. Above 50 ft
- 8.2. Market Analysis, Insights and Forecast - by Area
- 8.2.1. Small-scale
- 8.2.2. Large-scale
- 8.3. Market Analysis, Insights and Forecast - by Technology
- 8.3.1. 2D
- 8.3.2. 3D
- 8.4. Market Analysis, Insights and Forecast - by Application
- 8.4.1. Restaurant parking lots
- 8.4.2. Theater parking lots
- 8.1. Market Analysis, Insights and Forecast - by Screen Size
- 9. Latin America Drive-in-Movie Theater Market Analysis, Insights and Forecast, 2019-2031
- 9.1. Market Analysis, Insights and Forecast - by Screen Size
- 9.1.1. Up to 20 ft
- 9.1.2. 20-50 ft
- 9.1.3. Above 50 ft
- 9.2. Market Analysis, Insights and Forecast - by Area
- 9.2.1. Small-scale
- 9.2.2. Large-scale
- 9.3. Market Analysis, Insights and Forecast - by Technology
- 9.3.1. 2D
- 9.3.2. 3D
- 9.4. Market Analysis, Insights and Forecast - by Application
- 9.4.1. Restaurant parking lots
- 9.4.2. Theater parking lots
- 9.1. Market Analysis, Insights and Forecast - by Screen Size
- 10. MEA Drive-in-Movie Theater Market Analysis, Insights and Forecast, 2019-2031
- 10.1. Market Analysis, Insights and Forecast - by Screen Size
- 10.1.1. Up to 20 ft
- 10.1.2. 20-50 ft
- 10.1.3. Above 50 ft
- 10.2. Market Analysis, Insights and Forecast - by Area
- 10.2.1. Small-scale
- 10.2.2. Large-scale
- 10.3. Market Analysis, Insights and Forecast - by Technology
- 10.3.1. 2D
- 10.3.2. 3D
- 10.4. Market Analysis, Insights and Forecast - by Application
- 10.4.1. Restaurant parking lots
- 10.4.2. Theater parking lots
- 10.1. Market Analysis, Insights and Forecast - by Screen Size
- 11. Competitive Analysis
- 11.1. Global Market Share Analysis 2024
- 11.2. Company Profiles
- 11.2.1 Shankweiler's Drive-In Theatre
- 11.2.1.1. Overview
- 11.2.1.2. Products
- 11.2.1.3. SWOT Analysis
- 11.2.1.4. Recent Developments
- 11.2.1.5. Financials (Based on Availability)
- 11.2.2 West Wind Drive-Ins
- 11.2.2.1. Overview
- 11.2.2.2. Products
- 11.2.2.3. SWOT Analysis
- 11.2.2.4. Recent Developments
- 11.2.2.5. Financials (Based on Availability)
- 11.2.3 Van Buren Drive-In Theatre
- 11.2.3.1. Overview
- 11.2.3.2. Products
- 11.2.3.3. SWOT Analysis
- 11.2.3.4. Recent Developments
- 11.2.3.5. Financials (Based on Availability)
- 11.2.4 Bengies Drive-In Theater
- 11.2.4.1. Overview
- 11.2.4.2. Products
- 11.2.4.3. SWOT Analysis
- 11.2.4.4. Recent Developments
- 11.2.4.5. Financials (Based on Availability)
- 11.2.5 Maryland Skyline Drive-In NYC
- 11.2.5.1. Overview
- 11.2.5.2. Products
- 11.2.5.3. SWOT Analysis
- 11.2.5.4. Recent Developments
- 11.2.5.5. Financials (Based on Availability)
- 11.2.6 New YorkWellfleet Drive-In
- 11.2.6.1. Overview
- 11.2.6.2. Products
- 11.2.6.3. SWOT Analysis
- 11.2.6.4. Recent Developments
- 11.2.6.5. Financials (Based on Availability)
- 11.2.7 MassachusettsCoyote Drive-In & Canteen
- 11.2.7.1. Overview
- 11.2.7.2. Products
- 11.2.7.3. SWOT Analysis
- 11.2.7.4. Recent Developments
- 11.2.7.5. Financials (Based on Availability)
- 11.2.8 TexasFamily Drive-InCapri Drive-In Theatre
- 11.2.8.1. Overview
- 11.2.8.2. Products
- 11.2.8.3. SWOT Analysis
- 11.2.8.4. Recent Developments
- 11.2.8.5. Financials (Based on Availability)
- 11.2.9 MichiganStar Drive-In Theatre
- 11.2.9.1. Overview
- 11.2.9.2. Products
- 11.2.9.3. SWOT Analysis
- 11.2.9.4. Recent Developments
- 11.2.9.5. Financials (Based on Availability)
- 11.2.10 Galaxy Drive-In Theatre
- 11.2.10.1. Overview
- 11.2.10.2. Products
- 11.2.10.3. SWOT Analysis
- 11.2.10.4. Recent Developments
- 11.2.10.5. Financials (Based on Availability)
- 11.2.11 Sunset Cinema Club
- 11.2.11.1. Overview
- 11.2.11.2. Products
- 11.2.11.3. SWOT Analysis
- 11.2.11.4. Recent Developments
- 11.2.11.5. Financials (Based on Availability)
- 11.2.1 Shankweiler's Drive-In Theatre
- Figure 1: Global Drive-in-Movie Theater Market Revenue Breakdown (Billion, %) by Region 2024 & 2032
- Figure 2: Global Drive-in-Movie Theater Market Volume Breakdown (K Units, %) by Region 2024 & 2032
- Figure 3: North America Drive-in-Movie Theater Market Revenue (Billion), by Screen Size 2024 & 2032
- Figure 4: North America Drive-in-Movie Theater Market Volume (K Units), by Screen Size 2024 & 2032
- Figure 5: North America Drive-in-Movie Theater Market Revenue Share (%), by Screen Size 2024 & 2032
- Figure 6: North America Drive-in-Movie Theater Market Volume Share (%), by Screen Size 2024 & 2032
- Figure 7: North America Drive-in-Movie Theater Market Revenue (Billion), by Area 2024 & 2032
- Figure 8: North America Drive-in-Movie Theater Market Volume (K Units), by Area 2024 & 2032
- Figure 9: North America Drive-in-Movie Theater Market Revenue Share (%), by Area 2024 & 2032
- Figure 10: North America Drive-in-Movie Theater Market Volume Share (%), by Area 2024 & 2032
- Figure 11: North America Drive-in-Movie Theater Market Revenue (Billion), by Technology 2024 & 2032
- Figure 12: North America Drive-in-Movie Theater Market Volume (K Units), by Technology 2024 & 2032
- Figure 13: North America Drive-in-Movie Theater Market Revenue Share (%), by Technology 2024 & 2032
- Figure 14: North America Drive-in-Movie Theater Market Volume Share (%), by Technology 2024 & 2032
- Figure 15: North America Drive-in-Movie Theater Market Revenue (Billion), by Application 2024 & 2032
- Figure 16: North America Drive-in-Movie Theater Market Volume (K Units), by Application 2024 & 2032
- Figure 17: North America Drive-in-Movie Theater Market Revenue Share (%), by Application 2024 & 2032
- Figure 18: North America Drive-in-Movie Theater Market Volume Share (%), by Application 2024 & 2032
- Figure 19: North America Drive-in-Movie Theater Market Revenue (Billion), by Country 2024 & 2032
- Figure 20: North America Drive-in-Movie Theater Market Volume (K Units), by Country 2024 & 2032
- Figure 21: North America Drive-in-Movie Theater Market Revenue Share (%), by Country 2024 & 2032
- Figure 22: North America Drive-in-Movie Theater Market Volume Share (%), by Country 2024 & 2032
- Figure 23: Europe Drive-in-Movie Theater Market Revenue (Billion), by Screen Size 2024 & 2032
- Figure 24: Europe Drive-in-Movie Theater Market Volume (K Units), by Screen Size 2024 & 2032
- Figure 25: Europe Drive-in-Movie Theater Market Revenue Share (%), by Screen Size 2024 & 2032
- Figure 26: Europe Drive-in-Movie Theater Market Volume Share (%), by Screen Size 2024 & 2032
- Figure 27: Europe Drive-in-Movie Theater Market Revenue (Billion), by Area 2024 & 2032
- Figure 28: Europe Drive-in-Movie Theater Market Volume (K Units), by Area 2024 & 2032
- Figure 29: Europe Drive-in-Movie Theater Market Revenue Share (%), by Area 2024 & 2032
- Figure 30: Europe Drive-in-Movie Theater Market Volume Share (%), by Area 2024 & 2032
- Figure 31: Europe Drive-in-Movie Theater Market Revenue (Billion), by Technology 2024 & 2032
- Figure 32: Europe Drive-in-Movie Theater Market Volume (K Units), by Technology 2024 & 2032
- Figure 33: Europe Drive-in-Movie Theater Market Revenue Share (%), by Technology 2024 & 2032
- Figure 34: Europe Drive-in-Movie Theater Market Volume Share (%), by Technology 2024 & 2032
- Figure 35: Europe Drive-in-Movie Theater Market Revenue (Billion), by Application 2024 & 2032
- Figure 36: Europe Drive-in-Movie Theater Market Volume (K Units), by Application 2024 & 2032
- Figure 37: Europe Drive-in-Movie Theater Market Revenue Share (%), by Application 2024 & 2032
- Figure 38: Europe Drive-in-Movie Theater Market Volume Share (%), by Application 2024 & 2032
- Figure 39: Europe Drive-in-Movie Theater Market Revenue (Billion), by Country 2024 & 2032
- Figure 40: Europe Drive-in-Movie Theater Market Volume (K Units), by Country 2024 & 2032
- Figure 41: Europe Drive-in-Movie Theater Market Revenue Share (%), by Country 2024 & 2032
- Figure 42: Europe Drive-in-Movie Theater Market Volume Share (%), by Country 2024 & 2032
- Figure 43: Asia Pacific Drive-in-Movie Theater Market Revenue (Billion), by Screen Size 2024 & 2032
- Figure 44: Asia Pacific Drive-in-Movie Theater Market Volume (K Units), by Screen Size 2024 & 2032
- Figure 45: Asia Pacific Drive-in-Movie Theater Market Revenue Share (%), by Screen Size 2024 & 2032
- Figure 46: Asia Pacific Drive-in-Movie Theater Market Volume Share (%), by Screen Size 2024 & 2032
- Figure 47: Asia Pacific Drive-in-Movie Theater Market Revenue (Billion), by Area 2024 & 2032
- Figure 48: Asia Pacific Drive-in-Movie Theater Market Volume (K Units), by Area 2024 & 2032
- Figure 49: Asia Pacific Drive-in-Movie Theater Market Revenue Share (%), by Area 2024 & 2032
- Figure 50: Asia Pacific Drive-in-Movie Theater Market Volume Share (%), by Area 2024 & 2032
- Figure 51: Asia Pacific Drive-in-Movie Theater Market Revenue (Billion), by Technology 2024 & 2032
- Figure 52: Asia Pacific Drive-in-Movie Theater Market Volume (K Units), by Technology 2024 & 2032
- Figure 53: Asia Pacific Drive-in-Movie Theater Market Revenue Share (%), by Technology 2024 & 2032
- Figure 54: Asia Pacific Drive-in-Movie Theater Market Volume Share (%), by Technology 2024 & 2032
- Figure 55: Asia Pacific Drive-in-Movie Theater Market Revenue (Billion), by Application 2024 & 2032
- Figure 56: Asia Pacific Drive-in-Movie Theater Market Volume (K Units), by Application 2024 & 2032
- Figure 57: Asia Pacific Drive-in-Movie Theater Market Revenue Share (%), by Application 2024 & 2032
- Figure 58: Asia Pacific Drive-in-Movie Theater Market Volume Share (%), by Application 2024 & 2032
- Figure 59: Asia Pacific Drive-in-Movie Theater Market Revenue (Billion), by Country 2024 & 2032
- Figure 60: Asia Pacific Drive-in-Movie Theater Market Volume (K Units), by Country 2024 & 2032
- Figure 61: Asia Pacific Drive-in-Movie Theater Market Revenue Share (%), by Country 2024 & 2032
- Figure 62: Asia Pacific Drive-in-Movie Theater Market Volume Share (%), by Country 2024 & 2032
- Figure 63: Latin America Drive-in-Movie Theater Market Revenue (Billion), by Screen Size 2024 & 2032
- Figure 64: Latin America Drive-in-Movie Theater Market Volume (K Units), by Screen Size 2024 & 2032
- Figure 65: Latin America Drive-in-Movie Theater Market Revenue Share (%), by Screen Size 2024 & 2032
- Figure 66: Latin America Drive-in-Movie Theater Market Volume Share (%), by Screen Size 2024 & 2032
- Figure 67: Latin America Drive-in-Movie Theater Market Revenue (Billion), by Area 2024 & 2032
- Figure 68: Latin America Drive-in-Movie Theater Market Volume (K Units), by Area 2024 & 2032
- Figure 69: Latin America Drive-in-Movie Theater Market Revenue Share (%), by Area 2024 & 2032
- Figure 70: Latin America Drive-in-Movie Theater Market Volume Share (%), by Area 2024 & 2032
- Figure 71: Latin America Drive-in-Movie Theater Market Revenue (Billion), by Technology 2024 & 2032
- Figure 72: Latin America Drive-in-Movie Theater Market Volume (K Units), by Technology 2024 & 2032
- Figure 73: Latin America Drive-in-Movie Theater Market Revenue Share (%), by Technology 2024 & 2032
- Figure 74: Latin America Drive-in-Movie Theater Market Volume Share (%), by Technology 2024 & 2032
- Figure 75: Latin America Drive-in-Movie Theater Market Revenue (Billion), by Application 2024 & 2032
- Figure 76: Latin America Drive-in-Movie Theater Market Volume (K Units), by Application 2024 & 2032
- Figure 77: Latin America Drive-in-Movie Theater Market Revenue Share (%), by Application 2024 & 2032
- Figure 78: Latin America Drive-in-Movie Theater Market Volume Share (%), by Application 2024 & 2032
- Figure 79: Latin America Drive-in-Movie Theater Market Revenue (Billion), by Country 2024 & 2032
- Figure 80: Latin America Drive-in-Movie Theater Market Volume (K Units), by Country 2024 & 2032
- Figure 81: Latin America Drive-in-Movie Theater Market Revenue Share (%), by Country 2024 & 2032
- Figure 82: Latin America Drive-in-Movie Theater Market Volume Share (%), by Country 2024 & 2032
- Figure 83: MEA Drive-in-Movie Theater Market Revenue (Billion), by Screen Size 2024 & 2032
- Figure 84: MEA Drive-in-Movie Theater Market Volume (K Units), by Screen Size 2024 & 2032
- Figure 85: MEA Drive-in-Movie Theater Market Revenue Share (%), by Screen Size 2024 & 2032
- Figure 86: MEA Drive-in-Movie Theater Market Volume Share (%), by Screen Size 2024 & 2032
- Figure 87: MEA Drive-in-Movie Theater Market Revenue (Billion), by Area 2024 & 2032
- Figure 88: MEA Drive-in-Movie Theater Market Volume (K Units), by Area 2024 & 2032
- Figure 89: MEA Drive-in-Movie Theater Market Revenue Share (%), by Area 2024 & 2032
- Figure 90: MEA Drive-in-Movie Theater Market Volume Share (%), by Area 2024 & 2032
- Figure 91: MEA Drive-in-Movie Theater Market Revenue (Billion), by Technology 2024 & 2032
- Figure 92: MEA Drive-in-Movie Theater Market Volume (K Units), by Technology 2024 & 2032
- Figure 93: MEA Drive-in-Movie Theater Market Revenue Share (%), by Technology 2024 & 2032
- Figure 94: MEA Drive-in-Movie Theater Market Volume Share (%), by Technology 2024 & 2032
- Figure 95: MEA Drive-in-Movie Theater Market Revenue (Billion), by Application 2024 & 2032
- Figure 96: MEA Drive-in-Movie Theater Market Volume (K Units), by Application 2024 & 2032
- Figure 97: MEA Drive-in-Movie Theater Market Revenue Share (%), by Application 2024 & 2032
- Figure 98: MEA Drive-in-Movie Theater Market Volume Share (%), by Application 2024 & 2032
- Figure 99: MEA Drive-in-Movie Theater Market Revenue (Billion), by Country 2024 & 2032
- Figure 100: MEA Drive-in-Movie Theater Market Volume (K Units), by Country 2024 & 2032
- Figure 101: MEA Drive-in-Movie Theater Market Revenue Share (%), by Country 2024 & 2032
- Figure 102: MEA Drive-in-Movie Theater Market Volume Share (%), by Country 2024 & 2032
- Table 1: Global Drive-in-Movie Theater Market Revenue Billion Forecast, by Region 2019 & 2032
- Table 2: Global Drive-in-Movie Theater Market Volume K Units Forecast, by Region 2019 & 2032
- Table 3: Global Drive-in-Movie Theater Market Revenue Billion Forecast, by Screen Size 2019 & 2032
- Table 4: Global Drive-in-Movie Theater Market Volume K Units Forecast, by Screen Size 2019 & 2032
- Table 5: Global Drive-in-Movie Theater Market Revenue Billion Forecast, by Area 2019 & 2032
- Table 6: Global Drive-in-Movie Theater Market Volume K Units Forecast, by Area 2019 & 2032
- Table 7: Global Drive-in-Movie Theater Market Revenue Billion Forecast, by Technology 2019 & 2032
- Table 8: Global Drive-in-Movie Theater Market Volume K Units Forecast, by Technology 2019 & 2032
- Table 9: Global Drive-in-Movie Theater Market Revenue Billion Forecast, by Application 2019 & 2032
- Table 10: Global Drive-in-Movie Theater Market Volume K Units Forecast, by Application 2019 & 2032
- Table 11: Global Drive-in-Movie Theater Market Revenue Billion Forecast, by Region 2019 & 2032
- Table 12: Global Drive-in-Movie Theater Market Volume K Units Forecast, by Region 2019 & 2032
- Table 13: Global Drive-in-Movie Theater Market Revenue Billion Forecast, by Screen Size 2019 & 2032
- Table 14: Global Drive-in-Movie Theater Market Volume K Units Forecast, by Screen Size 2019 & 2032
- Table 15: Global Drive-in-Movie Theater Market Revenue Billion Forecast, by Area 2019 & 2032
- Table 16: Global Drive-in-Movie Theater Market Volume K Units Forecast, by Area 2019 & 2032
- Table 17: Global Drive-in-Movie Theater Market Revenue Billion Forecast, by Technology 2019 & 2032
- Table 18: Global Drive-in-Movie Theater Market Volume K Units Forecast, by Technology 2019 & 2032
- Table 19: Global Drive-in-Movie Theater Market Revenue Billion Forecast, by Application 2019 & 2032
- Table 20: Global Drive-in-Movie Theater Market Volume K Units Forecast, by Application 2019 & 2032
- Table 21: Global Drive-in-Movie Theater Market Revenue Billion Forecast, by Country 2019 & 2032
- Table 22: Global Drive-in-Movie Theater Market Volume K Units Forecast, by Country 2019 & 2032
- Table 23: U.S. Drive-in-Movie Theater Market Revenue (Billion) Forecast, by Application 2019 & 2032
- Table 24: U.S. Drive-in-Movie Theater Market Volume (K Units) Forecast, by Application 2019 & 2032
- Table 25: Canada Drive-in-Movie Theater Market Revenue (Billion) Forecast, by Application 2019 & 2032
- Table 26: Canada Drive-in-Movie Theater Market Volume (K Units) Forecast, by Application 2019 & 2032
- Table 27: Global Drive-in-Movie Theater Market Revenue Billion Forecast, by Screen Size 2019 & 2032
- Table 28: Global Drive-in-Movie Theater Market Volume K Units Forecast, by Screen Size 2019 & 2032
- Table 29: Global Drive-in-Movie Theater Market Revenue Billion Forecast, by Area 2019 & 2032
- Table 30: Global Drive-in-Movie Theater Market Volume K Units Forecast, by Area 2019 & 2032
- Table 31: Global Drive-in-Movie Theater Market Revenue Billion Forecast, by Technology 2019 & 2032
- Table 32: Global Drive-in-Movie Theater Market Volume K Units Forecast, by Technology 2019 & 2032
- Table 33: Global Drive-in-Movie Theater Market Revenue Billion Forecast, by Application 2019 & 2032
- Table 34: Global Drive-in-Movie Theater Market Volume K Units Forecast, by Application 2019 & 2032
- Table 35: Global Drive-in-Movie Theater Market Revenue Billion Forecast, by Country 2019 & 2032
- Table 36: Global Drive-in-Movie Theater Market Volume K Units Forecast, by Country 2019 & 2032
- Table 37: Germany Drive-in-Movie Theater Market Revenue (Billion) Forecast, by Application 2019 & 2032
- Table 38: Germany Drive-in-Movie Theater Market Volume (K Units) Forecast, by Application 2019 & 2032
- Table 39: UK Drive-in-Movie Theater Market Revenue (Billion) Forecast, by Application 2019 & 2032
- Table 40: UK Drive-in-Movie Theater Market Volume (K Units) Forecast, by Application 2019 & 2032
- Table 41: France Drive-in-Movie Theater Market Revenue (Billion) Forecast, by Application 2019 & 2032
- Table 42: France Drive-in-Movie Theater Market Volume (K Units) Forecast, by Application 2019 & 2032
- Table 43: Italy Drive-in-Movie Theater Market Revenue (Billion) Forecast, by Application 2019 & 2032
- Table 44: Italy Drive-in-Movie Theater Market Volume (K Units) Forecast, by Application 2019 & 2032
- Table 45: Spain Drive-in-Movie Theater Market Revenue (Billion) Forecast, by Application 2019 & 2032
- Table 46: Spain Drive-in-Movie Theater Market Volume (K Units) Forecast, by Application 2019 & 2032
- Table 47: Global Drive-in-Movie Theater Market Revenue Billion Forecast, by Screen Size 2019 & 2032
- Table 48: Global Drive-in-Movie Theater Market Volume K Units Forecast, by Screen Size 2019 & 2032
- Table 49: Global Drive-in-Movie Theater Market Revenue Billion Forecast, by Area 2019 & 2032
- Table 50: Global Drive-in-Movie Theater Market Volume K Units Forecast, by Area 2019 & 2032
- Table 51: Global Drive-in-Movie Theater Market Revenue Billion Forecast, by Technology 2019 & 2032
- Table 52: Global Drive-in-Movie Theater Market Volume K Units Forecast, by Technology 2019 & 2032
- Table 53: Global Drive-in-Movie Theater Market Revenue Billion Forecast, by Application 2019 & 2032
- Table 54: Global Drive-in-Movie Theater Market Volume K Units Forecast, by Application 2019 & 2032
- Table 55: Global Drive-in-Movie Theater Market Revenue Billion Forecast, by Country 2019 & 2032
- Table 56: Global Drive-in-Movie Theater Market Volume K Units Forecast, by Country 2019 & 2032
- Table 57: China Drive-in-Movie Theater Market Revenue (Billion) Forecast, by Application 2019 & 2032
- Table 58: China Drive-in-Movie Theater Market Volume (K Units) Forecast, by Application 2019 & 2032
- Table 59: Japan Drive-in-Movie Theater Market Revenue (Billion) Forecast, by Application 2019 & 2032
- Table 60: Japan Drive-in-Movie Theater Market Volume (K Units) Forecast, by Application 2019 & 2032
- Table 61: India Drive-in-Movie Theater Market Revenue (Billion) Forecast, by Application 2019 & 2032
- Table 62: India Drive-in-Movie Theater Market Volume (K Units) Forecast, by Application 2019 & 2032
- Table 63: South Korea Drive-in-Movie Theater Market Revenue (Billion) Forecast, by Application 2019 & 2032
- Table 64: South Korea Drive-in-Movie Theater Market Volume (K Units) Forecast, by Application 2019 & 2032
- Table 65: ANZ Drive-in-Movie Theater Market Revenue (Billion) Forecast, by Application 2019 & 2032
- Table 66: ANZ Drive-in-Movie Theater Market Volume (K Units) Forecast, by Application 2019 & 2032
- Table 67: Global Drive-in-Movie Theater Market Revenue Billion Forecast, by Screen Size 2019 & 2032
- Table 68: Global Drive-in-Movie Theater Market Volume K Units Forecast, by Screen Size 2019 & 2032
- Table 69: Global Drive-in-Movie Theater Market Revenue Billion Forecast, by Area 2019 & 2032
- Table 70: Global Drive-in-Movie Theater Market Volume K Units Forecast, by Area 2019 & 2032
- Table 71: Global Drive-in-Movie Theater Market Revenue Billion Forecast, by Technology 2019 & 2032
- Table 72: Global Drive-in-Movie Theater Market Volume K Units Forecast, by Technology 2019 & 2032
- Table 73: Global Drive-in-Movie Theater Market Revenue Billion Forecast, by Application 2019 & 2032
- Table 74: Global Drive-in-Movie Theater Market Volume K Units Forecast, by Application 2019 & 2032
- Table 75: Global Drive-in-Movie Theater Market Revenue Billion Forecast, by Country 2019 & 2032
- Table 76: Global Drive-in-Movie Theater Market Volume K Units Forecast, by Country 2019 & 2032
- Table 77: Brazil Drive-in-Movie Theater Market Revenue (Billion) Forecast, by Application 2019 & 2032
- Table 78: Brazil Drive-in-Movie Theater Market Volume (K Units) Forecast, by Application 2019 & 2032
- Table 79: Mexico Drive-in-Movie Theater Market Revenue (Billion) Forecast, by Application 2019 & 2032
- Table 80: Mexico Drive-in-Movie Theater Market Volume (K Units) Forecast, by Application 2019 & 2032
- Table 81: Global Drive-in-Movie Theater Market Revenue Billion Forecast, by Screen Size 2019 & 2032
- Table 82: Global Drive-in-Movie Theater Market Volume K Units Forecast, by Screen Size 2019 & 2032
- Table 83: Global Drive-in-Movie Theater Market Revenue Billion Forecast, by Area 2019 & 2032
- Table 84: Global Drive-in-Movie Theater Market Volume K Units Forecast, by Area 2019 & 2032
- Table 85: Global Drive-in-Movie Theater Market Revenue Billion Forecast, by Technology 2019 & 2032
- Table 86: Global Drive-in-Movie Theater Market Volume K Units Forecast, by Technology 2019 & 2032
- Table 87: Global Drive-in-Movie Theater Market Revenue Billion Forecast, by Application 2019 & 2032
- Table 88: Global Drive-in-Movie Theater Market Volume K Units Forecast, by Application 2019 & 2032
- Table 89: Global Drive-in-Movie Theater Market Revenue Billion Forecast, by Country 2019 & 2032
- Table 90: Global Drive-in-Movie Theater Market Volume K Units Forecast, by Country 2019 & 2032
- Table 91: UAE Drive-in-Movie Theater Market Revenue (Billion) Forecast, by Application 2019 & 2032
- Table 92: UAE Drive-in-Movie Theater Market Volume (K Units) Forecast, by Application 2019 & 2032
- Table 93: Saudi Arabia Drive-in-Movie Theater Market Revenue (Billion) Forecast, by Application 2019 & 2032
- Table 94: Saudi Arabia Drive-in-Movie Theater Market Volume (K Units) Forecast, by Application 2019 & 2032
- Table 95: South Africa Drive-in-Movie Theater Market Revenue (Billion) Forecast, by Application 2019 & 2032
- Table 96: South Africa Drive-in-Movie Theater Market Volume (K Units) Forecast, by Application 2019 & 2032
STEP 1 - Identification of Relevant Samples Size from Population Database


STEP 2 - Approaches for Defining Global Market Size (Value, Volume* & Price*)

Note* : In applicable scenarios
STEP 3 - Data Sources
Primary Research
- Web Analytics
- Survey Reports
- Research Institute
- Latest Research Reports
- Opinion Leaders
Secondary Research
- Annual Reports
- White Paper
- Latest Press Release
- Industry Association
- Paid Database
- Investor Presentations

STEP 4 - Data Triangulation
Involves using different sources of information in order to increase the validity of a study
These sources are likely to be stakeholders in a program - participants, other researchers, program staff, other community members, and so on.
Then we put all data in single framework & apply various statistical tools to find out the dynamic on the market.
During the analysis stage, feedback from the stakeholder groups would be compared to determine areas of agreement as well as areas of divergence
Frequently Asked Questions
Related Reports
See the similar reports


About Market Insights Report
Market Insights Reports offers comprehensive market research reports and analysis, giving businesses important information about their clients, rivals, and sector to help them make well-informed decisions on operations, marketing, and business strategy. We offer a variety of services in addition to market research, data analysis, and strategy planning. In order to find opportunities and learn more about our competitors and the industry at large, we employ competitive analysis. To identify areas for development, we also evaluate our performance against that of our rivals. We can determine the places at which we can offer our clients the most value by performing value chain analysis.
Additionally, clients receive a thorough overview of their industry business environment. We can find trends that help us forecast future possibilities and threats by examining global macroeconomic dynamics and consumer behavior patterns. By analyzing their features and advantages, contrasting them with comparable items on the market, and evaluating both their quantitative and qualitative performance, we comprehensively evaluate our clients' products. This allows us to assist customers in determining how their goods compare to those of their rivals and in creating successful marketing plans. Our group has been successful in gaining a thorough grasp of our clients' requirements and offering them creative solutions. We currently provide services to more than 50 nations in Europe, the Middle East, Africa, Latin America, Asia Pacific, and North America. Because of our global reach, we have been able to establish trusting bonds with our partners and clients in various nations, improving customer service and forging a more cohesive worldwide presence.