Report banner
Mobile Mapping Market
Updated On

Mar 2 2025

Total Pages

230

Mobile Mapping Market Growth Opportunities and Market Forecast 2025-2033: A Strategic Analysis

Mobile Mapping Market by Component (Hardware, Software, Service), by Application (Road & Railway Surveys, GIS Data Collection, Vehicle Control & Guidance, Asset Management), by End-use (Agriculture, BFSI, Government & Public Sector, Real Estate, Retail, Mining, Telecommunication, Transport & Logistics, Others), by North America (U.S., Canada), by Europe (UK, Germany, France, Italy, Spain, Rest of Europe), by Asia Pacific (China, Japan, India, ANZ, South Korea, Southeast Asia, RoAPAC), by Latin America (Brazil, Argentina, Mexico, Rest of Latin America), by Middle East & Africa (GCC, Israel, South Africa, Rest of MEA) Forecast 2025-2033

Publisher Logo

Mobile Mapping Market Growth Opportunities and Market Forecast 2025-2033: A Strategic Analysis


Key Insights

The Mobile Mapping Market, currently valued at $20 billion, is experiencing robust growth, projected to expand at a Compound Annual Growth Rate (CAGR) of 15%. This surge is driven by a confluence of factors. The increasing demand for precise and up-to-date geospatial data across diverse sectors fuels the adoption of mobile mapping technologies. Governments worldwide are investing heavily in infrastructure development projects, necessitating efficient and accurate surveying techniques, thus boosting market demand. Simultaneously, the rise of smart cities and autonomous vehicles is creating a significant need for comprehensive and real-time mapping solutions. Technological advancements, including the development of high-resolution sensors, advanced data processing algorithms, and improved positioning systems, are enhancing the capabilities and affordability of mobile mapping systems, further accelerating market expansion. The applications of mobile mapping are vast, ranging from road and railway surveys and GIS data collection to asset management and vehicle guidance systems. Key players in the market are continuously innovating and expanding their product portfolios to cater to this growing demand.

Mobile Mapping Market Research Report - Market Size, Growth & Forecast

Mobile Mapping Market Concentration & Characteristics

The mobile mapping market exhibits a moderately concentrated structure, with a few large players dominating the hardware and software segments. However, a significant number of smaller companies and startups are active in providing specialized services and niche applications. Innovation in the market is characterized by continuous improvements in sensor technology, data processing algorithms, and integration with other technologies such as artificial intelligence (AI) and machine learning (ML). Regulations regarding data privacy and security are increasingly impacting the market, necessitating compliance with stringent data handling protocols. Product substitutes, such as traditional surveying methods, still exist but are increasingly being replaced by the speed, efficiency, and accuracy of mobile mapping. End-user concentration is broad, encompassing government agencies, private companies in various sectors (construction, agriculture, transportation), and research institutions. The level of mergers and acquisitions (M&A) activity is moderate, with larger companies strategically acquiring smaller firms to expand their product offerings and technological capabilities.

Mobile Mapping Market Trends

The mobile mapping market is witnessing several transformative trends. The integration of AI and ML is significantly enhancing the efficiency and accuracy of data processing and analysis, enabling automated feature extraction and classification. The increasing adoption of cloud-based solutions for data storage and processing is facilitating collaboration and improving accessibility to geospatial data. Furthermore, the convergence of mobile mapping with other technologies, such as LiDAR and photogrammetry, is leading to the development of highly integrated and versatile mapping systems. There is a growing focus on developing solutions that cater to specific industry needs, resulting in the emergence of specialized mobile mapping systems for applications like autonomous driving, precision agriculture, and infrastructure monitoring. The use of drones and other unmanned aerial vehicles (UAVs) for mobile mapping is also gaining traction, expanding the reach and application of the technology. The rising demand for 3D city models and digital twins is further driving the adoption of mobile mapping solutions. Security concerns are being addressed with the implementation of robust cybersecurity measures, ensuring the integrity and confidentiality of geospatial data.

Mobile Mapping Market Growth

Key Region or Country & Segment to Dominate the Market

  • North America: This region currently holds a significant market share due to the high adoption rate of advanced technologies and the presence of major players. The US, in particular, benefits from robust infrastructure development projects and government initiatives supporting the use of geospatial data.
  • Europe: High government spending on infrastructure modernization projects, combined with the growth of smart city initiatives, fuels the demand for mobile mapping services. Germany and the UK are prominent markets within the region.
  • Asia Pacific: This region is experiencing rapid growth, driven by rapid urbanization, infrastructure expansion, and the growing adoption of technology across various industries. China and India are key growth markets.

Dominant Segments:

  • Hardware: The hardware segment, encompassing imaging, laser ranging & scanning, and positioning devices, holds a substantial market share due to the continuous improvement in the quality and capabilities of these components.
  • Software: The demand for sophisticated mapping software capable of processing and analyzing vast amounts of geospatial data is driving the expansion of the software segment. Features like automated feature extraction and AI-powered analysis are key drivers.
  • Application: The Road & Railway Surveys and GIS Data Collection applications currently dominate due to their wide-ranging needs and existing substantial market presence.

The growth in these regions and segments is projected to continue due to government investments, technological advancements, and the increasing demand for precise and reliable geospatial data across various sectors.

Mobile Mapping Market Product Insights Report Coverage & Deliverables

This report provides a comprehensive analysis of the Mobile Mapping Market, including market size, market share, and growth projections. It covers key market trends, driving forces, challenges, and restraints. The report also includes a detailed regional analysis, segment-wise market analysis, and profiles of key players in the market. Deliverables include market size estimations, market share analysis, CAGR projections, segment-wise market analysis, regional analysis, and company profiles.

Mobile Mapping Market Analysis

The Mobile Mapping Market is segmented by component (hardware, software, services), application (road & railway surveys, GIS data collection, vehicle control & guidance, asset management), and end-use (agriculture, BFSI, government & public sector, real estate, retail, mining, telecommunication, transport & logistics, others). Market size is calculated by aggregating revenues from all these segments and regions. Market share analysis reveals the relative positions of major players and helps determine the level of market concentration. Growth analysis, using historical data and future projections, identifies trends and provides a basis for strategic decision-making. This analysis includes evaluating the impact of market drivers and restraints on the overall growth trajectory. The competitive landscape is assessed by profiling major market players and analyzing their strategies, market positioning, and product offerings.

Mobile Mapping Market Regional Insights

  • North America
    • U.S.
    • Canada
  • Europe
    • UK
    • Germany
    • France
    • Italy
    • Spain
    • Rest of Europe
  • Asia Pacific
    • China
    • Japan
    • India
    • ANZ
    • South Korea
    • Southeast Asia
    • RoAPAC
  • Latin America
    • Brazil
    • Argentina
    • Mexico
    • Rest of Latin America
  • Middle East & Africa
    • GCC
    • Israel
    • South Africa
    • Rest of MEA

Each region's market is analyzed based on the same segmentation criteria as the overall market (components, applications, end-use). Regional variations in market growth are identified and explained based on factors like technological adoption rates, government regulations, economic conditions, and infrastructure development.

Driving Forces: What's Propelling the Mobile Mapping Market

  • Increasing demand for precise geospatial data across various sectors.
  • Government investments in infrastructure development and smart city initiatives.
  • Technological advancements in sensor technology, data processing, and AI/ML integration.
  • Growing adoption of autonomous vehicles and the need for advanced mapping solutions.
  • Rising demand for 3D city models and digital twins.

Challenges and Restraints in Mobile Mapping Market

  • High initial investment costs associated with acquiring mobile mapping systems.
  • The need for skilled professionals to operate and interpret data from mobile mapping systems.
  • Data security and privacy concerns related to the collection and handling of geospatial data.
  • Potential for inaccurate data due to environmental factors or equipment limitations.
  • Competition from traditional surveying methods and other alternative technologies.

Emerging Trends in Mobile Mapping Market

  • Increased use of AI and ML for automated data processing and analysis.
  • Growing adoption of cloud-based solutions for data storage and management.
  • Integration of mobile mapping with other technologies, such as LiDAR and UAVs.
  • Development of specialized mobile mapping systems for specific industry applications.
  • Focus on improving data accuracy and reliability.

Mobile Mapping Industry News

The mobile mapping industry is experiencing significant advancements, particularly with the integration of artificial intelligence (AI) to enhance user experiences. A notable development is Google's recent integration of its AI chatbot, Gemini, into mapping applications like Google Maps. This enhancement allows users to receive more tailored and context-aware responses to complex queries, such as specific activity recommendations based on time and location. For example, users can now ask, "What can I do tonight?" and receive accurate, real-time suggestions that consider various factors to avoid inaccuracies. This integration aims to provide a more intuitive and personalized navigation experience for over 2 billion monthly active users. 

Leading Players in the Mobile Mapping Market

Mobile Mapping Market Segmentation

  • 1. Component
    • 1.1. Hardware
    • 1.2. Software
    • 1.3. Service
  • 2. Application
    • 2.1. Road & Railway Surveys
    • 2.2. GIS Data Collection
    • 2.3. Vehicle Control & Guidance
    • 2.4. Asset Management
  • 3. End-use
    • 3.1. Agriculture
    • 3.2. BFSI
    • 3.3. Government & Public Sector
    • 3.4. Real Estate
    • 3.5. Retail
    • 3.6. Mining
    • 3.7. Telecommunication
    • 3.8. Transport & Logistics
    • 3.9. Others

Mobile Mapping Market Segmentation By Geography

  • 1. North America
    • 1.1. U.S.
    • 1.2. Canada
  • 2. Europe
    • 2.1. UK
    • 2.2. Germany
    • 2.3. France
    • 2.4. Italy
    • 2.5. Spain
    • 2.6. Rest of Europe
  • 3. Asia Pacific
    • 3.1. China
    • 3.2. Japan
    • 3.3. India
    • 3.4. ANZ
    • 3.5. South Korea
    • 3.6. Southeast Asia
    • 3.7. RoAPAC
  • 4. Latin America
    • 4.1. Brazil
    • 4.2. Argentina
    • 4.3. Mexico
    • 4.4. Rest of Latin America
  • 5. Middle East & Africa
    • 5.1. GCC
    • 5.2. Israel
    • 5.3. South Africa
    • 5.4. Rest of MEA

Mobile Mapping Market Regional Share


Mobile Mapping Market REPORT HIGHLIGHTS

AspectsDetails
Study Period 2019-2033
Base Year 2024
Estimated Year 2025
Forecast Period2025-2033
Historical Period2019-2024
Growth RateCAGR of 15% from 2019-2033
Segmentation
    • By Component
      • Hardware
      • Software
      • Service
    • By Application
      • Road & Railway Surveys
      • GIS Data Collection
      • Vehicle Control & Guidance
      • Asset Management
    • By End-use
      • Agriculture
      • BFSI
      • Government & Public Sector
      • Real Estate
      • Retail
      • Mining
      • Telecommunication
      • Transport & Logistics
      • Others
  • By Geography
    • North America
      • U.S.
      • Canada
    • Europe
      • UK
      • Germany
      • France
      • Italy
      • Spain
      • Rest of Europe
    • Asia Pacific
      • China
      • Japan
      • India
      • ANZ
      • South Korea
      • Southeast Asia
      • RoAPAC
    • Latin America
      • Brazil
      • Argentina
      • Mexico
      • Rest of Latin America
    • Middle East & Africa
      • GCC
      • Israel
      • South Africa
      • Rest of MEA


Table of Contents

  1. 1. Introduction
    • 1.1. Research Scope
    • 1.2. Market Segmentation
    • 1.3. Research Methodology
    • 1.4. Definitions and Assumptions
  2. 2. Executive Summary
    • 2.1. Introduction
  3. 3. Market Dynamics
    • 3.1. Introduction
      • 3.2. Market Drivers
        • 3.2.1 Rising demand for terrestrial mobile mapping in telecommunication and transportation
        • 3.2.2 Increasing penetration of mobile devices
        • 3.2.3 Increasing investment in city planning and smart city projects
        • 3.2.4 Improved network connectivity
        • 3.2.5 Growing role of optic fiber technology in driving smart cities
      • 3.3. Market Restrains
        • 3.3.1 Concerns regarding data accuracy
        • 3.3.2 High initial investment
      • 3.4. Market Trends
  4. 4. Market Factor Analysis
    • 4.1. Porters Five Forces
    • 4.2. Supply/Value Chain
    • 4.3. PESTEL analysis
    • 4.4. Market Entropy
    • 4.5. Patent/Trademark Analysis
  5. 5. Global Mobile Mapping Market Analysis, Insights and Forecast, 2019-2031
    • 5.1. Market Analysis, Insights and Forecast - by Component
      • 5.1.1. Hardware
      • 5.1.2. Software
      • 5.1.3. Service
    • 5.2. Market Analysis, Insights and Forecast - by Application
      • 5.2.1. Road & Railway Surveys
      • 5.2.2. GIS Data Collection
      • 5.2.3. Vehicle Control & Guidance
      • 5.2.4. Asset Management
    • 5.3. Market Analysis, Insights and Forecast - by End-use
      • 5.3.1. Agriculture
      • 5.3.2. BFSI
      • 5.3.3. Government & Public Sector
      • 5.3.4. Real Estate
      • 5.3.5. Retail
      • 5.3.6. Mining
      • 5.3.7. Telecommunication
      • 5.3.8. Transport & Logistics
      • 5.3.9. Others
    • 5.4. Market Analysis, Insights and Forecast - by Region
      • 5.4.1. North America
      • 5.4.2. Europe
      • 5.4.3. Asia Pacific
      • 5.4.4. Latin America
      • 5.4.5. Middle East & Africa
  6. 6. North America Mobile Mapping Market Analysis, Insights and Forecast, 2019-2031
    • 6.1. Market Analysis, Insights and Forecast - by Component
      • 6.1.1. Hardware
      • 6.1.2. Software
      • 6.1.3. Service
    • 6.2. Market Analysis, Insights and Forecast - by Application
      • 6.2.1. Road & Railway Surveys
      • 6.2.2. GIS Data Collection
      • 6.2.3. Vehicle Control & Guidance
      • 6.2.4. Asset Management
    • 6.3. Market Analysis, Insights and Forecast - by End-use
      • 6.3.1. Agriculture
      • 6.3.2. BFSI
      • 6.3.3. Government & Public Sector
      • 6.3.4. Real Estate
      • 6.3.5. Retail
      • 6.3.6. Mining
      • 6.3.7. Telecommunication
      • 6.3.8. Transport & Logistics
      • 6.3.9. Others
  7. 7. Europe Mobile Mapping Market Analysis, Insights and Forecast, 2019-2031
    • 7.1. Market Analysis, Insights and Forecast - by Component
      • 7.1.1. Hardware
      • 7.1.2. Software
      • 7.1.3. Service
    • 7.2. Market Analysis, Insights and Forecast - by Application
      • 7.2.1. Road & Railway Surveys
      • 7.2.2. GIS Data Collection
      • 7.2.3. Vehicle Control & Guidance
      • 7.2.4. Asset Management
    • 7.3. Market Analysis, Insights and Forecast - by End-use
      • 7.3.1. Agriculture
      • 7.3.2. BFSI
      • 7.3.3. Government & Public Sector
      • 7.3.4. Real Estate
      • 7.3.5. Retail
      • 7.3.6. Mining
      • 7.3.7. Telecommunication
      • 7.3.8. Transport & Logistics
      • 7.3.9. Others
  8. 8. Asia Pacific Mobile Mapping Market Analysis, Insights and Forecast, 2019-2031
    • 8.1. Market Analysis, Insights and Forecast - by Component
      • 8.1.1. Hardware
      • 8.1.2. Software
      • 8.1.3. Service
    • 8.2. Market Analysis, Insights and Forecast - by Application
      • 8.2.1. Road & Railway Surveys
      • 8.2.2. GIS Data Collection
      • 8.2.3. Vehicle Control & Guidance
      • 8.2.4. Asset Management
    • 8.3. Market Analysis, Insights and Forecast - by End-use
      • 8.3.1. Agriculture
      • 8.3.2. BFSI
      • 8.3.3. Government & Public Sector
      • 8.3.4. Real Estate
      • 8.3.5. Retail
      • 8.3.6. Mining
      • 8.3.7. Telecommunication
      • 8.3.8. Transport & Logistics
      • 8.3.9. Others
  9. 9. Latin America Mobile Mapping Market Analysis, Insights and Forecast, 2019-2031
    • 9.1. Market Analysis, Insights and Forecast - by Component
      • 9.1.1. Hardware
      • 9.1.2. Software
      • 9.1.3. Service
    • 9.2. Market Analysis, Insights and Forecast - by Application
      • 9.2.1. Road & Railway Surveys
      • 9.2.2. GIS Data Collection
      • 9.2.3. Vehicle Control & Guidance
      • 9.2.4. Asset Management
    • 9.3. Market Analysis, Insights and Forecast - by End-use
      • 9.3.1. Agriculture
      • 9.3.2. BFSI
      • 9.3.3. Government & Public Sector
      • 9.3.4. Real Estate
      • 9.3.5. Retail
      • 9.3.6. Mining
      • 9.3.7. Telecommunication
      • 9.3.8. Transport & Logistics
      • 9.3.9. Others
  10. 10. Middle East & Africa Mobile Mapping Market Analysis, Insights and Forecast, 2019-2031
    • 10.1. Market Analysis, Insights and Forecast - by Component
      • 10.1.1. Hardware
      • 10.1.2. Software
      • 10.1.3. Service
    • 10.2. Market Analysis, Insights and Forecast - by Application
      • 10.2.1. Road & Railway Surveys
      • 10.2.2. GIS Data Collection
      • 10.2.3. Vehicle Control & Guidance
      • 10.2.4. Asset Management
    • 10.3. Market Analysis, Insights and Forecast - by End-use
      • 10.3.1. Agriculture
      • 10.3.2. BFSI
      • 10.3.3. Government & Public Sector
      • 10.3.4. Real Estate
      • 10.3.5. Retail
      • 10.3.6. Mining
      • 10.3.7. Telecommunication
      • 10.3.8. Transport & Logistics
      • 10.3.9. Others
  11. 11. Competitive Analysis
    • 11.1. Global Market Share Analysis 2024
      • 11.2. Company Profiles
        • 11.2.1 Google LLC
          • 11.2.1.1. Overview
          • 11.2.1.2. Products
          • 11.2.1.3. SWOT Analysis
          • 11.2.1.4. Recent Developments
          • 11.2.1.5. Financials (Based on Availability)
        • 11.2.2 Apple Inc.
          • 11.2.2.1. Overview
          • 11.2.2.2. Products
          • 11.2.2.3. SWOT Analysis
          • 11.2.2.4. Recent Developments
          • 11.2.2.5. Financials (Based on Availability)
        • 11.2.3 Microsoft Corporation
          • 11.2.3.1. Overview
          • 11.2.3.2. Products
          • 11.2.3.3. SWOT Analysis
          • 11.2.3.4. Recent Developments
          • 11.2.3.5. Financials (Based on Availability)
        • 11.2.4 Alibaba Group
          • 11.2.4.1. Overview
          • 11.2.4.2. Products
          • 11.2.4.3. SWOT Analysis
          • 11.2.4.4. Recent Developments
          • 11.2.4.5. Financials (Based on Availability)
        • 11.2.5 aidu Inc.
          • 11.2.5.1. Overview
          • 11.2.5.2. Products
          • 11.2.5.3. SWOT Analysis
          • 11.2.5.4. Recent Developments
          • 11.2.5.5. Financials (Based on Availability)

List of Figures

  1. Figure 1: Global Mobile Mapping Market Revenue Breakdown (Billion, %) by Region 2024 & 2032
  2. Figure 2: Global Mobile Mapping Market Volume Breakdown (K Units, %) by Region 2024 & 2032
  3. Figure 3: North America Mobile Mapping Market Revenue (Billion), by Component 2024 & 2032
  4. Figure 4: North America Mobile Mapping Market Volume (K Units), by Component 2024 & 2032
  5. Figure 5: North America Mobile Mapping Market Revenue Share (%), by Component 2024 & 2032
  6. Figure 6: North America Mobile Mapping Market Volume Share (%), by Component 2024 & 2032
  7. Figure 7: North America Mobile Mapping Market Revenue (Billion), by Application 2024 & 2032
  8. Figure 8: North America Mobile Mapping Market Volume (K Units), by Application 2024 & 2032
  9. Figure 9: North America Mobile Mapping Market Revenue Share (%), by Application 2024 & 2032
  10. Figure 10: North America Mobile Mapping Market Volume Share (%), by Application 2024 & 2032
  11. Figure 11: North America Mobile Mapping Market Revenue (Billion), by End-use 2024 & 2032
  12. Figure 12: North America Mobile Mapping Market Volume (K Units), by End-use 2024 & 2032
  13. Figure 13: North America Mobile Mapping Market Revenue Share (%), by End-use 2024 & 2032
  14. Figure 14: North America Mobile Mapping Market Volume Share (%), by End-use 2024 & 2032
  15. Figure 15: North America Mobile Mapping Market Revenue (Billion), by Country 2024 & 2032
  16. Figure 16: North America Mobile Mapping Market Volume (K Units), by Country 2024 & 2032
  17. Figure 17: North America Mobile Mapping Market Revenue Share (%), by Country 2024 & 2032
  18. Figure 18: North America Mobile Mapping Market Volume Share (%), by Country 2024 & 2032
  19. Figure 19: Europe Mobile Mapping Market Revenue (Billion), by Component 2024 & 2032
  20. Figure 20: Europe Mobile Mapping Market Volume (K Units), by Component 2024 & 2032
  21. Figure 21: Europe Mobile Mapping Market Revenue Share (%), by Component 2024 & 2032
  22. Figure 22: Europe Mobile Mapping Market Volume Share (%), by Component 2024 & 2032
  23. Figure 23: Europe Mobile Mapping Market Revenue (Billion), by Application 2024 & 2032
  24. Figure 24: Europe Mobile Mapping Market Volume (K Units), by Application 2024 & 2032
  25. Figure 25: Europe Mobile Mapping Market Revenue Share (%), by Application 2024 & 2032
  26. Figure 26: Europe Mobile Mapping Market Volume Share (%), by Application 2024 & 2032
  27. Figure 27: Europe Mobile Mapping Market Revenue (Billion), by End-use 2024 & 2032
  28. Figure 28: Europe Mobile Mapping Market Volume (K Units), by End-use 2024 & 2032
  29. Figure 29: Europe Mobile Mapping Market Revenue Share (%), by End-use 2024 & 2032
  30. Figure 30: Europe Mobile Mapping Market Volume Share (%), by End-use 2024 & 2032
  31. Figure 31: Europe Mobile Mapping Market Revenue (Billion), by Country 2024 & 2032
  32. Figure 32: Europe Mobile Mapping Market Volume (K Units), by Country 2024 & 2032
  33. Figure 33: Europe Mobile Mapping Market Revenue Share (%), by Country 2024 & 2032
  34. Figure 34: Europe Mobile Mapping Market Volume Share (%), by Country 2024 & 2032
  35. Figure 35: Asia Pacific Mobile Mapping Market Revenue (Billion), by Component 2024 & 2032
  36. Figure 36: Asia Pacific Mobile Mapping Market Volume (K Units), by Component 2024 & 2032
  37. Figure 37: Asia Pacific Mobile Mapping Market Revenue Share (%), by Component 2024 & 2032
  38. Figure 38: Asia Pacific Mobile Mapping Market Volume Share (%), by Component 2024 & 2032
  39. Figure 39: Asia Pacific Mobile Mapping Market Revenue (Billion), by Application 2024 & 2032
  40. Figure 40: Asia Pacific Mobile Mapping Market Volume (K Units), by Application 2024 & 2032
  41. Figure 41: Asia Pacific Mobile Mapping Market Revenue Share (%), by Application 2024 & 2032
  42. Figure 42: Asia Pacific Mobile Mapping Market Volume Share (%), by Application 2024 & 2032
  43. Figure 43: Asia Pacific Mobile Mapping Market Revenue (Billion), by End-use 2024 & 2032
  44. Figure 44: Asia Pacific Mobile Mapping Market Volume (K Units), by End-use 2024 & 2032
  45. Figure 45: Asia Pacific Mobile Mapping Market Revenue Share (%), by End-use 2024 & 2032
  46. Figure 46: Asia Pacific Mobile Mapping Market Volume Share (%), by End-use 2024 & 2032
  47. Figure 47: Asia Pacific Mobile Mapping Market Revenue (Billion), by Country 2024 & 2032
  48. Figure 48: Asia Pacific Mobile Mapping Market Volume (K Units), by Country 2024 & 2032
  49. Figure 49: Asia Pacific Mobile Mapping Market Revenue Share (%), by Country 2024 & 2032
  50. Figure 50: Asia Pacific Mobile Mapping Market Volume Share (%), by Country 2024 & 2032
  51. Figure 51: Latin America Mobile Mapping Market Revenue (Billion), by Component 2024 & 2032
  52. Figure 52: Latin America Mobile Mapping Market Volume (K Units), by Component 2024 & 2032
  53. Figure 53: Latin America Mobile Mapping Market Revenue Share (%), by Component 2024 & 2032
  54. Figure 54: Latin America Mobile Mapping Market Volume Share (%), by Component 2024 & 2032
  55. Figure 55: Latin America Mobile Mapping Market Revenue (Billion), by Application 2024 & 2032
  56. Figure 56: Latin America Mobile Mapping Market Volume (K Units), by Application 2024 & 2032
  57. Figure 57: Latin America Mobile Mapping Market Revenue Share (%), by Application 2024 & 2032
  58. Figure 58: Latin America Mobile Mapping Market Volume Share (%), by Application 2024 & 2032
  59. Figure 59: Latin America Mobile Mapping Market Revenue (Billion), by End-use 2024 & 2032
  60. Figure 60: Latin America Mobile Mapping Market Volume (K Units), by End-use 2024 & 2032
  61. Figure 61: Latin America Mobile Mapping Market Revenue Share (%), by End-use 2024 & 2032
  62. Figure 62: Latin America Mobile Mapping Market Volume Share (%), by End-use 2024 & 2032
  63. Figure 63: Latin America Mobile Mapping Market Revenue (Billion), by Country 2024 & 2032
  64. Figure 64: Latin America Mobile Mapping Market Volume (K Units), by Country 2024 & 2032
  65. Figure 65: Latin America Mobile Mapping Market Revenue Share (%), by Country 2024 & 2032
  66. Figure 66: Latin America Mobile Mapping Market Volume Share (%), by Country 2024 & 2032
  67. Figure 67: Middle East & Africa Mobile Mapping Market Revenue (Billion), by Component 2024 & 2032
  68. Figure 68: Middle East & Africa Mobile Mapping Market Volume (K Units), by Component 2024 & 2032
  69. Figure 69: Middle East & Africa Mobile Mapping Market Revenue Share (%), by Component 2024 & 2032
  70. Figure 70: Middle East & Africa Mobile Mapping Market Volume Share (%), by Component 2024 & 2032
  71. Figure 71: Middle East & Africa Mobile Mapping Market Revenue (Billion), by Application 2024 & 2032
  72. Figure 72: Middle East & Africa Mobile Mapping Market Volume (K Units), by Application 2024 & 2032
  73. Figure 73: Middle East & Africa Mobile Mapping Market Revenue Share (%), by Application 2024 & 2032
  74. Figure 74: Middle East & Africa Mobile Mapping Market Volume Share (%), by Application 2024 & 2032
  75. Figure 75: Middle East & Africa Mobile Mapping Market Revenue (Billion), by End-use 2024 & 2032
  76. Figure 76: Middle East & Africa Mobile Mapping Market Volume (K Units), by End-use 2024 & 2032
  77. Figure 77: Middle East & Africa Mobile Mapping Market Revenue Share (%), by End-use 2024 & 2032
  78. Figure 78: Middle East & Africa Mobile Mapping Market Volume Share (%), by End-use 2024 & 2032
  79. Figure 79: Middle East & Africa Mobile Mapping Market Revenue (Billion), by Country 2024 & 2032
  80. Figure 80: Middle East & Africa Mobile Mapping Market Volume (K Units), by Country 2024 & 2032
  81. Figure 81: Middle East & Africa Mobile Mapping Market Revenue Share (%), by Country 2024 & 2032
  82. Figure 82: Middle East & Africa Mobile Mapping Market Volume Share (%), by Country 2024 & 2032

List of Tables

  1. Table 1: Global Mobile Mapping Market Revenue Billion Forecast, by Region 2019 & 2032
  2. Table 2: Global Mobile Mapping Market Volume K Units Forecast, by Region 2019 & 2032
  3. Table 3: Global Mobile Mapping Market Revenue Billion Forecast, by Component 2019 & 2032
  4. Table 4: Global Mobile Mapping Market Volume K Units Forecast, by Component 2019 & 2032
  5. Table 5: Global Mobile Mapping Market Revenue Billion Forecast, by Application 2019 & 2032
  6. Table 6: Global Mobile Mapping Market Volume K Units Forecast, by Application 2019 & 2032
  7. Table 7: Global Mobile Mapping Market Revenue Billion Forecast, by End-use 2019 & 2032
  8. Table 8: Global Mobile Mapping Market Volume K Units Forecast, by End-use 2019 & 2032
  9. Table 9: Global Mobile Mapping Market Revenue Billion Forecast, by Region 2019 & 2032
  10. Table 10: Global Mobile Mapping Market Volume K Units Forecast, by Region 2019 & 2032
  11. Table 11: Global Mobile Mapping Market Revenue Billion Forecast, by Component 2019 & 2032
  12. Table 12: Global Mobile Mapping Market Volume K Units Forecast, by Component 2019 & 2032
  13. Table 13: Global Mobile Mapping Market Revenue Billion Forecast, by Application 2019 & 2032
  14. Table 14: Global Mobile Mapping Market Volume K Units Forecast, by Application 2019 & 2032
  15. Table 15: Global Mobile Mapping Market Revenue Billion Forecast, by End-use 2019 & 2032
  16. Table 16: Global Mobile Mapping Market Volume K Units Forecast, by End-use 2019 & 2032
  17. Table 17: Global Mobile Mapping Market Revenue Billion Forecast, by Country 2019 & 2032
  18. Table 18: Global Mobile Mapping Market Volume K Units Forecast, by Country 2019 & 2032
  19. Table 19: U.S. Mobile Mapping Market Revenue (Billion) Forecast, by Application 2019 & 2032
  20. Table 20: U.S. Mobile Mapping Market Volume (K Units) Forecast, by Application 2019 & 2032
  21. Table 21: Canada Mobile Mapping Market Revenue (Billion) Forecast, by Application 2019 & 2032
  22. Table 22: Canada Mobile Mapping Market Volume (K Units) Forecast, by Application 2019 & 2032
  23. Table 23: Global Mobile Mapping Market Revenue Billion Forecast, by Component 2019 & 2032
  24. Table 24: Global Mobile Mapping Market Volume K Units Forecast, by Component 2019 & 2032
  25. Table 25: Global Mobile Mapping Market Revenue Billion Forecast, by Application 2019 & 2032
  26. Table 26: Global Mobile Mapping Market Volume K Units Forecast, by Application 2019 & 2032
  27. Table 27: Global Mobile Mapping Market Revenue Billion Forecast, by End-use 2019 & 2032
  28. Table 28: Global Mobile Mapping Market Volume K Units Forecast, by End-use 2019 & 2032
  29. Table 29: Global Mobile Mapping Market Revenue Billion Forecast, by Country 2019 & 2032
  30. Table 30: Global Mobile Mapping Market Volume K Units Forecast, by Country 2019 & 2032
  31. Table 31: UK Mobile Mapping Market Revenue (Billion) Forecast, by Application 2019 & 2032
  32. Table 32: UK Mobile Mapping Market Volume (K Units) Forecast, by Application 2019 & 2032
  33. Table 33: Germany Mobile Mapping Market Revenue (Billion) Forecast, by Application 2019 & 2032
  34. Table 34: Germany Mobile Mapping Market Volume (K Units) Forecast, by Application 2019 & 2032
  35. Table 35: France Mobile Mapping Market Revenue (Billion) Forecast, by Application 2019 & 2032
  36. Table 36: France Mobile Mapping Market Volume (K Units) Forecast, by Application 2019 & 2032
  37. Table 37: Italy Mobile Mapping Market Revenue (Billion) Forecast, by Application 2019 & 2032
  38. Table 38: Italy Mobile Mapping Market Volume (K Units) Forecast, by Application 2019 & 2032
  39. Table 39: Spain Mobile Mapping Market Revenue (Billion) Forecast, by Application 2019 & 2032
  40. Table 40: Spain Mobile Mapping Market Volume (K Units) Forecast, by Application 2019 & 2032
  41. Table 41: Rest of Europe Mobile Mapping Market Revenue (Billion) Forecast, by Application 2019 & 2032
  42. Table 42: Rest of Europe Mobile Mapping Market Volume (K Units) Forecast, by Application 2019 & 2032
  43. Table 43: Global Mobile Mapping Market Revenue Billion Forecast, by Component 2019 & 2032
  44. Table 44: Global Mobile Mapping Market Volume K Units Forecast, by Component 2019 & 2032
  45. Table 45: Global Mobile Mapping Market Revenue Billion Forecast, by Application 2019 & 2032
  46. Table 46: Global Mobile Mapping Market Volume K Units Forecast, by Application 2019 & 2032
  47. Table 47: Global Mobile Mapping Market Revenue Billion Forecast, by End-use 2019 & 2032
  48. Table 48: Global Mobile Mapping Market Volume K Units Forecast, by End-use 2019 & 2032
  49. Table 49: Global Mobile Mapping Market Revenue Billion Forecast, by Country 2019 & 2032
  50. Table 50: Global Mobile Mapping Market Volume K Units Forecast, by Country 2019 & 2032
  51. Table 51: China Mobile Mapping Market Revenue (Billion) Forecast, by Application 2019 & 2032
  52. Table 52: China Mobile Mapping Market Volume (K Units) Forecast, by Application 2019 & 2032
  53. Table 53: Japan Mobile Mapping Market Revenue (Billion) Forecast, by Application 2019 & 2032
  54. Table 54: Japan Mobile Mapping Market Volume (K Units) Forecast, by Application 2019 & 2032
  55. Table 55: India Mobile Mapping Market Revenue (Billion) Forecast, by Application 2019 & 2032
  56. Table 56: India Mobile Mapping Market Volume (K Units) Forecast, by Application 2019 & 2032
  57. Table 57: ANZ Mobile Mapping Market Revenue (Billion) Forecast, by Application 2019 & 2032
  58. Table 58: ANZ Mobile Mapping Market Volume (K Units) Forecast, by Application 2019 & 2032
  59. Table 59: South Korea Mobile Mapping Market Revenue (Billion) Forecast, by Application 2019 & 2032
  60. Table 60: South Korea Mobile Mapping Market Volume (K Units) Forecast, by Application 2019 & 2032
  61. Table 61: Southeast Asia Mobile Mapping Market Revenue (Billion) Forecast, by Application 2019 & 2032
  62. Table 62: Southeast Asia Mobile Mapping Market Volume (K Units) Forecast, by Application 2019 & 2032
  63. Table 63: RoAPAC Mobile Mapping Market Revenue (Billion) Forecast, by Application 2019 & 2032
  64. Table 64: RoAPAC Mobile Mapping Market Volume (K Units) Forecast, by Application 2019 & 2032
  65. Table 65: Global Mobile Mapping Market Revenue Billion Forecast, by Component 2019 & 2032
  66. Table 66: Global Mobile Mapping Market Volume K Units Forecast, by Component 2019 & 2032
  67. Table 67: Global Mobile Mapping Market Revenue Billion Forecast, by Application 2019 & 2032
  68. Table 68: Global Mobile Mapping Market Volume K Units Forecast, by Application 2019 & 2032
  69. Table 69: Global Mobile Mapping Market Revenue Billion Forecast, by End-use 2019 & 2032
  70. Table 70: Global Mobile Mapping Market Volume K Units Forecast, by End-use 2019 & 2032
  71. Table 71: Global Mobile Mapping Market Revenue Billion Forecast, by Country 2019 & 2032
  72. Table 72: Global Mobile Mapping Market Volume K Units Forecast, by Country 2019 & 2032
  73. Table 73: Brazil Mobile Mapping Market Revenue (Billion) Forecast, by Application 2019 & 2032
  74. Table 74: Brazil Mobile Mapping Market Volume (K Units) Forecast, by Application 2019 & 2032
  75. Table 75: Argentina Mobile Mapping Market Revenue (Billion) Forecast, by Application 2019 & 2032
  76. Table 76: Argentina Mobile Mapping Market Volume (K Units) Forecast, by Application 2019 & 2032
  77. Table 77: Mexico Mobile Mapping Market Revenue (Billion) Forecast, by Application 2019 & 2032
  78. Table 78: Mexico Mobile Mapping Market Volume (K Units) Forecast, by Application 2019 & 2032
  79. Table 79: Rest of Latin America Mobile Mapping Market Revenue (Billion) Forecast, by Application 2019 & 2032
  80. Table 80: Rest of Latin America Mobile Mapping Market Volume (K Units) Forecast, by Application 2019 & 2032
  81. Table 81: Global Mobile Mapping Market Revenue Billion Forecast, by Component 2019 & 2032
  82. Table 82: Global Mobile Mapping Market Volume K Units Forecast, by Component 2019 & 2032
  83. Table 83: Global Mobile Mapping Market Revenue Billion Forecast, by Application 2019 & 2032
  84. Table 84: Global Mobile Mapping Market Volume K Units Forecast, by Application 2019 & 2032
  85. Table 85: Global Mobile Mapping Market Revenue Billion Forecast, by End-use 2019 & 2032
  86. Table 86: Global Mobile Mapping Market Volume K Units Forecast, by End-use 2019 & 2032
  87. Table 87: Global Mobile Mapping Market Revenue Billion Forecast, by Country 2019 & 2032
  88. Table 88: Global Mobile Mapping Market Volume K Units Forecast, by Country 2019 & 2032
  89. Table 89: GCC Mobile Mapping Market Revenue (Billion) Forecast, by Application 2019 & 2032
  90. Table 90: GCC Mobile Mapping Market Volume (K Units) Forecast, by Application 2019 & 2032
  91. Table 91: Israel Mobile Mapping Market Revenue (Billion) Forecast, by Application 2019 & 2032
  92. Table 92: Israel Mobile Mapping Market Volume (K Units) Forecast, by Application 2019 & 2032
  93. Table 93: South Africa Mobile Mapping Market Revenue (Billion) Forecast, by Application 2019 & 2032
  94. Table 94: South Africa Mobile Mapping Market Volume (K Units) Forecast, by Application 2019 & 2032
  95. Table 95: Rest of MEA Mobile Mapping Market Revenue (Billion) Forecast, by Application 2019 & 2032
  96. Table 96: Rest of MEA Mobile Mapping Market Volume (K Units) Forecast, by Application 2019 & 2032


STEP 1 - Identification of Relevant Samples Size from Population Database

Step Chart
bar chart
method chart

STEP 2 - Approaches for Defining Global Market Size (Value, Volume* & Price*)

approach chart
Top-down and bottom-up approaches are used to validate the global market size and estimate the market size for manufactures, regional segemnts, product and application.

Note* : In applicable scenarios

STEP 3 - Data Sources

Primary Research

  • Web Analytics
  • Survey Reports
  • Research Institute
  • Latest Research Reports
  • Opinion Leaders

Secondary Research

  • Annual Reports
  • White Paper
  • Latest Press Release
  • Industry Association
  • Paid Database
  • Investor Presentations
approach chart

STEP 4 - Data Triangulation

Involves using different sources of information in order to increase the validity of a study

These sources are likely to be stakeholders in a program - participants, other researchers, program staff, other community members, and so on.

Then we put all data in single framework & apply various statistical tools to find out the dynamic on the market.

During the analysis stage, feedback from the stakeholder groups would be compared to determine areas of agreement as well as areas of divergence

Additionally after gathering mix and scattered data from wide range of sources, data is triangull- ated and correlated to come up with estimated figures which are further validated through primary mediums, or industry experts, opinion leader.

Frequently Asked Questions

1. What is the projected Compound Annual Growth Rate (CAGR) of the Mobile Mapping Market?

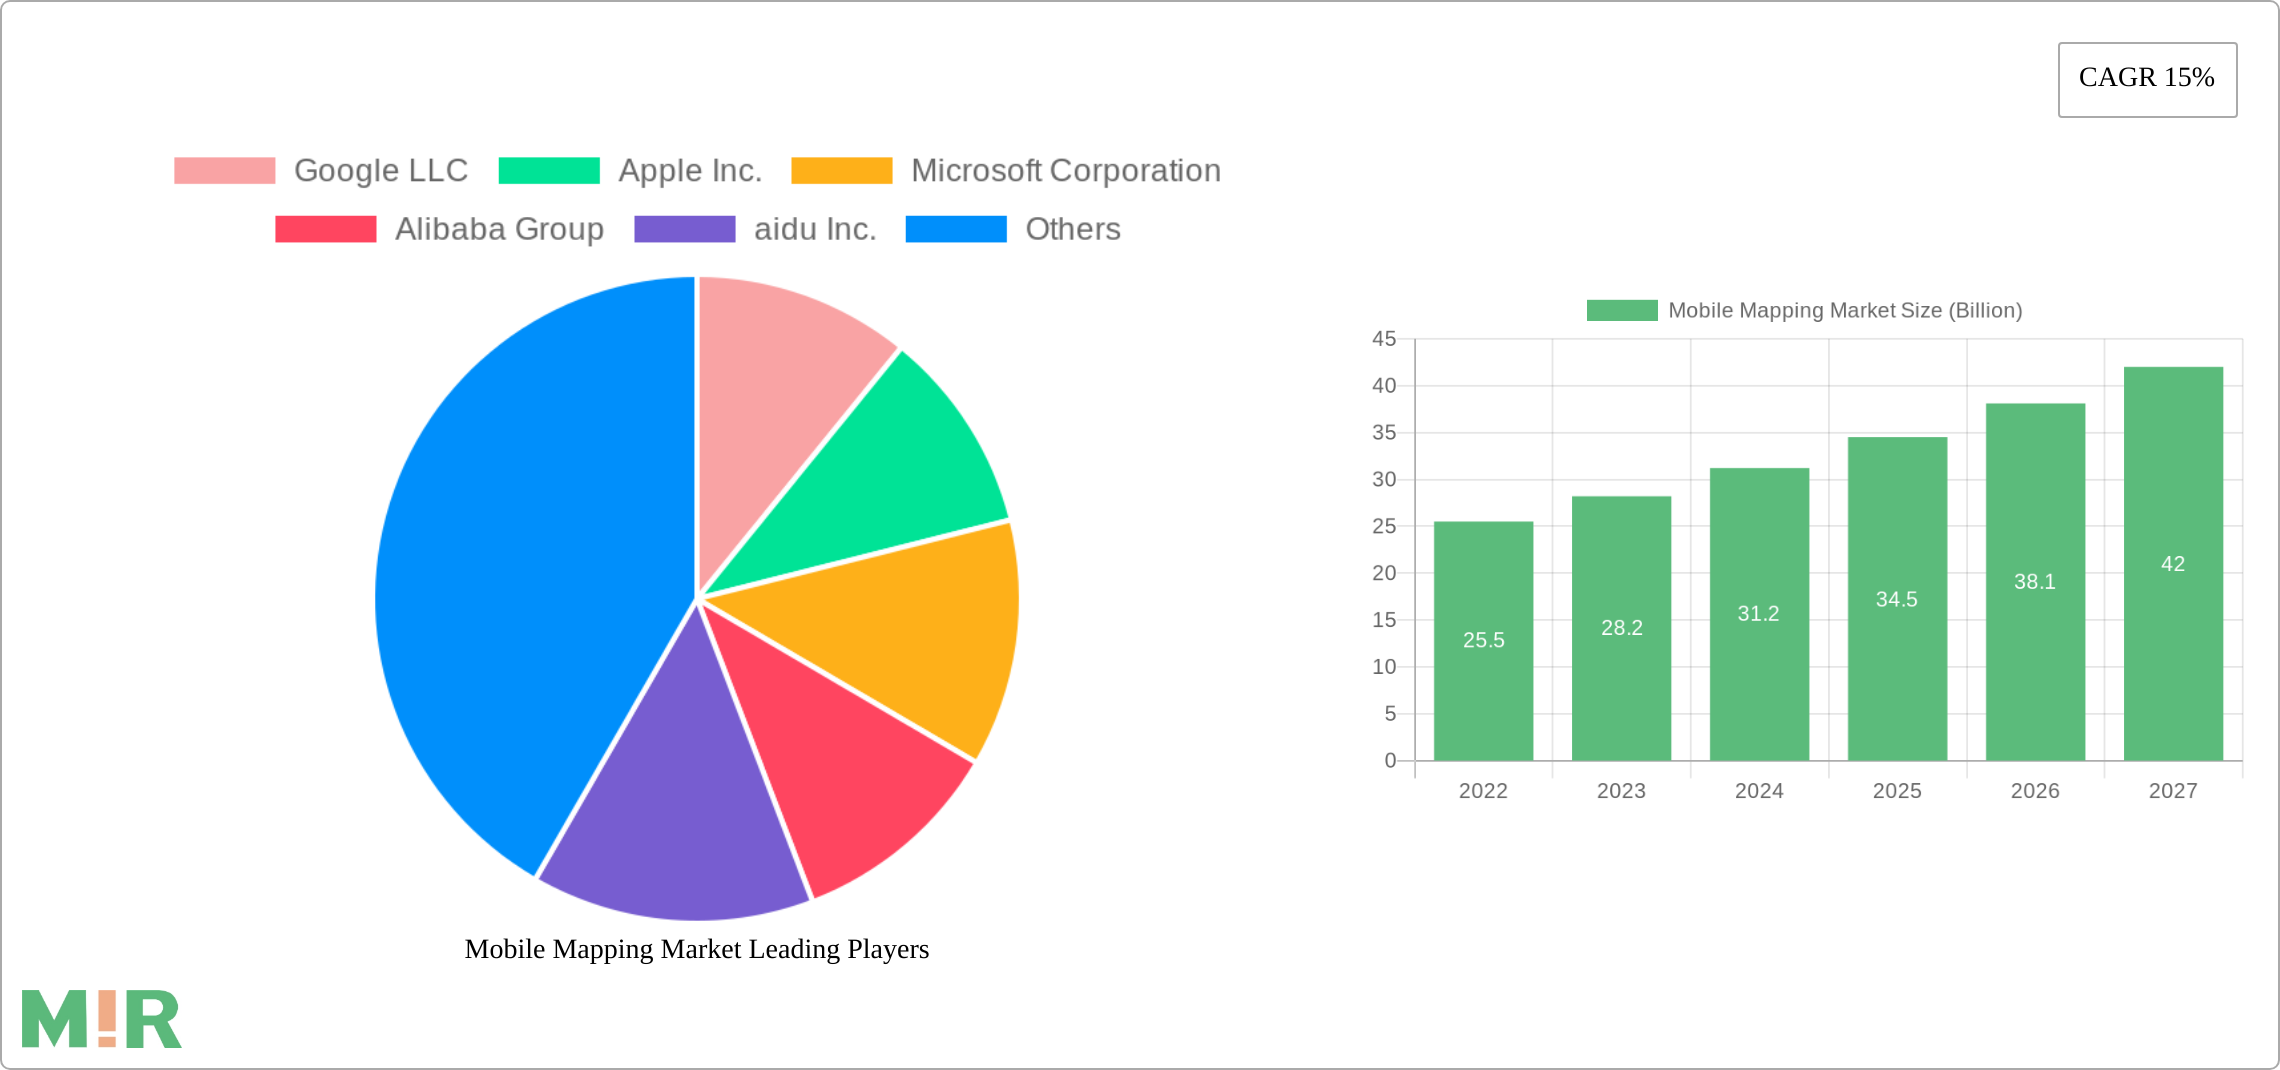
The projected CAGR is approximately 15%.

2. Which companies are prominent players in the Mobile Mapping Market?

Key companies in the market include Google LLC, Apple Inc., Microsoft Corporation, Alibaba Group, aidu Inc..

3. What are the main segments of the Mobile Mapping Market?

The market segments include Component, Application, End-use.

4. Can you provide details about the market size?

The market size is estimated to be USD 20 Billion as of 2022.

5. What are some drivers contributing to market growth?

Rising demand for terrestrial mobile mapping in telecommunication and transportation. Increasing penetration of mobile devices. Increasing investment in city planning and smart city projects. Improved network connectivity. Growing role of optic fiber technology in driving smart cities.

6. What are the notable trends driving market growth?

N/A

7. Are there any restraints impacting market growth?

Concerns regarding data accuracy. High initial investment.

8. Can you provide examples of recent developments in the market?

N/A

9. What pricing options are available for accessing the report?

Pricing options include single-user, multi-user, and enterprise licenses priced at USD 4,850, USD 5,350, and USD 8,350 respectively.

10. Is the market size provided in terms of value or volume?

The market size is provided in terms of value, measured in Billion and volume, measured in K Units.

11. Are there any specific market keywords associated with the report?

Yes, the market keyword associated with the report is "Mobile Mapping Market," which aids in identifying and referencing the specific market segment covered.

12. How do I determine which pricing option suits my needs best?

The pricing options vary based on user requirements and access needs. Individual users may opt for single-user licenses, while businesses requiring broader access may choose multi-user or enterprise licenses for cost-effective access to the report.

13. Are there any additional resources or data provided in the Mobile Mapping Market report?

While the report offers comprehensive insights, it's advisable to review the specific contents or supplementary materials provided to ascertain if additional resources or data are available.

14. How can I stay updated on further developments or reports in the Mobile Mapping Market?

To stay informed about further developments, trends, and reports in the Mobile Mapping Market, consider subscribing to industry newsletters, following relevant companies and organizations, or regularly checking reputable industry news sources and publications.

Related Reports

See the similar reports

Discover the Latest Market Insight Reports

Access in-depth insights on industries, companies, trends, and global markets. Our expertly curated reports provide the most relevant data and analysis in a condensed, easy-to-read format.

shop image 1

About Market Insights Report

Market Insights Reports offers comprehensive market research reports and analysis, giving businesses important information about their clients, rivals, and sector to help them make well-informed decisions on operations, marketing, and business strategy. We offer a variety of services in addition to market research, data analysis, and strategy planning. In order to find opportunities and learn more about our competitors and the industry at large, we employ competitive analysis. To identify areas for development, we also evaluate our performance against that of our rivals. We can determine the places at which we can offer our clients the most value by performing value chain analysis.

Additionally, clients receive a thorough overview of their industry business environment. We can find trends that help us forecast future possibilities and threats by examining global macroeconomic dynamics and consumer behavior patterns. By analyzing their features and advantages, contrasting them with comparable items on the market, and evaluating both their quantitative and qualitative performance, we comprehensively evaluate our clients' products. This allows us to assist customers in determining how their goods compare to those of their rivals and in creating successful marketing plans. Our group has been successful in gaining a thorough grasp of our clients' requirements and offering them creative solutions. We currently provide services to more than 50 nations in Europe, the Middle East, Africa, Latin America, Asia Pacific, and North America. Because of our global reach, we have been able to establish trusting bonds with our partners and clients in various nations, improving customer service and forging a more cohesive worldwide presence.

We use cookies to enhance your experience.

By clicking "Accept All", you consent to the use of all cookies.

Customize your preferences or read our Cookie Policy.