
.jpg&w=3840&q=100)
Market
Insights
Reports delivered globally, covering a wide range of industries and sectors.
Clients who trust our expertise and rely on our insights for business decisions.
Managed Reports, ensuring seamless updates and premium service.
Satisfied Customers, committed to delivering exceptional value and quality.
Nanomedicine Market 2025 to Grow at 11 CAGR with 210.3 Million Market Size: Analysis and Forecasts 2033
Nanomedicine Market by Modality (Treatment, Diagnostics), by Application (Drug delivery, In vitro diagnostics, Implants, Vaccines, In vivo imaging, Other applications), by Indication (Oncology, Infectious diseases, Cardiovascular diseases, Orthopedic diseases, Neurological diseases, Other indications), by Molecule Type (Nanoparticles, Metal & metal oxide nanoparticles, Liposomes, Polymers & polymer drug conjugates, Hydrogel nanoparticles, Dendrimers, Inorganic nanoparticles), by North America (U.S., Canada), by Europe (Germany, UK, France, Spain, Italy, Switzerland, Rest of Europe), by Asia Pacific (China, Japan, India, Australia, South Korea, Rest of Asia Pacific), by Latin America (Brazil, Mexico, Rest of Latin America), by Middle East & Africa (South Africa, Saudi Arabia, Rest of Middle East & Africa) Forecast 2025-2033
Nanomedicine Market 2025 to Grow at 11 CAGR with 210.3 Million Market Size: Analysis and Forecasts 2033
Key insights
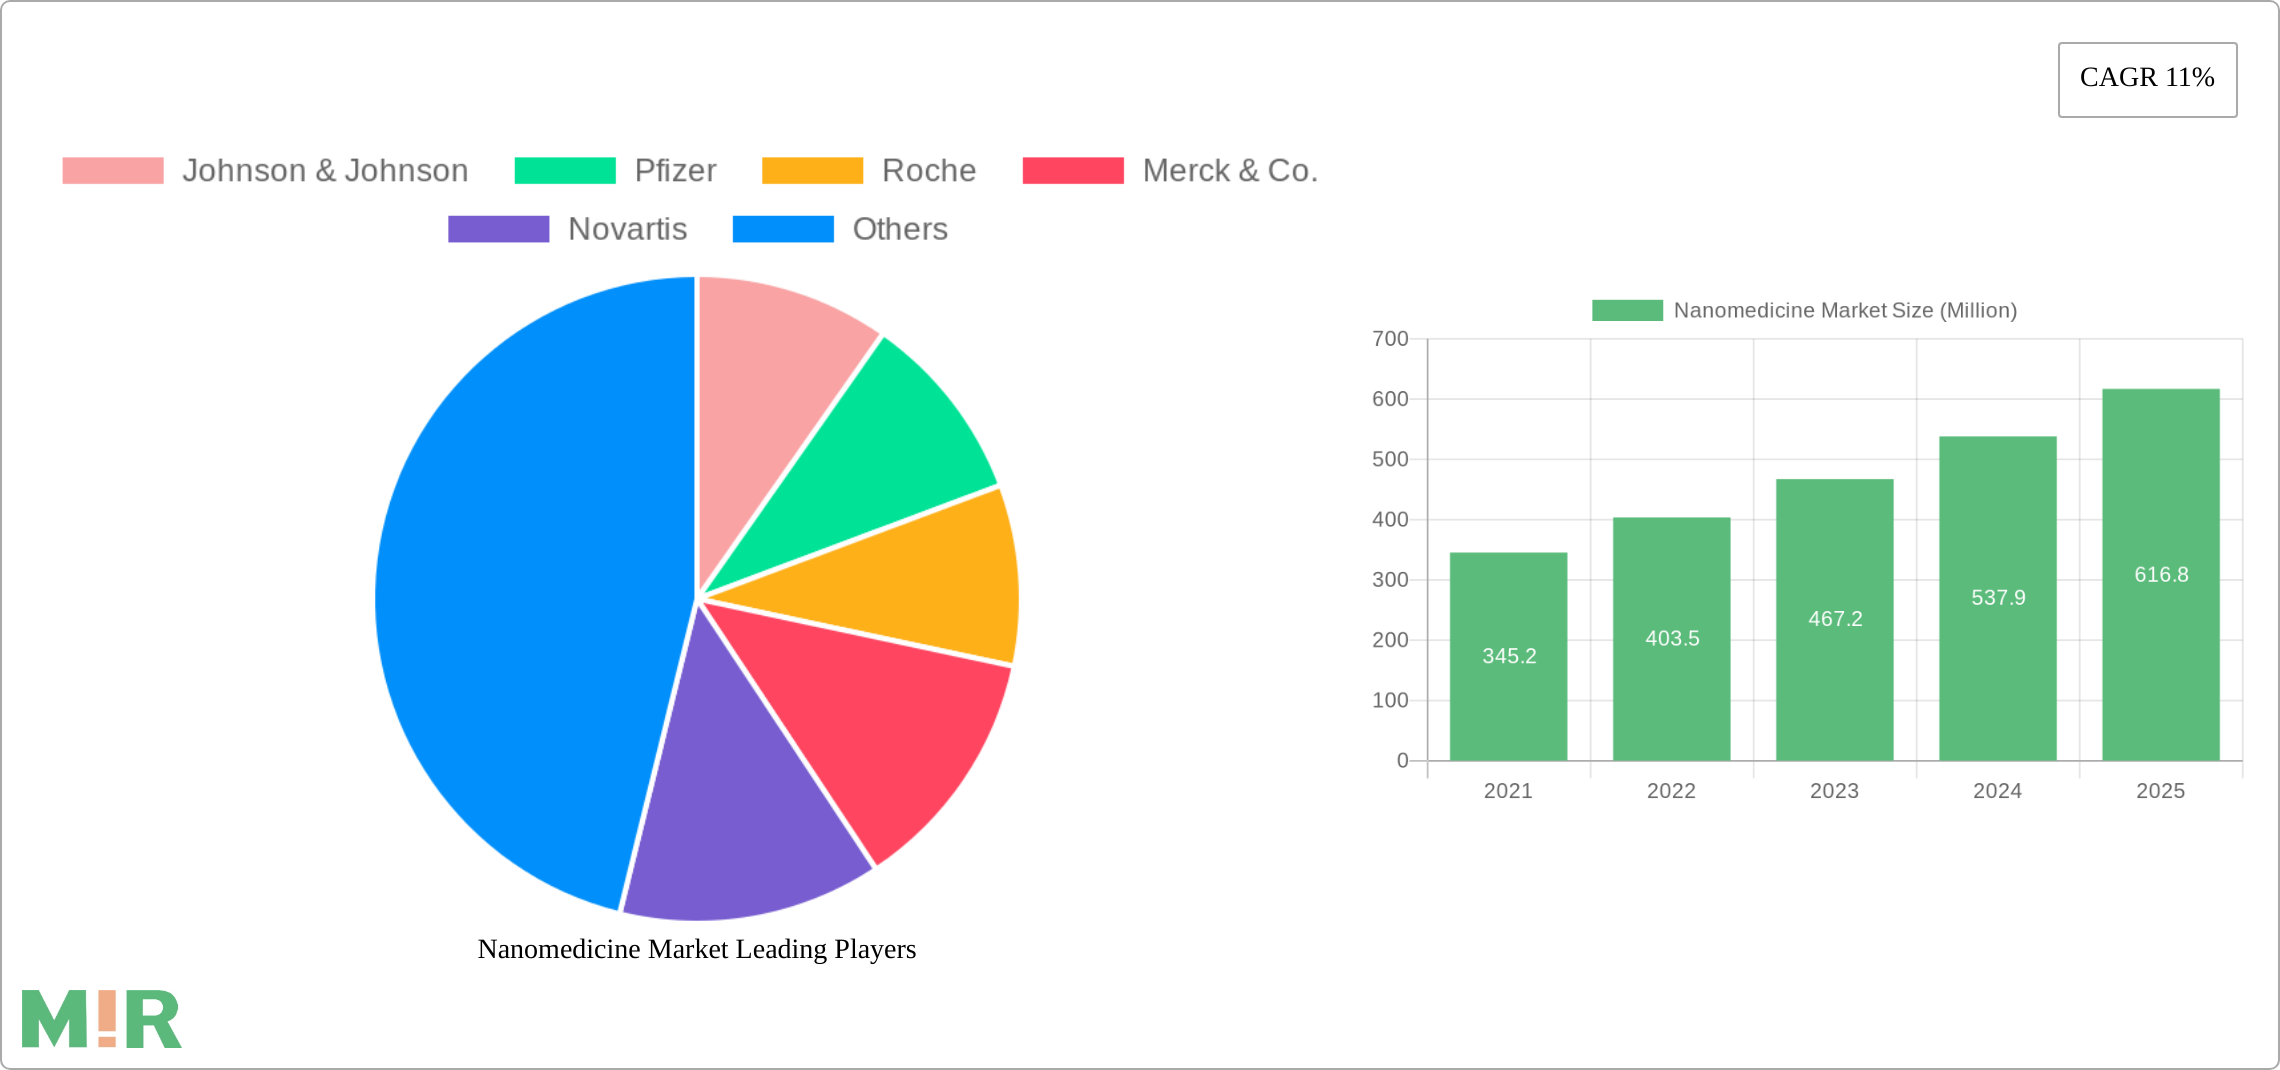
The size of the Nanomedicine Market was valued at USD 210.3 Million in 2024 and is projected to reach USD 436.62 Million by 2033, with an expected CAGR of 11% during the forecast period. Nanomedicine refers to the application of nanotechnology in the field of medicine, where nanoscale materials, devices, or systems are used to diagnose, treat, and monitor diseases at the molecular level. It involves manipulating matter at the scale of nanometers (one billionth of a meter), typically ranging from 1 to 100 nanometers. This scale allows for the development of highly precise and efficient medical tools, as the properties of materials can significantly change when reduced to such small sizes. One of the key features of nanomedicine is its ability to target specific cells, tissues, or organs, improving the delivery of drugs or therapeutic agents directly to diseased sites, thereby enhancing the treatment’s effectiveness and reducing side effects. Nanoparticles, such as liposomes, dendrimers, and carbon nanotubes, are commonly used to encapsulate drugs or genes, offering controlled release and better bioavailability. For instance, in cancer treatment, nanomedicine can deliver chemotherapy drugs directly to tumor cells, reducing the impact on healthy cells and minimizing systemic toxicity. Moreover, diagnostic tools in nanomedicine, such as nanoparticles for imaging or biosensors, can offer highly sensitive and early detection of diseases, enabling more timely and personalized interventions. Nanomedicine also plays a role in regenerative medicine, where nanoparticles are used to promote tissue repair or to deliver stem cells to damaged areas. However, despite its promising potential, nanomedicine faces challenges, including the complexity of regulatory approval processes, potential toxicity of nanomaterials, and the need for large-scale production and distribution. Ongoing research is focused on overcoming these obstacles and ensuring the safety and efficacy of nanomedicine for clinical applications. The ultimate goal is to revolutionize healthcare by offering more precise, effective, and less invasive treatments for a wide range of diseases.
Nanomedicine Market Concentration & Characteristics
The market is highly concentrated with a few dominant players accounting for a substantial market share. Major companies include Johnson & Johnson, Pfizer, Roche, and Merck & Co.
Nanomedicine Market Trends
Key market insights include:
- Advancements in nanotechnology and materials science have led to the development of novel applications for nanomedicine.
- Increased government funding for nanomedicine research and development is driving innovation.
- Growing awareness about the benefits of nanomedicine in healthcare is fueling market growth.

Key Region or Country & Segment to Dominate the Market
The North American region is expected to dominate the market due to robust healthcare infrastructure, high prevalence of chronic diseases, and government support for nanomedicine research. Among segments, the treatment modality is projected to witness the highest growth, driven by the demand for targeted drug delivery systems.
Nanomedicine Market Product Insights Report Coverage & Deliverables
The report provides comprehensive insights into market size, share, and growth trends. It includes detailed analysis of various segments, such as modality, application, indication, and molecule type.
Nanomedicine Market Analysis
The market analysis covers historical and current market size, market share, and growth projections. It provides granular insights into market dynamics, enabling stakeholders to make informed decisions.
Nanomedicine Market Regional Insights
- North America:
- United States
- Canada
- Europe:
- Germany
- United Kingdom
- France
- Spain
- Italy
- Asia Pacific:
- China
- Japan
- India
- Australia
- South Korea
- Latin America:
- Brazil
- Mexico
- Middle East & Africa:
- South Africa
- Saudi Arabia
Driving Forces: What's Propelling the Nanomedicine Market
- Growing demand for personalized medicine
- Advancements in drug delivery systems
- Rising prevalence of chronic diseases
- Government funding for research and development
Challenges and Restraints in Nanomedicine Market
- High cost of nanomedicine products
- Regulatory hurdles and safety concerns
- Limited infrastructure in developing countries
Emerging Trends in Nanomedicine Market
- Precision medicine
- Nanobots and nanorobots
- Theranostics
- Artificial intelligence in nanomedicine
Leading Players in the Nanomedicine Market
- Johnson & Johnson
- Pfizer
- Roche
- Merck & Co.
- Novartis
- AstraZeneca
- Baxter International
- Siemens Healthineers
- BD (Becton, Dickinson and Company)
- Abbott Laboratories
Nanomedicine Market Segmentation
- 1. Modality
- 1.1. Treatment
- 1.2. Diagnostics
- 2. Application
- 2.1. Drug delivery
- 2.2. In vitro diagnostics
- 2.3. Implants
- 2.4. Vaccines
- 2.5. In vivo imaging
- 2.6. Other applications
- 3. Indication
- 3.1. Oncology
- 3.2. Infectious diseases
- 3.3. Cardiovascular diseases
- 3.4. Orthopedic diseases
- 3.5. Neurological diseases
- 3.6. Other indications
- 4. Molecule Type
- 4.1. Nanoparticles
- 4.2. Metal & metal oxide nanoparticles
- 4.3. Liposomes
- 4.4. Polymers & polymer drug conjugates
- 4.5. Hydrogel nanoparticles
- 4.6. Dendrimers
- 4.7. Inorganic nanoparticles
Nanomedicine Market Segmentation By Geography
- 1. North America
- 1.1. U.S.
- 1.2. Canada
- 2. Europe
- 2.1. Germany
- 2.2. UK
- 2.3. France
- 2.4. Spain
- 2.5. Italy
- 2.6. Switzerland
- 2.7. Rest of Europe
- 3. Asia Pacific
- 3.1. China
- 3.2. Japan
- 3.3. India
- 3.4. Australia
- 3.5. South Korea
- 3.6. Rest of Asia Pacific
- 4. Latin America
- 4.1. Brazil
- 4.2. Mexico
- 4.3. Rest of Latin America
- 5. Middle East & Africa
- 5.1. South Africa
- 5.2. Saudi Arabia
- 5.3. Rest of Middle East & Africa

Nanomedicine Market REPORT HIGHLIGHTS
| Aspects | Details |
|---|---|
| Study Period | 2019-2033 |
| Base Year | 2024 |
| Estimated Year | 2025 |
| Forecast Period | 2025-2033 |
| Historical Period | 2019-2024 |
| Growth Rate | CAGR of 11% from 2019-2033 |
| Segmentation |
|
- 1. Introduction
- 1.1. Research Scope
- 1.2. Market Segmentation
- 1.3. Research Methodology
- 1.4. Definitions and Assumptions
- 2. Executive Summary
- 2.1. Introduction
- 3. Market Dynamics
- 3.1. Introduction
- 3.2. Market Drivers
- 3.2.1 Growing adoption of nanotechnology-based methods for drug delivery
- 3.2.2 Increasing prevalence of infectious diseases
- 3.2.3 Technological advancements in nanotechnology
- 3.2.4 Increasing aging population
- 3.3. Market Restrains
- 3.3.1 High development costs
- 3.3.2 Manufacturing complexities
- 3.4. Market Trends
- 4. Market Factor Analysis
- 4.1. Porters Five Forces
- 4.2. Supply/Value Chain
- 4.3. PESTEL analysis
- 4.4. Market Entropy
- 4.5. Patent/Trademark Analysis
- 5. Global Nanomedicine Market Analysis, Insights and Forecast, 2019-2031
- 5.1. Market Analysis, Insights and Forecast - by Modality
- 5.1.1. Treatment
- 5.1.2. Diagnostics
- 5.2. Market Analysis, Insights and Forecast - by Application
- 5.2.1. Drug delivery
- 5.2.2. In vitro diagnostics
- 5.2.3. Implants
- 5.2.4. Vaccines
- 5.2.5. In vivo imaging
- 5.2.6. Other applications
- 5.3. Market Analysis, Insights and Forecast - by Indication
- 5.3.1. Oncology
- 5.3.2. Infectious diseases
- 5.3.3. Cardiovascular diseases
- 5.3.4. Orthopedic diseases
- 5.3.5. Neurological diseases
- 5.3.6. Other indications
- 5.4. Market Analysis, Insights and Forecast - by Molecule Type
- 5.4.1. Nanoparticles
- 5.4.2. Metal & metal oxide nanoparticles
- 5.4.3. Liposomes
- 5.4.4. Polymers & polymer drug conjugates
- 5.4.5. Hydrogel nanoparticles
- 5.4.6. Dendrimers
- 5.4.7. Inorganic nanoparticles
- 5.5. Market Analysis, Insights and Forecast - by Region
- 5.5.1. North America
- 5.5.2. Europe
- 5.5.3. Asia Pacific
- 5.5.4. Latin America
- 5.5.5. Middle East & Africa
- 5.1. Market Analysis, Insights and Forecast - by Modality
- 6. North America Nanomedicine Market Analysis, Insights and Forecast, 2019-2031
- 6.1. Market Analysis, Insights and Forecast - by Modality
- 6.1.1. Treatment
- 6.1.2. Diagnostics
- 6.2. Market Analysis, Insights and Forecast - by Application
- 6.2.1. Drug delivery
- 6.2.2. In vitro diagnostics
- 6.2.3. Implants
- 6.2.4. Vaccines
- 6.2.5. In vivo imaging
- 6.2.6. Other applications
- 6.3. Market Analysis, Insights and Forecast - by Indication
- 6.3.1. Oncology
- 6.3.2. Infectious diseases
- 6.3.3. Cardiovascular diseases
- 6.3.4. Orthopedic diseases
- 6.3.5. Neurological diseases
- 6.3.6. Other indications
- 6.4. Market Analysis, Insights and Forecast - by Molecule Type
- 6.4.1. Nanoparticles
- 6.4.2. Metal & metal oxide nanoparticles
- 6.4.3. Liposomes
- 6.4.4. Polymers & polymer drug conjugates
- 6.4.5. Hydrogel nanoparticles
- 6.4.6. Dendrimers
- 6.4.7. Inorganic nanoparticles
- 6.1. Market Analysis, Insights and Forecast - by Modality
- 7. Europe Nanomedicine Market Analysis, Insights and Forecast, 2019-2031
- 7.1. Market Analysis, Insights and Forecast - by Modality
- 7.1.1. Treatment
- 7.1.2. Diagnostics
- 7.2. Market Analysis, Insights and Forecast - by Application
- 7.2.1. Drug delivery
- 7.2.2. In vitro diagnostics
- 7.2.3. Implants
- 7.2.4. Vaccines
- 7.2.5. In vivo imaging
- 7.2.6. Other applications
- 7.3. Market Analysis, Insights and Forecast - by Indication
- 7.3.1. Oncology
- 7.3.2. Infectious diseases
- 7.3.3. Cardiovascular diseases
- 7.3.4. Orthopedic diseases
- 7.3.5. Neurological diseases
- 7.3.6. Other indications
- 7.4. Market Analysis, Insights and Forecast - by Molecule Type
- 7.4.1. Nanoparticles
- 7.4.2. Metal & metal oxide nanoparticles
- 7.4.3. Liposomes
- 7.4.4. Polymers & polymer drug conjugates
- 7.4.5. Hydrogel nanoparticles
- 7.4.6. Dendrimers
- 7.4.7. Inorganic nanoparticles
- 7.1. Market Analysis, Insights and Forecast - by Modality
- 8. Asia Pacific Nanomedicine Market Analysis, Insights and Forecast, 2019-2031
- 8.1. Market Analysis, Insights and Forecast - by Modality
- 8.1.1. Treatment
- 8.1.2. Diagnostics
- 8.2. Market Analysis, Insights and Forecast - by Application
- 8.2.1. Drug delivery
- 8.2.2. In vitro diagnostics
- 8.2.3. Implants
- 8.2.4. Vaccines
- 8.2.5. In vivo imaging
- 8.2.6. Other applications
- 8.3. Market Analysis, Insights and Forecast - by Indication
- 8.3.1. Oncology
- 8.3.2. Infectious diseases
- 8.3.3. Cardiovascular diseases
- 8.3.4. Orthopedic diseases
- 8.3.5. Neurological diseases
- 8.3.6. Other indications
- 8.4. Market Analysis, Insights and Forecast - by Molecule Type
- 8.4.1. Nanoparticles
- 8.4.2. Metal & metal oxide nanoparticles
- 8.4.3. Liposomes
- 8.4.4. Polymers & polymer drug conjugates
- 8.4.5. Hydrogel nanoparticles
- 8.4.6. Dendrimers
- 8.4.7. Inorganic nanoparticles
- 8.1. Market Analysis, Insights and Forecast - by Modality
- 9. Latin America Nanomedicine Market Analysis, Insights and Forecast, 2019-2031
- 9.1. Market Analysis, Insights and Forecast - by Modality
- 9.1.1. Treatment
- 9.1.2. Diagnostics
- 9.2. Market Analysis, Insights and Forecast - by Application
- 9.2.1. Drug delivery
- 9.2.2. In vitro diagnostics
- 9.2.3. Implants
- 9.2.4. Vaccines
- 9.2.5. In vivo imaging
- 9.2.6. Other applications
- 9.3. Market Analysis, Insights and Forecast - by Indication
- 9.3.1. Oncology
- 9.3.2. Infectious diseases
- 9.3.3. Cardiovascular diseases
- 9.3.4. Orthopedic diseases
- 9.3.5. Neurological diseases
- 9.3.6. Other indications
- 9.4. Market Analysis, Insights and Forecast - by Molecule Type
- 9.4.1. Nanoparticles
- 9.4.2. Metal & metal oxide nanoparticles
- 9.4.3. Liposomes
- 9.4.4. Polymers & polymer drug conjugates
- 9.4.5. Hydrogel nanoparticles
- 9.4.6. Dendrimers
- 9.4.7. Inorganic nanoparticles
- 9.1. Market Analysis, Insights and Forecast - by Modality
- 10. Middle East & Africa Nanomedicine Market Analysis, Insights and Forecast, 2019-2031
- 10.1. Market Analysis, Insights and Forecast - by Modality
- 10.1.1. Treatment
- 10.1.2. Diagnostics
- 10.2. Market Analysis, Insights and Forecast - by Application
- 10.2.1. Drug delivery
- 10.2.2. In vitro diagnostics
- 10.2.3. Implants
- 10.2.4. Vaccines
- 10.2.5. In vivo imaging
- 10.2.6. Other applications
- 10.3. Market Analysis, Insights and Forecast - by Indication
- 10.3.1. Oncology
- 10.3.2. Infectious diseases
- 10.3.3. Cardiovascular diseases
- 10.3.4. Orthopedic diseases
- 10.3.5. Neurological diseases
- 10.3.6. Other indications
- 10.4. Market Analysis, Insights and Forecast - by Molecule Type
- 10.4.1. Nanoparticles
- 10.4.2. Metal & metal oxide nanoparticles
- 10.4.3. Liposomes
- 10.4.4. Polymers & polymer drug conjugates
- 10.4.5. Hydrogel nanoparticles
- 10.4.6. Dendrimers
- 10.4.7. Inorganic nanoparticles
- 10.1. Market Analysis, Insights and Forecast - by Modality
- 11. Competitive Analysis
- 11.1. Global Market Share Analysis 2024
- 11.2. Company Profiles
- 11.2.1 Johnson & Johnson
- 11.2.1.1. Overview
- 11.2.1.2. Products
- 11.2.1.3. SWOT Analysis
- 11.2.1.4. Recent Developments
- 11.2.1.5. Financials (Based on Availability)
- 11.2.2 Pfizer
- 11.2.2.1. Overview
- 11.2.2.2. Products
- 11.2.2.3. SWOT Analysis
- 11.2.2.4. Recent Developments
- 11.2.2.5. Financials (Based on Availability)
- 11.2.3 Roche
- 11.2.3.1. Overview
- 11.2.3.2. Products
- 11.2.3.3. SWOT Analysis
- 11.2.3.4. Recent Developments
- 11.2.3.5. Financials (Based on Availability)
- 11.2.4 Merck & Co.
- 11.2.4.1. Overview
- 11.2.4.2. Products
- 11.2.4.3. SWOT Analysis
- 11.2.4.4. Recent Developments
- 11.2.4.5. Financials (Based on Availability)
- 11.2.5 Novartis
- 11.2.5.1. Overview
- 11.2.5.2. Products
- 11.2.5.3. SWOT Analysis
- 11.2.5.4. Recent Developments
- 11.2.5.5. Financials (Based on Availability)
- 11.2.6 AstraZeneca
- 11.2.6.1. Overview
- 11.2.6.2. Products
- 11.2.6.3. SWOT Analysis
- 11.2.6.4. Recent Developments
- 11.2.6.5. Financials (Based on Availability)
- 11.2.7 Baxter International
- 11.2.7.1. Overview
- 11.2.7.2. Products
- 11.2.7.3. SWOT Analysis
- 11.2.7.4. Recent Developments
- 11.2.7.5. Financials (Based on Availability)
- 11.2.8 Siemens Healthineers
- 11.2.8.1. Overview
- 11.2.8.2. Products
- 11.2.8.3. SWOT Analysis
- 11.2.8.4. Recent Developments
- 11.2.8.5. Financials (Based on Availability)
- 11.2.9 BD (Becton Dickinson and Company)
- 11.2.9.1. Overview
- 11.2.9.2. Products
- 11.2.9.3. SWOT Analysis
- 11.2.9.4. Recent Developments
- 11.2.9.5. Financials (Based on Availability)
- 11.2.10 Abbott Laboratories
- 11.2.10.1. Overview
- 11.2.10.2. Products
- 11.2.10.3. SWOT Analysis
- 11.2.10.4. Recent Developments
- 11.2.10.5. Financials (Based on Availability)
- 11.2.1 Johnson & Johnson
- Figure 1: Global Nanomedicine Market Revenue Breakdown (Million, %) by Region 2024 & 2032
- Figure 2: North America Nanomedicine Market Revenue (Million), by Modality 2024 & 2032
- Figure 3: North America Nanomedicine Market Revenue Share (%), by Modality 2024 & 2032
- Figure 4: North America Nanomedicine Market Revenue (Million), by Application 2024 & 2032
- Figure 5: North America Nanomedicine Market Revenue Share (%), by Application 2024 & 2032
- Figure 6: North America Nanomedicine Market Revenue (Million), by Indication 2024 & 2032
- Figure 7: North America Nanomedicine Market Revenue Share (%), by Indication 2024 & 2032
- Figure 8: North America Nanomedicine Market Revenue (Million), by Molecule Type 2024 & 2032
- Figure 9: North America Nanomedicine Market Revenue Share (%), by Molecule Type 2024 & 2032
- Figure 10: North America Nanomedicine Market Revenue (Million), by Country 2024 & 2032
- Figure 11: North America Nanomedicine Market Revenue Share (%), by Country 2024 & 2032
- Figure 12: Europe Nanomedicine Market Revenue (Million), by Modality 2024 & 2032
- Figure 13: Europe Nanomedicine Market Revenue Share (%), by Modality 2024 & 2032
- Figure 14: Europe Nanomedicine Market Revenue (Million), by Application 2024 & 2032
- Figure 15: Europe Nanomedicine Market Revenue Share (%), by Application 2024 & 2032
- Figure 16: Europe Nanomedicine Market Revenue (Million), by Indication 2024 & 2032
- Figure 17: Europe Nanomedicine Market Revenue Share (%), by Indication 2024 & 2032
- Figure 18: Europe Nanomedicine Market Revenue (Million), by Molecule Type 2024 & 2032
- Figure 19: Europe Nanomedicine Market Revenue Share (%), by Molecule Type 2024 & 2032
- Figure 20: Europe Nanomedicine Market Revenue (Million), by Country 2024 & 2032
- Figure 21: Europe Nanomedicine Market Revenue Share (%), by Country 2024 & 2032
- Figure 22: Asia Pacific Nanomedicine Market Revenue (Million), by Modality 2024 & 2032
- Figure 23: Asia Pacific Nanomedicine Market Revenue Share (%), by Modality 2024 & 2032
- Figure 24: Asia Pacific Nanomedicine Market Revenue (Million), by Application 2024 & 2032
- Figure 25: Asia Pacific Nanomedicine Market Revenue Share (%), by Application 2024 & 2032
- Figure 26: Asia Pacific Nanomedicine Market Revenue (Million), by Indication 2024 & 2032
- Figure 27: Asia Pacific Nanomedicine Market Revenue Share (%), by Indication 2024 & 2032
- Figure 28: Asia Pacific Nanomedicine Market Revenue (Million), by Molecule Type 2024 & 2032
- Figure 29: Asia Pacific Nanomedicine Market Revenue Share (%), by Molecule Type 2024 & 2032
- Figure 30: Asia Pacific Nanomedicine Market Revenue (Million), by Country 2024 & 2032
- Figure 31: Asia Pacific Nanomedicine Market Revenue Share (%), by Country 2024 & 2032
- Figure 32: Latin America Nanomedicine Market Revenue (Million), by Modality 2024 & 2032
- Figure 33: Latin America Nanomedicine Market Revenue Share (%), by Modality 2024 & 2032
- Figure 34: Latin America Nanomedicine Market Revenue (Million), by Application 2024 & 2032
- Figure 35: Latin America Nanomedicine Market Revenue Share (%), by Application 2024 & 2032
- Figure 36: Latin America Nanomedicine Market Revenue (Million), by Indication 2024 & 2032
- Figure 37: Latin America Nanomedicine Market Revenue Share (%), by Indication 2024 & 2032
- Figure 38: Latin America Nanomedicine Market Revenue (Million), by Molecule Type 2024 & 2032
- Figure 39: Latin America Nanomedicine Market Revenue Share (%), by Molecule Type 2024 & 2032
- Figure 40: Latin America Nanomedicine Market Revenue (Million), by Country 2024 & 2032
- Figure 41: Latin America Nanomedicine Market Revenue Share (%), by Country 2024 & 2032
- Figure 42: Middle East & Africa Nanomedicine Market Revenue (Million), by Modality 2024 & 2032
- Figure 43: Middle East & Africa Nanomedicine Market Revenue Share (%), by Modality 2024 & 2032
- Figure 44: Middle East & Africa Nanomedicine Market Revenue (Million), by Application 2024 & 2032
- Figure 45: Middle East & Africa Nanomedicine Market Revenue Share (%), by Application 2024 & 2032
- Figure 46: Middle East & Africa Nanomedicine Market Revenue (Million), by Indication 2024 & 2032
- Figure 47: Middle East & Africa Nanomedicine Market Revenue Share (%), by Indication 2024 & 2032
- Figure 48: Middle East & Africa Nanomedicine Market Revenue (Million), by Molecule Type 2024 & 2032
- Figure 49: Middle East & Africa Nanomedicine Market Revenue Share (%), by Molecule Type 2024 & 2032
- Figure 50: Middle East & Africa Nanomedicine Market Revenue (Million), by Country 2024 & 2032
- Figure 51: Middle East & Africa Nanomedicine Market Revenue Share (%), by Country 2024 & 2032
- Table 1: Global Nanomedicine Market Revenue Million Forecast, by Region 2019 & 2032
- Table 2: Global Nanomedicine Market Revenue Million Forecast, by Modality 2019 & 2032
- Table 3: Global Nanomedicine Market Revenue Million Forecast, by Application 2019 & 2032
- Table 4: Global Nanomedicine Market Revenue Million Forecast, by Indication 2019 & 2032
- Table 5: Global Nanomedicine Market Revenue Million Forecast, by Molecule Type 2019 & 2032
- Table 6: Global Nanomedicine Market Revenue Million Forecast, by Region 2019 & 2032
- Table 7: Global Nanomedicine Market Revenue Million Forecast, by Modality 2019 & 2032
- Table 8: Global Nanomedicine Market Revenue Million Forecast, by Application 2019 & 2032
- Table 9: Global Nanomedicine Market Revenue Million Forecast, by Indication 2019 & 2032
- Table 10: Global Nanomedicine Market Revenue Million Forecast, by Molecule Type 2019 & 2032
- Table 11: Global Nanomedicine Market Revenue Million Forecast, by Country 2019 & 2032
- Table 12: U.S. Nanomedicine Market Revenue (Million) Forecast, by Application 2019 & 2032
- Table 13: Canada Nanomedicine Market Revenue (Million) Forecast, by Application 2019 & 2032
- Table 14: Global Nanomedicine Market Revenue Million Forecast, by Modality 2019 & 2032
- Table 15: Global Nanomedicine Market Revenue Million Forecast, by Application 2019 & 2032
- Table 16: Global Nanomedicine Market Revenue Million Forecast, by Indication 2019 & 2032
- Table 17: Global Nanomedicine Market Revenue Million Forecast, by Molecule Type 2019 & 2032
- Table 18: Global Nanomedicine Market Revenue Million Forecast, by Country 2019 & 2032
- Table 19: Germany Nanomedicine Market Revenue (Million) Forecast, by Application 2019 & 2032
- Table 20: UK Nanomedicine Market Revenue (Million) Forecast, by Application 2019 & 2032
- Table 21: France Nanomedicine Market Revenue (Million) Forecast, by Application 2019 & 2032
- Table 22: Spain Nanomedicine Market Revenue (Million) Forecast, by Application 2019 & 2032
- Table 23: Italy Nanomedicine Market Revenue (Million) Forecast, by Application 2019 & 2032
- Table 24: Switzerland Nanomedicine Market Revenue (Million) Forecast, by Application 2019 & 2032
- Table 25: Rest of Europe Nanomedicine Market Revenue (Million) Forecast, by Application 2019 & 2032
- Table 26: Global Nanomedicine Market Revenue Million Forecast, by Modality 2019 & 2032
- Table 27: Global Nanomedicine Market Revenue Million Forecast, by Application 2019 & 2032
- Table 28: Global Nanomedicine Market Revenue Million Forecast, by Indication 2019 & 2032
- Table 29: Global Nanomedicine Market Revenue Million Forecast, by Molecule Type 2019 & 2032
- Table 30: Global Nanomedicine Market Revenue Million Forecast, by Country 2019 & 2032
- Table 31: China Nanomedicine Market Revenue (Million) Forecast, by Application 2019 & 2032
- Table 32: Japan Nanomedicine Market Revenue (Million) Forecast, by Application 2019 & 2032
- Table 33: India Nanomedicine Market Revenue (Million) Forecast, by Application 2019 & 2032
- Table 34: Australia Nanomedicine Market Revenue (Million) Forecast, by Application 2019 & 2032
- Table 35: South Korea Nanomedicine Market Revenue (Million) Forecast, by Application 2019 & 2032
- Table 36: Rest of Asia Pacific Nanomedicine Market Revenue (Million) Forecast, by Application 2019 & 2032
- Table 37: Global Nanomedicine Market Revenue Million Forecast, by Modality 2019 & 2032
- Table 38: Global Nanomedicine Market Revenue Million Forecast, by Application 2019 & 2032
- Table 39: Global Nanomedicine Market Revenue Million Forecast, by Indication 2019 & 2032
- Table 40: Global Nanomedicine Market Revenue Million Forecast, by Molecule Type 2019 & 2032
- Table 41: Global Nanomedicine Market Revenue Million Forecast, by Country 2019 & 2032
- Table 42: Brazil Nanomedicine Market Revenue (Million) Forecast, by Application 2019 & 2032
- Table 43: Mexico Nanomedicine Market Revenue (Million) Forecast, by Application 2019 & 2032
- Table 44: Rest of Latin America Nanomedicine Market Revenue (Million) Forecast, by Application 2019 & 2032
- Table 45: Global Nanomedicine Market Revenue Million Forecast, by Modality 2019 & 2032
- Table 46: Global Nanomedicine Market Revenue Million Forecast, by Application 2019 & 2032
- Table 47: Global Nanomedicine Market Revenue Million Forecast, by Indication 2019 & 2032
- Table 48: Global Nanomedicine Market Revenue Million Forecast, by Molecule Type 2019 & 2032
- Table 49: Global Nanomedicine Market Revenue Million Forecast, by Country 2019 & 2032
- Table 50: South Africa Nanomedicine Market Revenue (Million) Forecast, by Application 2019 & 2032
- Table 51: Saudi Arabia Nanomedicine Market Revenue (Million) Forecast, by Application 2019 & 2032
- Table 52: Rest of Middle East & Africa Nanomedicine Market Revenue (Million) Forecast, by Application 2019 & 2032
STEP 1 - Identification of Relevant Samples Size from Population Database


STEP 2 - Approaches for Defining Global Market Size (Value, Volume* & Price*)

Note* : In applicable scenarios
STEP 3 - Data Sources
Primary Research
- Web Analytics
- Survey Reports
- Research Institute
- Latest Research Reports
- Opinion Leaders
Secondary Research
- Annual Reports
- White Paper
- Latest Press Release
- Industry Association
- Paid Database
- Investor Presentations

STEP 4 - Data Triangulation
Involves using different sources of information in order to increase the validity of a study
These sources are likely to be stakeholders in a program - participants, other researchers, program staff, other community members, and so on.
Then we put all data in single framework & apply various statistical tools to find out the dynamic on the market.
During the analysis stage, feedback from the stakeholder groups would be compared to determine areas of agreement as well as areas of divergence
Frequently Asked Questions
Related Reports
See the similar reports


About Market Insights Report
Market Insights Reports offers comprehensive market research reports and analysis, giving businesses important information about their clients, rivals, and sector to help them make well-informed decisions on operations, marketing, and business strategy. We offer a variety of services in addition to market research, data analysis, and strategy planning. In order to find opportunities and learn more about our competitors and the industry at large, we employ competitive analysis. To identify areas for development, we also evaluate our performance against that of our rivals. We can determine the places at which we can offer our clients the most value by performing value chain analysis.
Additionally, clients receive a thorough overview of their industry business environment. We can find trends that help us forecast future possibilities and threats by examining global macroeconomic dynamics and consumer behavior patterns. By analyzing their features and advantages, contrasting them with comparable items on the market, and evaluating both their quantitative and qualitative performance, we comprehensively evaluate our clients' products. This allows us to assist customers in determining how their goods compare to those of their rivals and in creating successful marketing plans. Our group has been successful in gaining a thorough grasp of our clients' requirements and offering them creative solutions. We currently provide services to more than 50 nations in Europe, the Middle East, Africa, Latin America, Asia Pacific, and North America. Because of our global reach, we have been able to establish trusting bonds with our partners and clients in various nations, improving customer service and forging a more cohesive worldwide presence.