
.jpg&w=3840&q=100)
Market
Insights
Reports delivered globally, covering a wide range of industries and sectors.
Clients who trust our expertise and rely on our insights for business decisions.
Managed Reports, ensuring seamless updates and premium service.
Satisfied Customers, committed to delivering exceptional value and quality.
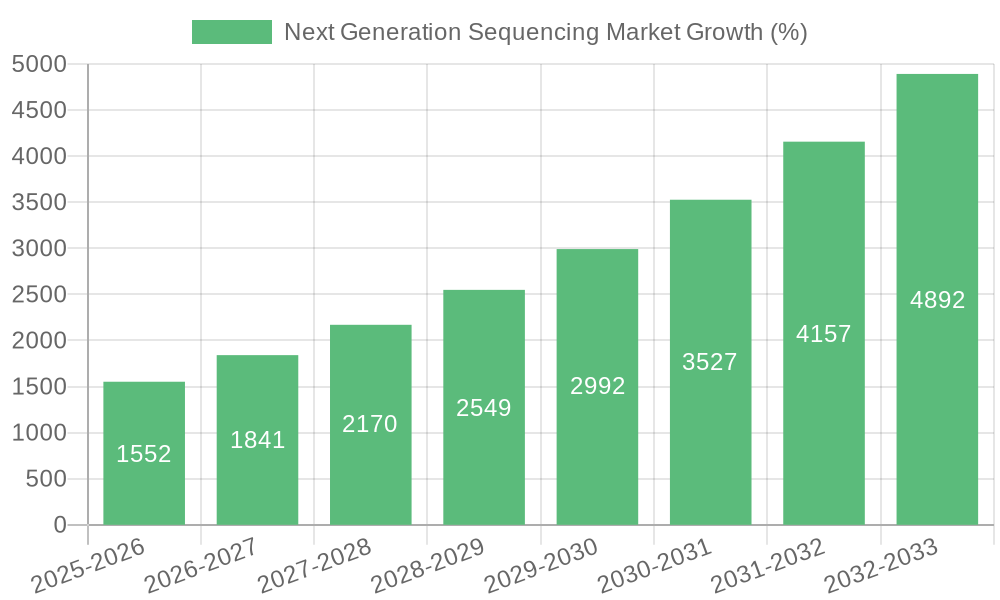
Next Generation Sequencing Market Future-Proof Strategies: Market Trends 2025-2033
Next Generation Sequencing Market by Product (Instruments, Consumables, Services), by Type (Whole genome sequencing, Exome sequencing, Targeted sequencing, Others), by Application (Research application, Clinical application, Others), by Technology (Sequencing by synthesis, Ion semiconductor sequencing, Others), by End-use (Academic institutes & research centers, Hospitals & clinics, Pharmaceutical & biotechnology companies, Others), by North America (U.S., Canada), by Europe (Germany, UK, France, Spain, Italy, Poland, Switzerland, Sweden), by Asia Pacific (China, India, Japan, Australia, South Korea, Thailand, Indonesia), by Latin America (Brazil, Mexico, Argentina, Colombia, Chile, Peru), by Middle East & Africa (Saudi Arabia, South Africa, UAE, Israel) Forecast 2025-2033
Next Generation Sequencing Market Future-Proof Strategies: Market Trends 2025-2033
Key Insights
The Next Generation Sequencing (NGS) market is experiencing robust growth, projected to reach an estimated $8 billion in 2025 and maintain a Compound Annual Growth Rate (CAGR) of 19.4% from 2025 to 2033. This expansion is driven by several key factors. Firstly, the increasing prevalence of chronic diseases like cancer and cardiovascular illnesses fuels demand for advanced diagnostic tools. NGS technology provides highly accurate and detailed genetic information, enabling early disease detection, personalized medicine approaches, and improved treatment strategies. Secondly, the continuous technological advancements in sequencing platforms, including improvements in speed, accuracy, and cost-effectiveness, are making NGS more accessible to a wider range of research and clinical settings. This accessibility is further enhanced by the increasing availability of bioinformatics tools and expertise needed to analyze the large datasets generated by NGS. Finally, supportive government initiatives and funding for genomics research are stimulating market growth, particularly in regions like North America and Asia-Pacific. The market is segmented by product (instruments, consumables, services), sequencing type (whole genome, exome, targeted), application (research, clinical), technology, and end-use (academic institutes, hospitals, pharmaceutical companies).
The market’s growth trajectory is expected to continue, fueled by the expansion of clinical applications. Cancer diagnostics and treatment are significant drivers, leveraging NGS for tumor profiling, biomarker discovery, and personalized cancer therapies. Reproductive health applications are also witnessing substantial growth as NGS aids in prenatal testing and carrier screening. Although regulatory hurdles and high initial investment costs can pose certain restraints, the overall market outlook remains positive, with continued advancements in technology and the increasing adoption of NGS across various sectors expected to offset these challenges. The competitive landscape comprises both established players like Illumina and Roche, and emerging companies offering innovative solutions. Geographical expansion into developing economies, driven by increasing healthcare expenditure and growing awareness of genetic testing, will significantly contribute to overall market growth in the coming years. The strong growth in the Asia-Pacific region, specifically in China and India, is anticipated to present significant opportunities.

Next Generation Sequencing Market Concentration & Characteristics
The Next Generation Sequencing (NGS) market is characterized by a moderately concentrated landscape, with a few dominant players holding significant market share. Illumina, for example, currently commands a substantial portion of the global market. However, the market also showcases a dynamic competitive environment with several other key players like Roche, Thermo Fisher Scientific, and 10X Genomics contributing significantly. This concentration is primarily due to high initial investment costs for R&D and manufacturing advanced sequencing technologies.
- Characteristics of Innovation: The NGS market is highly innovative, with ongoing advancements focusing on increasing throughput, reducing sequencing costs, improving accuracy, and expanding applications. Miniaturization, portable sequencing devices, and improved bioinformatics tools are key areas of innovation.
- Impact of Regulations: Stringent regulatory approvals for clinical applications, particularly in the diagnostics sector, are a key factor influencing market growth. Varying regulatory landscapes across different geographies also impact market expansion.
- Product Substitutes: While no direct substitutes exist for NGS in terms of comprehensive genomic analysis, alternative technologies like microarrays offer simpler, but less comprehensive, solutions for specific applications. The cost-effectiveness of microarray technology remains a competitive pressure for NGS, particularly in lower throughput applications.
- End-User Concentration: The market is diverse in end-users, including academic institutions, pharmaceutical companies, hospitals, and clinical diagnostic labs. However, the pharmaceutical and biotechnology sector represents a substantial and rapidly growing portion of the market due to the increasing use of NGS in drug discovery and development.
- Level of M&A: The NGS market has witnessed a significant level of mergers and acquisitions (M&A) activity. This reflects the industry's dynamic nature and the strategic need for companies to expand their product portfolios and market access. These acquisitions often involve smaller companies specializing in specific NGS technologies or applications being acquired by larger established players.
Next Generation Sequencing Market Trends
The NGS market is experiencing robust growth, driven by several key trends. The decreasing cost per base of sequencing is a major catalyst, making NGS increasingly accessible for a wider range of applications. Simultaneously, technological advancements are continuously enhancing the speed, accuracy, and throughput of sequencing platforms. This has fueled an expansion into new applications, notably in personalized medicine, precision oncology, and infectious disease diagnostics. Furthermore, the rise of cloud computing and sophisticated bioinformatics tools is simplifying data analysis and interpretation, making NGS more user-friendly for a broader range of researchers and clinicians.
The development of portable and point-of-care NGS devices promises to revolutionize healthcare by enabling faster and more accessible diagnoses in diverse settings. This accessibility is particularly relevant in remote areas or resource-limited settings where rapid diagnostics are critical for managing infectious diseases or providing personalized treatment options. The integration of NGS data with other omics data types, such as proteomics and metabolomics, is also gaining momentum, offering a more holistic view of biological systems and enhancing the accuracy of disease diagnosis and prognosis. The increased focus on preventative medicine and early disease detection is also driving the demand for NGS-based diagnostic tests. This increased adoption has generated a significant demand for skilled professionals in NGS technologies, data analysis, and bioinformatics, leading to a burgeoning job market in this field. The market also sees a significant push towards developing standardized workflows and data analysis pipelines to ensure consistency and reliability across various platforms. Finally, the ethical considerations surrounding the use of NGS data, including patient privacy and data security, are becoming increasingly important and influencing the regulatory landscape.
Key Region or Country & Segment to Dominate the Market
The North American market currently dominates the NGS landscape, driven by high research funding, robust healthcare infrastructure, and a strong presence of major NGS companies. Within North America, the United States accounts for the largest share. This dominance is projected to continue for the foreseeable future.
Dominant Segment: Clinical Applications
- Within the application segments, clinical applications are witnessing the fastest growth rate. This segment is further segmented into specific disease areas.
- Cancer diagnostics currently stands out as the largest sub-segment within clinical applications, followed by cardiovascular disease and infectious diseases.
- The growing demand for personalized medicine, coupled with the ability of NGS to identify specific genetic mutations driving cancer development, is propelling the market growth in oncology.
- Similarly, improved diagnostic testing for infectious diseases allows for rapid identification of pathogens and tailoring treatment strategies.
- The reproductive health sector is also experiencing strong growth as NGS provides valuable insights for prenatal diagnostics and carrier screening.
Reasons for Dominance:
- High Adoption Rates: Early adoption of NGS technology by leading research institutions and healthcare providers in North America.
- Robust Regulatory Framework: The relatively established and well-defined regulatory landscape in the US fosters market expansion while maintaining standards and quality.
- Strong Investment in R&D: Continued substantial investments by private and government entities in genomics research and technological development.
- Advanced Healthcare Infrastructure: Well-established healthcare infrastructure capable of supporting the implementation and utilization of NGS technologies in clinical settings.
Next Generation Sequencing Market Product Insights Report Coverage & Deliverables
This report provides a comprehensive analysis of the NGS market, focusing on key product segments, including instruments, consumables, and services. It provides detailed market size estimations, market share analysis for key players, and growth projections for each segment across different regions. The report also explores technology-specific market segments and their respective growth trajectories. The deliverables include detailed market size and forecasts, competitive landscape analysis, and technological advancements within the NGS market, supplemented by detailed regional analyses.
Next Generation Sequencing Market Analysis
The global NGS market is valued at approximately $15 billion in 2023. The market is projected to experience a Compound Annual Growth Rate (CAGR) of around 15% between 2023 and 2028, reaching an estimated value exceeding $30 billion by 2028. This significant growth is driven by various factors, including decreasing sequencing costs, advancements in technology, and expanding applications across diverse sectors.
Illumina currently holds the largest market share due to its dominant position in the instrument and consumables segment. However, other players like Thermo Fisher Scientific and Roche are also substantial contributors, particularly in the reagents and services segments. The market share distribution is dynamic, with new entrants and technological advancements continually reshaping the competitive landscape. The market size is calculated by considering revenue generated from the sale of NGS instruments, consumables (reagents, kits), and associated services (data analysis, bioinformatics support). Future growth is projected based on the anticipated adoption rates across various application areas, technological innovations, and global healthcare spending trends. The analysis takes into account current market conditions, emerging trends, and industry challenges.
Next Generation Sequencing Market Regional Insights
- North America
- U.S.: Largest market share due to high research funding, technological advancements, and strong healthcare infrastructure.
- Canada: Significant but smaller market compared to the U.S., still experiencing healthy growth.
- Europe
- Germany, UK, France: Leading European markets due to strong research institutions and government support for healthcare innovation.
- Spain, Italy, Poland, Switzerland, Sweden: Growing markets, showing increased investment in genomics research.
- Asia Pacific
- China, Japan, India: Rapidly expanding markets due to increasing healthcare spending and government initiatives to promote genomics research.
- Australia, South Korea, Thailand, Indonesia: Emerging markets with significant growth potential.
- Latin America
- Brazil, Mexico: Largest markets in the region, experiencing moderate growth driven by increased healthcare investments.
- Argentina, Colombia, Chile, Peru: Emerging markets with significant opportunities for growth.
- Middle East & Africa
- Saudi Arabia, South Africa, UAE, Israel: Growing markets with increased focus on healthcare infrastructure development and genomic research.
Driving Forces: What's Propelling the Next Generation Sequencing Market
The NGS market is propelled by several factors. Decreasing sequencing costs are making NGS more accessible for broader applications. Advancements in sequencing technologies, including increased throughput, higher accuracy, and portability, are also driving market growth. The rising demand for personalized medicine, precision oncology, and infectious disease diagnostics fuels further expansion. Furthermore, the integration of NGS with other omics data and the development of sophisticated bioinformatics tools enhances data analysis and interpretation.
Challenges and Restraints in Next Generation Sequencing Market
Challenges include high initial investment costs associated with NGS platforms, the need for specialized personnel to operate and analyze data, and the complex regulatory landscape surrounding clinical applications. Data privacy and security concerns related to genomic information also pose challenges. The availability of skilled professionals to analyze the large datasets generated by NGS remains a significant bottleneck, impacting the speed and effectiveness of research and clinical adoption.
Emerging Trends in Next Generation Sequencing Market
Emerging trends include the development of portable and point-of-care sequencing devices, the integration of NGS with other omics technologies, and the growing focus on cloud-based data analysis and interpretation. The increasing emphasis on standardized workflows and data analysis pipelines to ensure consistency and reliability across different platforms also represents a key trend.
Next Generation Sequencing Industry News
- January 2023: Illumina launches a new high-throughput sequencing platform.
- March 2023: Oxford Nanopore announces a significant reduction in sequencing costs.
- June 2023: Roche acquires a smaller NGS company specializing in cancer diagnostics.
- September 2023: New regulations regarding the clinical use of NGS data are implemented in the EU.
- November 2023: A major breakthrough in long-read sequencing technology is reported.
Leading Players in the Next Generation Sequencing Market
- 10X Genomics
- BGI
- Agilent Technologies Inc
- Bio-Rad Laboratories
- GenapSys Inc
- F Hoffmann-La Roche
- Illumina Inc
- Oxford Nanopore Technologies
- NanoString Technologies
- Pacific Biosciences of California, Inc
- Qiagen
- PerkinElmer Inc
- Thermo Fisher Scientific
Next Generation Sequencing Market Segmentation
-
1. Product
- 1.1. Instruments
- 1.2. Consumables
- 1.3. Services
-
2. Type
- 2.1. Whole genome sequencing
- 2.2. Exome sequencing
- 2.3. Targeted sequencing
- 2.4. Others
-
3. Application
- 3.1. Research application
-
3.2. Clinical application
- 3.2.1. Cardiovascular
- 3.2.2. Reproductive health
- 3.2.3. Cancer
- 3.2.4. Infectious diseases
- 3.2.5. Others
- 3.3. Others
-
4. Technology
- 4.1. Sequencing by synthesis
- 4.2. Ion semiconductor sequencing
- 4.3. Others
-
5. End-use
- 5.1. Academic institutes & research centers
- 5.2. Hospitals & clinics
- 5.3. Pharmaceutical & biotechnology companies
- 5.4. Others
Next Generation Sequencing Market Segmentation By Geography
-
1. North America
- 1.1. U.S.
- 1.2. Canada
-
2. Europe
- 2.1. Germany
- 2.2. UK
- 2.3. France
- 2.4. Spain
- 2.5. Italy
- 2.6. Poland
- 2.7. Switzerland
- 2.8. Sweden
-
3. Asia Pacific
- 3.1. China
- 3.2. India
- 3.3. Japan
- 3.4. Australia
- 3.5. South Korea
- 3.6. Thailand
- 3.7. Indonesia
-
4. Latin America
- 4.1. Brazil
- 4.2. Mexico
- 4.3. Argentina
- 4.4. Colombia
- 4.5. Chile
- 4.6. Peru
-
5. Middle East & Africa
- 5.1. Saudi Arabia
- 5.2. South Africa
- 5.3. UAE
- 5.4. Israel

Next Generation Sequencing Market REPORT HIGHLIGHTS
| Aspects | Details |
|---|---|
| Study Period | 2019-2033 |
| Base Year | 2024 |
| Estimated Year | 2025 |
| Forecast Period | 2025-2033 |
| Historical Period | 2019-2024 |
| Growth Rate | CAGR of 19.4% from 2019-2033 |
| Segmentation |
|
- 1. Introduction
- 1.1. Research Scope
- 1.2. Market Segmentation
- 1.3. Research Methodology
- 1.4. Definitions and Assumptions
- 2. Executive Summary
- 2.1. Introduction
- 3. Market Dynamics
- 3.1. Introduction
- 3.2. Market Drivers
- 3.2.1 Technological advancements in next generation sequencing in developed countries
- 3.2.2 Increasing research and development activities in North America and Europe
- 3.2.3 Growing use of NGS technology by pharmaceutical and biopharmaceutical companies in advanced economies
- 3.2.4 Favorable regulatory scenario in North America
- 3.3. Market Restrains
- 3.3.1 Dearth of skilled professionals
- 3.3.2 High cost of next generation sequencing
- 3.4. Market Trends
- 4. Market Factor Analysis
- 4.1. Porters Five Forces
- 4.2. Supply/Value Chain
- 4.3. PESTEL analysis
- 4.4. Market Entropy
- 4.5. Patent/Trademark Analysis
- 5. Global Next Generation Sequencing Market Analysis, Insights and Forecast, 2019-2031
- 5.1. Market Analysis, Insights and Forecast - by Product
- 5.1.1. Instruments
- 5.1.2. Consumables
- 5.1.3. Services
- 5.2. Market Analysis, Insights and Forecast - by Type
- 5.2.1. Whole genome sequencing
- 5.2.2. Exome sequencing
- 5.2.3. Targeted sequencing
- 5.2.4. Others
- 5.3. Market Analysis, Insights and Forecast - by Application
- 5.3.1. Research application
- 5.3.2. Clinical application
- 5.3.2.1. Cardiovascular
- 5.3.2.2. Reproductive health
- 5.3.2.3. Cancer
- 5.3.2.4. Infectious diseases
- 5.3.2.5. Others
- 5.3.3. Others
- 5.4. Market Analysis, Insights and Forecast - by Technology
- 5.4.1. Sequencing by synthesis
- 5.4.2. Ion semiconductor sequencing
- 5.4.3. Others
- 5.5. Market Analysis, Insights and Forecast - by End-use
- 5.5.1. Academic institutes & research centers
- 5.5.2. Hospitals & clinics
- 5.5.3. Pharmaceutical & biotechnology companies
- 5.5.4. Others
- 5.6. Market Analysis, Insights and Forecast - by Region
- 5.6.1. North America
- 5.6.2. Europe
- 5.6.3. Asia Pacific
- 5.6.4. Latin America
- 5.6.5. Middle East & Africa
- 5.1. Market Analysis, Insights and Forecast - by Product
- 6. North America Next Generation Sequencing Market Analysis, Insights and Forecast, 2019-2031
- 6.1. Market Analysis, Insights and Forecast - by Product
- 6.1.1. Instruments
- 6.1.2. Consumables
- 6.1.3. Services
- 6.2. Market Analysis, Insights and Forecast - by Type
- 6.2.1. Whole genome sequencing
- 6.2.2. Exome sequencing
- 6.2.3. Targeted sequencing
- 6.2.4. Others
- 6.3. Market Analysis, Insights and Forecast - by Application
- 6.3.1. Research application
- 6.3.2. Clinical application
- 6.3.2.1. Cardiovascular
- 6.3.2.2. Reproductive health
- 6.3.2.3. Cancer
- 6.3.2.4. Infectious diseases
- 6.3.2.5. Others
- 6.3.3. Others
- 6.4. Market Analysis, Insights and Forecast - by Technology
- 6.4.1. Sequencing by synthesis
- 6.4.2. Ion semiconductor sequencing
- 6.4.3. Others
- 6.5. Market Analysis, Insights and Forecast - by End-use
- 6.5.1. Academic institutes & research centers
- 6.5.2. Hospitals & clinics
- 6.5.3. Pharmaceutical & biotechnology companies
- 6.5.4. Others
- 6.1. Market Analysis, Insights and Forecast - by Product
- 7. Europe Next Generation Sequencing Market Analysis, Insights and Forecast, 2019-2031
- 7.1. Market Analysis, Insights and Forecast - by Product
- 7.1.1. Instruments
- 7.1.2. Consumables
- 7.1.3. Services
- 7.2. Market Analysis, Insights and Forecast - by Type
- 7.2.1. Whole genome sequencing
- 7.2.2. Exome sequencing
- 7.2.3. Targeted sequencing
- 7.2.4. Others
- 7.3. Market Analysis, Insights and Forecast - by Application
- 7.3.1. Research application
- 7.3.2. Clinical application
- 7.3.2.1. Cardiovascular
- 7.3.2.2. Reproductive health
- 7.3.2.3. Cancer
- 7.3.2.4. Infectious diseases
- 7.3.2.5. Others
- 7.3.3. Others
- 7.4. Market Analysis, Insights and Forecast - by Technology
- 7.4.1. Sequencing by synthesis
- 7.4.2. Ion semiconductor sequencing
- 7.4.3. Others
- 7.5. Market Analysis, Insights and Forecast - by End-use
- 7.5.1. Academic institutes & research centers
- 7.5.2. Hospitals & clinics
- 7.5.3. Pharmaceutical & biotechnology companies
- 7.5.4. Others
- 7.1. Market Analysis, Insights and Forecast - by Product
- 8. Asia Pacific Next Generation Sequencing Market Analysis, Insights and Forecast, 2019-2031
- 8.1. Market Analysis, Insights and Forecast - by Product
- 8.1.1. Instruments
- 8.1.2. Consumables
- 8.1.3. Services
- 8.2. Market Analysis, Insights and Forecast - by Type
- 8.2.1. Whole genome sequencing
- 8.2.2. Exome sequencing
- 8.2.3. Targeted sequencing
- 8.2.4. Others
- 8.3. Market Analysis, Insights and Forecast - by Application
- 8.3.1. Research application
- 8.3.2. Clinical application
- 8.3.2.1. Cardiovascular
- 8.3.2.2. Reproductive health
- 8.3.2.3. Cancer
- 8.3.2.4. Infectious diseases
- 8.3.2.5. Others
- 8.3.3. Others
- 8.4. Market Analysis, Insights and Forecast - by Technology
- 8.4.1. Sequencing by synthesis
- 8.4.2. Ion semiconductor sequencing
- 8.4.3. Others
- 8.5. Market Analysis, Insights and Forecast - by End-use
- 8.5.1. Academic institutes & research centers
- 8.5.2. Hospitals & clinics
- 8.5.3. Pharmaceutical & biotechnology companies
- 8.5.4. Others
- 8.1. Market Analysis, Insights and Forecast - by Product
- 9. Latin America Next Generation Sequencing Market Analysis, Insights and Forecast, 2019-2031
- 9.1. Market Analysis, Insights and Forecast - by Product
- 9.1.1. Instruments
- 9.1.2. Consumables
- 9.1.3. Services
- 9.2. Market Analysis, Insights and Forecast - by Type
- 9.2.1. Whole genome sequencing
- 9.2.2. Exome sequencing
- 9.2.3. Targeted sequencing
- 9.2.4. Others
- 9.3. Market Analysis, Insights and Forecast - by Application
- 9.3.1. Research application
- 9.3.2. Clinical application
- 9.3.2.1. Cardiovascular
- 9.3.2.2. Reproductive health
- 9.3.2.3. Cancer
- 9.3.2.4. Infectious diseases
- 9.3.2.5. Others
- 9.3.3. Others
- 9.4. Market Analysis, Insights and Forecast - by Technology
- 9.4.1. Sequencing by synthesis
- 9.4.2. Ion semiconductor sequencing
- 9.4.3. Others
- 9.5. Market Analysis, Insights and Forecast - by End-use
- 9.5.1. Academic institutes & research centers
- 9.5.2. Hospitals & clinics
- 9.5.3. Pharmaceutical & biotechnology companies
- 9.5.4. Others
- 9.1. Market Analysis, Insights and Forecast - by Product
- 10. Middle East & Africa Next Generation Sequencing Market Analysis, Insights and Forecast, 2019-2031
- 10.1. Market Analysis, Insights and Forecast - by Product
- 10.1.1. Instruments
- 10.1.2. Consumables
- 10.1.3. Services
- 10.2. Market Analysis, Insights and Forecast - by Type
- 10.2.1. Whole genome sequencing
- 10.2.2. Exome sequencing
- 10.2.3. Targeted sequencing
- 10.2.4. Others
- 10.3. Market Analysis, Insights and Forecast - by Application
- 10.3.1. Research application
- 10.3.2. Clinical application
- 10.3.2.1. Cardiovascular
- 10.3.2.2. Reproductive health
- 10.3.2.3. Cancer
- 10.3.2.4. Infectious diseases
- 10.3.2.5. Others
- 10.3.3. Others
- 10.4. Market Analysis, Insights and Forecast - by Technology
- 10.4.1. Sequencing by synthesis
- 10.4.2. Ion semiconductor sequencing
- 10.4.3. Others
- 10.5. Market Analysis, Insights and Forecast - by End-use
- 10.5.1. Academic institutes & research centers
- 10.5.2. Hospitals & clinics
- 10.5.3. Pharmaceutical & biotechnology companies
- 10.5.4. Others
- 10.1. Market Analysis, Insights and Forecast - by Product
- 11. Competitive Analysis
- 11.1. Global Market Share Analysis 2024
- 11.2. Company Profiles
- 11.2.1 10X Genomics
- 11.2.1.1. Overview
- 11.2.1.2. Products
- 11.2.1.3. SWOT Analysis
- 11.2.1.4. Recent Developments
- 11.2.1.5. Financials (Based on Availability)
- 11.2.2 BGI
- 11.2.2.1. Overview
- 11.2.2.2. Products
- 11.2.2.3. SWOT Analysis
- 11.2.2.4. Recent Developments
- 11.2.2.5. Financials (Based on Availability)
- 11.2.3 Agilent Technologies Inc
- 11.2.3.1. Overview
- 11.2.3.2. Products
- 11.2.3.3. SWOT Analysis
- 11.2.3.4. Recent Developments
- 11.2.3.5. Financials (Based on Availability)
- 11.2.4 Bio-Rad Laboratories
- 11.2.4.1. Overview
- 11.2.4.2. Products
- 11.2.4.3. SWOT Analysis
- 11.2.4.4. Recent Developments
- 11.2.4.5. Financials (Based on Availability)
- 11.2.5 GenapSys Inc
- 11.2.5.1. Overview
- 11.2.5.2. Products
- 11.2.5.3. SWOT Analysis
- 11.2.5.4. Recent Developments
- 11.2.5.5. Financials (Based on Availability)
- 11.2.6 F Hoffmann-La Roche
- 11.2.6.1. Overview
- 11.2.6.2. Products
- 11.2.6.3. SWOT Analysis
- 11.2.6.4. Recent Developments
- 11.2.6.5. Financials (Based on Availability)
- 11.2.7 Illumina Inc
- 11.2.7.1. Overview
- 11.2.7.2. Products
- 11.2.7.3. SWOT Analysis
- 11.2.7.4. Recent Developments
- 11.2.7.5. Financials (Based on Availability)
- 11.2.8 Oxford Nanopore Technologies
- 11.2.8.1. Overview
- 11.2.8.2. Products
- 11.2.8.3. SWOT Analysis
- 11.2.8.4. Recent Developments
- 11.2.8.5. Financials (Based on Availability)
- 11.2.9 NanoString Technologies
- 11.2.9.1. Overview
- 11.2.9.2. Products
- 11.2.9.3. SWOT Analysis
- 11.2.9.4. Recent Developments
- 11.2.9.5. Financials (Based on Availability)
- 11.2.10 Pacific Biosciences of California Inc
- 11.2.10.1. Overview
- 11.2.10.2. Products
- 11.2.10.3. SWOT Analysis
- 11.2.10.4. Recent Developments
- 11.2.10.5. Financials (Based on Availability)
- 11.2.11 Qiagen
- 11.2.11.1. Overview
- 11.2.11.2. Products
- 11.2.11.3. SWOT Analysis
- 11.2.11.4. Recent Developments
- 11.2.11.5. Financials (Based on Availability)
- 11.2.12 PerkinElmer Inc
- 11.2.12.1. Overview
- 11.2.12.2. Products
- 11.2.12.3. SWOT Analysis
- 11.2.12.4. Recent Developments
- 11.2.12.5. Financials (Based on Availability)
- 11.2.13 Thermo Fisher Scientific
- 11.2.13.1. Overview
- 11.2.13.2. Products
- 11.2.13.3. SWOT Analysis
- 11.2.13.4. Recent Developments
- 11.2.13.5. Financials (Based on Availability)
- 11.2.1 10X Genomics
- Figure 1: Global Next Generation Sequencing Market Revenue Breakdown (Billion, %) by Region 2024 & 2032
- Figure 2: North America Next Generation Sequencing Market Revenue (Billion), by Product 2024 & 2032
- Figure 3: North America Next Generation Sequencing Market Revenue Share (%), by Product 2024 & 2032
- Figure 4: North America Next Generation Sequencing Market Revenue (Billion), by Type 2024 & 2032
- Figure 5: North America Next Generation Sequencing Market Revenue Share (%), by Type 2024 & 2032
- Figure 6: North America Next Generation Sequencing Market Revenue (Billion), by Application 2024 & 2032
- Figure 7: North America Next Generation Sequencing Market Revenue Share (%), by Application 2024 & 2032
- Figure 8: North America Next Generation Sequencing Market Revenue (Billion), by Technology 2024 & 2032
- Figure 9: North America Next Generation Sequencing Market Revenue Share (%), by Technology 2024 & 2032
- Figure 10: North America Next Generation Sequencing Market Revenue (Billion), by End-use 2024 & 2032
- Figure 11: North America Next Generation Sequencing Market Revenue Share (%), by End-use 2024 & 2032
- Figure 12: North America Next Generation Sequencing Market Revenue (Billion), by Country 2024 & 2032
- Figure 13: North America Next Generation Sequencing Market Revenue Share (%), by Country 2024 & 2032
- Figure 14: Europe Next Generation Sequencing Market Revenue (Billion), by Product 2024 & 2032
- Figure 15: Europe Next Generation Sequencing Market Revenue Share (%), by Product 2024 & 2032
- Figure 16: Europe Next Generation Sequencing Market Revenue (Billion), by Type 2024 & 2032
- Figure 17: Europe Next Generation Sequencing Market Revenue Share (%), by Type 2024 & 2032
- Figure 18: Europe Next Generation Sequencing Market Revenue (Billion), by Application 2024 & 2032
- Figure 19: Europe Next Generation Sequencing Market Revenue Share (%), by Application 2024 & 2032
- Figure 20: Europe Next Generation Sequencing Market Revenue (Billion), by Technology 2024 & 2032
- Figure 21: Europe Next Generation Sequencing Market Revenue Share (%), by Technology 2024 & 2032
- Figure 22: Europe Next Generation Sequencing Market Revenue (Billion), by End-use 2024 & 2032
- Figure 23: Europe Next Generation Sequencing Market Revenue Share (%), by End-use 2024 & 2032
- Figure 24: Europe Next Generation Sequencing Market Revenue (Billion), by Country 2024 & 2032
- Figure 25: Europe Next Generation Sequencing Market Revenue Share (%), by Country 2024 & 2032
- Figure 26: Asia Pacific Next Generation Sequencing Market Revenue (Billion), by Product 2024 & 2032
- Figure 27: Asia Pacific Next Generation Sequencing Market Revenue Share (%), by Product 2024 & 2032
- Figure 28: Asia Pacific Next Generation Sequencing Market Revenue (Billion), by Type 2024 & 2032
- Figure 29: Asia Pacific Next Generation Sequencing Market Revenue Share (%), by Type 2024 & 2032
- Figure 30: Asia Pacific Next Generation Sequencing Market Revenue (Billion), by Application 2024 & 2032
- Figure 31: Asia Pacific Next Generation Sequencing Market Revenue Share (%), by Application 2024 & 2032
- Figure 32: Asia Pacific Next Generation Sequencing Market Revenue (Billion), by Technology 2024 & 2032
- Figure 33: Asia Pacific Next Generation Sequencing Market Revenue Share (%), by Technology 2024 & 2032
- Figure 34: Asia Pacific Next Generation Sequencing Market Revenue (Billion), by End-use 2024 & 2032
- Figure 35: Asia Pacific Next Generation Sequencing Market Revenue Share (%), by End-use 2024 & 2032
- Figure 36: Asia Pacific Next Generation Sequencing Market Revenue (Billion), by Country 2024 & 2032
- Figure 37: Asia Pacific Next Generation Sequencing Market Revenue Share (%), by Country 2024 & 2032
- Figure 38: Latin America Next Generation Sequencing Market Revenue (Billion), by Product 2024 & 2032
- Figure 39: Latin America Next Generation Sequencing Market Revenue Share (%), by Product 2024 & 2032
- Figure 40: Latin America Next Generation Sequencing Market Revenue (Billion), by Type 2024 & 2032
- Figure 41: Latin America Next Generation Sequencing Market Revenue Share (%), by Type 2024 & 2032
- Figure 42: Latin America Next Generation Sequencing Market Revenue (Billion), by Application 2024 & 2032
- Figure 43: Latin America Next Generation Sequencing Market Revenue Share (%), by Application 2024 & 2032
- Figure 44: Latin America Next Generation Sequencing Market Revenue (Billion), by Technology 2024 & 2032
- Figure 45: Latin America Next Generation Sequencing Market Revenue Share (%), by Technology 2024 & 2032
- Figure 46: Latin America Next Generation Sequencing Market Revenue (Billion), by End-use 2024 & 2032
- Figure 47: Latin America Next Generation Sequencing Market Revenue Share (%), by End-use 2024 & 2032
- Figure 48: Latin America Next Generation Sequencing Market Revenue (Billion), by Country 2024 & 2032
- Figure 49: Latin America Next Generation Sequencing Market Revenue Share (%), by Country 2024 & 2032
- Figure 50: Middle East & Africa Next Generation Sequencing Market Revenue (Billion), by Product 2024 & 2032
- Figure 51: Middle East & Africa Next Generation Sequencing Market Revenue Share (%), by Product 2024 & 2032
- Figure 52: Middle East & Africa Next Generation Sequencing Market Revenue (Billion), by Type 2024 & 2032
- Figure 53: Middle East & Africa Next Generation Sequencing Market Revenue Share (%), by Type 2024 & 2032
- Figure 54: Middle East & Africa Next Generation Sequencing Market Revenue (Billion), by Application 2024 & 2032
- Figure 55: Middle East & Africa Next Generation Sequencing Market Revenue Share (%), by Application 2024 & 2032
- Figure 56: Middle East & Africa Next Generation Sequencing Market Revenue (Billion), by Technology 2024 & 2032
- Figure 57: Middle East & Africa Next Generation Sequencing Market Revenue Share (%), by Technology 2024 & 2032
- Figure 58: Middle East & Africa Next Generation Sequencing Market Revenue (Billion), by End-use 2024 & 2032
- Figure 59: Middle East & Africa Next Generation Sequencing Market Revenue Share (%), by End-use 2024 & 2032
- Figure 60: Middle East & Africa Next Generation Sequencing Market Revenue (Billion), by Country 2024 & 2032
- Figure 61: Middle East & Africa Next Generation Sequencing Market Revenue Share (%), by Country 2024 & 2032
- Table 1: Global Next Generation Sequencing Market Revenue Billion Forecast, by Region 2019 & 2032
- Table 2: Global Next Generation Sequencing Market Revenue Billion Forecast, by Product 2019 & 2032
- Table 3: Global Next Generation Sequencing Market Revenue Billion Forecast, by Type 2019 & 2032
- Table 4: Global Next Generation Sequencing Market Revenue Billion Forecast, by Application 2019 & 2032
- Table 5: Global Next Generation Sequencing Market Revenue Billion Forecast, by Technology 2019 & 2032
- Table 6: Global Next Generation Sequencing Market Revenue Billion Forecast, by End-use 2019 & 2032
- Table 7: Global Next Generation Sequencing Market Revenue Billion Forecast, by Region 2019 & 2032
- Table 8: Global Next Generation Sequencing Market Revenue Billion Forecast, by Product 2019 & 2032
- Table 9: Global Next Generation Sequencing Market Revenue Billion Forecast, by Type 2019 & 2032
- Table 10: Global Next Generation Sequencing Market Revenue Billion Forecast, by Application 2019 & 2032
- Table 11: Global Next Generation Sequencing Market Revenue Billion Forecast, by Technology 2019 & 2032
- Table 12: Global Next Generation Sequencing Market Revenue Billion Forecast, by End-use 2019 & 2032
- Table 13: Global Next Generation Sequencing Market Revenue Billion Forecast, by Country 2019 & 2032
- Table 14: U.S. Next Generation Sequencing Market Revenue (Billion) Forecast, by Application 2019 & 2032
- Table 15: Canada Next Generation Sequencing Market Revenue (Billion) Forecast, by Application 2019 & 2032
- Table 16: Global Next Generation Sequencing Market Revenue Billion Forecast, by Product 2019 & 2032
- Table 17: Global Next Generation Sequencing Market Revenue Billion Forecast, by Type 2019 & 2032
- Table 18: Global Next Generation Sequencing Market Revenue Billion Forecast, by Application 2019 & 2032
- Table 19: Global Next Generation Sequencing Market Revenue Billion Forecast, by Technology 2019 & 2032
- Table 20: Global Next Generation Sequencing Market Revenue Billion Forecast, by End-use 2019 & 2032
- Table 21: Global Next Generation Sequencing Market Revenue Billion Forecast, by Country 2019 & 2032
- Table 22: Germany Next Generation Sequencing Market Revenue (Billion) Forecast, by Application 2019 & 2032
- Table 23: UK Next Generation Sequencing Market Revenue (Billion) Forecast, by Application 2019 & 2032
- Table 24: France Next Generation Sequencing Market Revenue (Billion) Forecast, by Application 2019 & 2032
- Table 25: Spain Next Generation Sequencing Market Revenue (Billion) Forecast, by Application 2019 & 2032
- Table 26: Italy Next Generation Sequencing Market Revenue (Billion) Forecast, by Application 2019 & 2032
- Table 27: Poland Next Generation Sequencing Market Revenue (Billion) Forecast, by Application 2019 & 2032
- Table 28: Switzerland Next Generation Sequencing Market Revenue (Billion) Forecast, by Application 2019 & 2032
- Table 29: Sweden Next Generation Sequencing Market Revenue (Billion) Forecast, by Application 2019 & 2032
- Table 30: Global Next Generation Sequencing Market Revenue Billion Forecast, by Product 2019 & 2032
- Table 31: Global Next Generation Sequencing Market Revenue Billion Forecast, by Type 2019 & 2032
- Table 32: Global Next Generation Sequencing Market Revenue Billion Forecast, by Application 2019 & 2032
- Table 33: Global Next Generation Sequencing Market Revenue Billion Forecast, by Technology 2019 & 2032
- Table 34: Global Next Generation Sequencing Market Revenue Billion Forecast, by End-use 2019 & 2032
- Table 35: Global Next Generation Sequencing Market Revenue Billion Forecast, by Country 2019 & 2032
- Table 36: China Next Generation Sequencing Market Revenue (Billion) Forecast, by Application 2019 & 2032
- Table 37: India Next Generation Sequencing Market Revenue (Billion) Forecast, by Application 2019 & 2032
- Table 38: Japan Next Generation Sequencing Market Revenue (Billion) Forecast, by Application 2019 & 2032
- Table 39: Australia Next Generation Sequencing Market Revenue (Billion) Forecast, by Application 2019 & 2032
- Table 40: South Korea Next Generation Sequencing Market Revenue (Billion) Forecast, by Application 2019 & 2032
- Table 41: Thailand Next Generation Sequencing Market Revenue (Billion) Forecast, by Application 2019 & 2032
- Table 42: Indonesia Next Generation Sequencing Market Revenue (Billion) Forecast, by Application 2019 & 2032
- Table 43: Global Next Generation Sequencing Market Revenue Billion Forecast, by Product 2019 & 2032
- Table 44: Global Next Generation Sequencing Market Revenue Billion Forecast, by Type 2019 & 2032
- Table 45: Global Next Generation Sequencing Market Revenue Billion Forecast, by Application 2019 & 2032
- Table 46: Global Next Generation Sequencing Market Revenue Billion Forecast, by Technology 2019 & 2032
- Table 47: Global Next Generation Sequencing Market Revenue Billion Forecast, by End-use 2019 & 2032
- Table 48: Global Next Generation Sequencing Market Revenue Billion Forecast, by Country 2019 & 2032
- Table 49: Brazil Next Generation Sequencing Market Revenue (Billion) Forecast, by Application 2019 & 2032
- Table 50: Mexico Next Generation Sequencing Market Revenue (Billion) Forecast, by Application 2019 & 2032
- Table 51: Argentina Next Generation Sequencing Market Revenue (Billion) Forecast, by Application 2019 & 2032
- Table 52: Colombia Next Generation Sequencing Market Revenue (Billion) Forecast, by Application 2019 & 2032
- Table 53: Chile Next Generation Sequencing Market Revenue (Billion) Forecast, by Application 2019 & 2032
- Table 54: Peru Next Generation Sequencing Market Revenue (Billion) Forecast, by Application 2019 & 2032
- Table 55: Global Next Generation Sequencing Market Revenue Billion Forecast, by Product 2019 & 2032
- Table 56: Global Next Generation Sequencing Market Revenue Billion Forecast, by Type 2019 & 2032
- Table 57: Global Next Generation Sequencing Market Revenue Billion Forecast, by Application 2019 & 2032
- Table 58: Global Next Generation Sequencing Market Revenue Billion Forecast, by Technology 2019 & 2032
- Table 59: Global Next Generation Sequencing Market Revenue Billion Forecast, by End-use 2019 & 2032
- Table 60: Global Next Generation Sequencing Market Revenue Billion Forecast, by Country 2019 & 2032
- Table 61: Saudi Arabia Next Generation Sequencing Market Revenue (Billion) Forecast, by Application 2019 & 2032
- Table 62: South Africa Next Generation Sequencing Market Revenue (Billion) Forecast, by Application 2019 & 2032
- Table 63: UAE Next Generation Sequencing Market Revenue (Billion) Forecast, by Application 2019 & 2032
- Table 64: Israel Next Generation Sequencing Market Revenue (Billion) Forecast, by Application 2019 & 2032
STEP 1 - Identification of Relevant Samples Size from Population Database


STEP 2 - Approaches for Defining Global Market Size (Value, Volume* & Price*)

Note* : In applicable scenarios
STEP 3 - Data Sources
Primary Research
- Web Analytics
- Survey Reports
- Research Institute
- Latest Research Reports
- Opinion Leaders
Secondary Research
- Annual Reports
- White Paper
- Latest Press Release
- Industry Association
- Paid Database
- Investor Presentations

STEP 4 - Data Triangulation
Involves using different sources of information in order to increase the validity of a study
These sources are likely to be stakeholders in a program - participants, other researchers, program staff, other community members, and so on.
Then we put all data in single framework & apply various statistical tools to find out the dynamic on the market.
During the analysis stage, feedback from the stakeholder groups would be compared to determine areas of agreement as well as areas of divergence
Frequently Asked Questions
Related Reports
See the similar reports


About Market Insights Report
Market Insights Reports offers comprehensive market research reports and analysis, giving businesses important information about their clients, rivals, and sector to help them make well-informed decisions on operations, marketing, and business strategy. We offer a variety of services in addition to market research, data analysis, and strategy planning. In order to find opportunities and learn more about our competitors and the industry at large, we employ competitive analysis. To identify areas for development, we also evaluate our performance against that of our rivals. We can determine the places at which we can offer our clients the most value by performing value chain analysis.
Additionally, clients receive a thorough overview of their industry business environment. We can find trends that help us forecast future possibilities and threats by examining global macroeconomic dynamics and consumer behavior patterns. By analyzing their features and advantages, contrasting them with comparable items on the market, and evaluating both their quantitative and qualitative performance, we comprehensively evaluate our clients' products. This allows us to assist customers in determining how their goods compare to those of their rivals and in creating successful marketing plans. Our group has been successful in gaining a thorough grasp of our clients' requirements and offering them creative solutions. We currently provide services to more than 50 nations in Europe, the Middle East, Africa, Latin America, Asia Pacific, and North America. Because of our global reach, we have been able to establish trusting bonds with our partners and clients in various nations, improving customer service and forging a more cohesive worldwide presence.