
.jpg&w=3840&q=100)
Market
Insights
Reports delivered globally, covering a wide range of industries and sectors.
Clients who trust our expertise and rely on our insights for business decisions.
Managed Reports, ensuring seamless updates and premium service.
Satisfied Customers, committed to delivering exceptional value and quality.
Optical Sorter Market 2025-2033 Overview: Trends, Competitor Dynamics, and Opportunities
Optical Sorter Market by Product (Lasers, Cameras, NIR sorters, Hyperspectral cameras), by Platform (Belt, Freefall, Lane, Hybrid), by Application (Recycling, Mining, Food, Others), by North America (U.S., Canada), by Europe (UK, Germany, France, Italy, Spain), by Asia Pacific (China, India, Japan, South Korea, Taiwan, Australia), by Latin America (Brazil, Mexico), by Middle East & Africa (MEA) (Saudi Arabia, UAE, South Africa) Forecast 2025-2033
Optical Sorter Market 2025-2033 Overview: Trends, Competitor Dynamics, and Opportunities
Key Insights
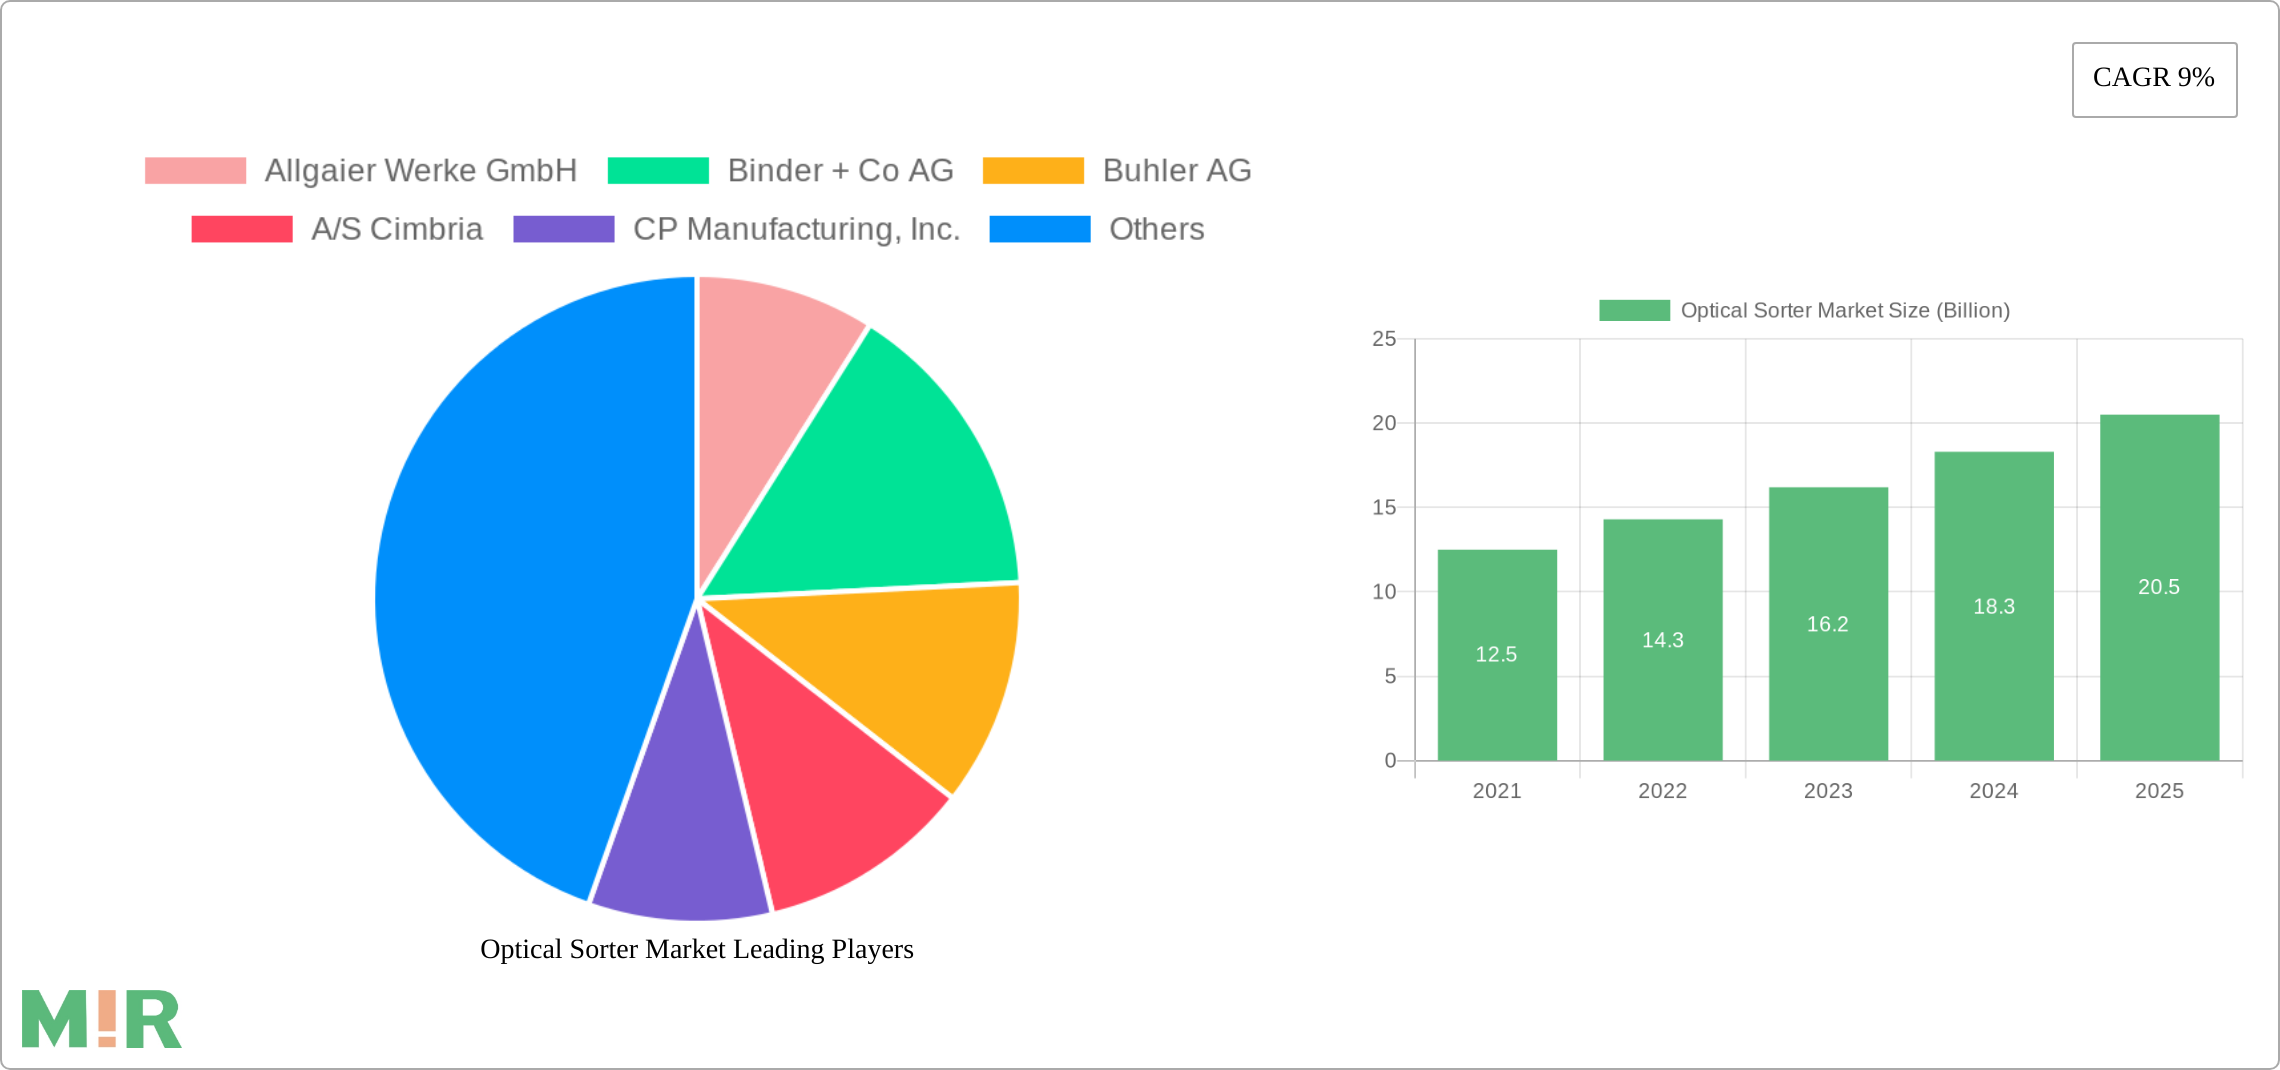
The size of the Optical Sorter Market was valued at USD 1.5 Billion in 2024 and is projected to reach USD 2.74 Billion by 2033, with an expected CAGR of 9% during the forecast period.Global market of optical sorter: This market is huge at $1.5 billion presently, and in coming years is bound to rise very robustly. As of a good compound annual growth rate, within the next couple of years it would touch huge numbers. Several factors are in the cause that has given rise to this trajectory. With the increased demand for high-quality hybrid seeds with improved yields and enhanced resistance against pests and diseases, optical sorters must be used while processing seeds. Increasing government initiatives focused on improving food safety and quality standards are also fueling market growth. Furthermore, continuing and accelerating development on optical sorting technologies that create high-performance, productive, and even more precise machine tools continue fueling this trend.
Optical Sorter Market Concentration & Characteristics
The optical sorter market is highly concentrated, with the top players accounting for a significant share. The market is characterized by innovation, with companies continually developing new technologies such as advanced sensors and image recognition software. Regulations play a crucial role in the market, as they impact the design and operation of optical sorters. Product substitutes, such as manual sorting, limit the market's growth potential. End-user concentration is evident, with large-scale agricultural companies being the primary consumers of optical sorters. The M&A activity in the market is moderate, with companies seeking to strengthen their market position and gain access to new technologies.
Optical Sorter Market Trends
Key market trends include the growing demand for high-speed and high-resolution sorters, the increasing adoption of integrated optical sorter systems, and the emergence of new applications in industries such as mining and recycling. The market is also witnessing the rise of predictive maintenance and remote monitoring technologies, enabling predictive maintenance and proactive problem-solving.

Key Region or Country & Segment to Dominate the Market
North America is a prominent region in the optical sorter market, driven by the large agricultural sector and the adoption of advanced sorting technologies. Asia-Pacific is expected to experience significant growth due to the rising demand for food safety and quality. The belt platform is expected to dominate the market, followed by the lane and freefall platforms. The food segment accounts for the largest share of the market, with growing applications in seed processing, grain sorting, and food safety inspection.
Optical Sorter Market Product Insights Report Coverage & Deliverables
The report provides in-depth coverage of the optical sorter market, including market size, market share, and growth analysis. It examines the various market segments, including product types, platforms, applications, and regions. The report also includes detailed company profiles of key players in the market.
Optical Sorter Market Analysis
The market analysis section provides a comprehensive assessment of the market size, market share, and growth prospects for different market segments. The report employs market sizing techniques and industry-specific research methodologies to provide accurate and reliable estimates.
Optical Sorter Market Regional Insights
- North America
- U.S.
- Canada
- Europe
- UK
- Germany
- France
- Italy
- Spain
- Asia Pacific
- China
- India
- Japan
- South Korea
- Taiwan
- Australia
- Latin America
- Brazil
- Mexico
- Middle East & Africa (MEA)
- Saudi Arabia
- UAE
- South Africa
Driving Forces: What's Propelling the Optical Sorter Market
- Growing demand for hybrid seeds
- Government initiatives for food safety
- Rising food security concerns
- Technological advancements
- Increasing demand from emerging economies
Challenges and Restraints in Optical Sorter Market
- High cost of optical sorters
- Competition from manual sorting
- Regulations and compliance requirements
- Limited availability of skilled labor
Emerging Trends in Optical Sorter Market
- Integration with advanced sensing technologies
- Development of high-speed and high-resolution sorters
- Adoption of cloud-based sorting systems
- Rise of predictive maintenance and remote monitoring
Optical Sorter Industry News
- Buhler Group acquires Sortex Ltd. to strengthen its optical sorting capabilities
- Tomra Systems introduces new generation of high-speed sorters for recycling applications
- Key Technology launches NIR-based optical sorter for precision sorting of grains and seeds
Leading Players in the Optical Sorter Market
- Allgaier Werke GmbH
- Binder + Co AG
- Buhler AG
- A/S Cimbria
- CP Manufacturing, Inc.
- Greefa Italia GmbH
- Key Technology, Inc.
- National Recovery Technologies LLC
- Newtec A/S
- Pellenc ST
- Raytec Vision SpA
- Satake Corporation
- Sesotec GmbH
- Steinert GmbH
- Tomra Systems ASA
Optical Sorter Market Segmentation
- 1. Product
- 1.1. Lasers
- 1.2. Cameras
- 1.3. NIR sorters
- 1.4. Hyperspectral cameras
- 2. Platform
- 2.1. Belt
- 2.2. Freefall
- 2.3. Lane
- 2.4. Hybrid
- 3. Application
- 3.1. Recycling
- 3.2. Mining
- 3.3. Food
- 3.4. Others
Optical Sorter Market Segmentation By Geography
- 1. North America
- 1.1. U.S.
- 1.2. Canada
- 2. Europe
- 2.1. UK
- 2.2. Germany
- 2.3. France
- 2.4. Italy
- 2.5. Spain
- 3. Asia Pacific
- 3.1. China
- 3.2. India
- 3.3. Japan
- 3.4. South Korea
- 3.5. Taiwan
- 3.6. Australia
- 4. Latin America
- 4.1. Brazil
- 4.2. Mexico
- 5. Middle East & Africa (MEA)
- 5.1. Saudi Arabia
- 5.2. UAE
- 5.3. South Africa

Optical Sorter Market REPORT HIGHLIGHTS
| Aspects | Details |
|---|---|
| Study Period | 2019-2033 |
| Base Year | 2024 |
| Estimated Year | 2025 |
| Forecast Period | 2025-2033 |
| Historical Period | 2019-2024 |
| Growth Rate | CAGR of 9% from 2019-2033 |
| Segmentation |
|
- 1. Introduction
- 1.1. Research Scope
- 1.2. Market Segmentation
- 1.3. Research Methodology
- 1.4. Definitions and Assumptions
- 2. Executive Summary
- 2.1. Introduction
- 3. Market Dynamics
- 3.1. Introduction
- 3.2. Market Drivers
- 3.2.1 High demand for optical sorters from the U.S and European food industry
- 3.2.2 Presence of stringent regulations for food safety in Europe
- 3.2.3 Rising cost of labor in Europe and Asia Pacific
- 3.2.4 Rising adoption of digital sorting technologies in China and Japan
- 3.2.5 Adoption of the technology in waste recycling plants in Latin America and MEA
- 3.3. Market Restrains
- 3.3.1 High initial capital investment and maintenance costs
- 3.3.2 Difficulties in sorting plastic waste
- 3.4. Market Trends
- 3.4.1 Key market trends include the growing demand for high-speed and high-resolution sorters
- 3.4.2 the increasing adoption of integrated optical sorter systems
- 3.4.3 and the emergence of new applications in industries such as mining and recycling. The market is also witnessing the rise of predictive maintenance and remote monitoring technologies
- 3.4.4 enabling predictive maintenance and proactive problem-solving.
- 4. Market Factor Analysis
- 4.1. Porters Five Forces
- 4.2. Supply/Value Chain
- 4.3. PESTEL analysis
- 4.4. Market Entropy
- 4.5. Patent/Trademark Analysis
- 5. Global Optical Sorter Market Analysis, Insights and Forecast, 2019-2031
- 5.1. Market Analysis, Insights and Forecast - by Product
- 5.1.1. Lasers
- 5.1.2. Cameras
- 5.1.3. NIR sorters
- 5.1.4. Hyperspectral cameras
- 5.2. Market Analysis, Insights and Forecast - by Platform
- 5.2.1. Belt
- 5.2.2. Freefall
- 5.2.3. Lane
- 5.2.4. Hybrid
- 5.3. Market Analysis, Insights and Forecast - by Application
- 5.3.1. Recycling
- 5.3.2. Mining
- 5.3.3. Food
- 5.3.4. Others
- 5.4. Market Analysis, Insights and Forecast - by Region
- 5.4.1. North America
- 5.4.2. Europe
- 5.4.3. Asia Pacific
- 5.4.4. Latin America
- 5.4.5. Middle East & Africa (MEA)
- 5.1. Market Analysis, Insights and Forecast - by Product
- 6. North America Optical Sorter Market Analysis, Insights and Forecast, 2019-2031
- 6.1. Market Analysis, Insights and Forecast - by Product
- 6.1.1. Lasers
- 6.1.2. Cameras
- 6.1.3. NIR sorters
- 6.1.4. Hyperspectral cameras
- 6.2. Market Analysis, Insights and Forecast - by Platform
- 6.2.1. Belt
- 6.2.2. Freefall
- 6.2.3. Lane
- 6.2.4. Hybrid
- 6.3. Market Analysis, Insights and Forecast - by Application
- 6.3.1. Recycling
- 6.3.2. Mining
- 6.3.3. Food
- 6.3.4. Others
- 6.1. Market Analysis, Insights and Forecast - by Product
- 7. Europe Optical Sorter Market Analysis, Insights and Forecast, 2019-2031
- 7.1. Market Analysis, Insights and Forecast - by Product
- 7.1.1. Lasers
- 7.1.2. Cameras
- 7.1.3. NIR sorters
- 7.1.4. Hyperspectral cameras
- 7.2. Market Analysis, Insights and Forecast - by Platform
- 7.2.1. Belt
- 7.2.2. Freefall
- 7.2.3. Lane
- 7.2.4. Hybrid
- 7.3. Market Analysis, Insights and Forecast - by Application
- 7.3.1. Recycling
- 7.3.2. Mining
- 7.3.3. Food
- 7.3.4. Others
- 7.1. Market Analysis, Insights and Forecast - by Product
- 8. Asia Pacific Optical Sorter Market Analysis, Insights and Forecast, 2019-2031
- 8.1. Market Analysis, Insights and Forecast - by Product
- 8.1.1. Lasers
- 8.1.2. Cameras
- 8.1.3. NIR sorters
- 8.1.4. Hyperspectral cameras
- 8.2. Market Analysis, Insights and Forecast - by Platform
- 8.2.1. Belt
- 8.2.2. Freefall
- 8.2.3. Lane
- 8.2.4. Hybrid
- 8.3. Market Analysis, Insights and Forecast - by Application
- 8.3.1. Recycling
- 8.3.2. Mining
- 8.3.3. Food
- 8.3.4. Others
- 8.1. Market Analysis, Insights and Forecast - by Product
- 9. Latin America Optical Sorter Market Analysis, Insights and Forecast, 2019-2031
- 9.1. Market Analysis, Insights and Forecast - by Product
- 9.1.1. Lasers
- 9.1.2. Cameras
- 9.1.3. NIR sorters
- 9.1.4. Hyperspectral cameras
- 9.2. Market Analysis, Insights and Forecast - by Platform
- 9.2.1. Belt
- 9.2.2. Freefall
- 9.2.3. Lane
- 9.2.4. Hybrid
- 9.3. Market Analysis, Insights and Forecast - by Application
- 9.3.1. Recycling
- 9.3.2. Mining
- 9.3.3. Food
- 9.3.4. Others
- 9.1. Market Analysis, Insights and Forecast - by Product
- 10. Middle East & Africa (MEA) Optical Sorter Market Analysis, Insights and Forecast, 2019-2031
- 10.1. Market Analysis, Insights and Forecast - by Product
- 10.1.1. Lasers
- 10.1.2. Cameras
- 10.1.3. NIR sorters
- 10.1.4. Hyperspectral cameras
- 10.2. Market Analysis, Insights and Forecast - by Platform
- 10.2.1. Belt
- 10.2.2. Freefall
- 10.2.3. Lane
- 10.2.4. Hybrid
- 10.3. Market Analysis, Insights and Forecast - by Application
- 10.3.1. Recycling
- 10.3.2. Mining
- 10.3.3. Food
- 10.3.4. Others
- 10.1. Market Analysis, Insights and Forecast - by Product
- 11. Competitive Analysis
- 11.1. Global Market Share Analysis 2024
- 11.2. Company Profiles
- 11.2.1 Allgaier Werke GmbH
- 11.2.1.1. Overview
- 11.2.1.2. Products
- 11.2.1.3. SWOT Analysis
- 11.2.1.4. Recent Developments
- 11.2.1.5. Financials (Based on Availability)
- 11.2.2 Binder + Co AG
- 11.2.2.1. Overview
- 11.2.2.2. Products
- 11.2.2.3. SWOT Analysis
- 11.2.2.4. Recent Developments
- 11.2.2.5. Financials (Based on Availability)
- 11.2.3 Buhler AG
- 11.2.3.1. Overview
- 11.2.3.2. Products
- 11.2.3.3. SWOT Analysis
- 11.2.3.4. Recent Developments
- 11.2.3.5. Financials (Based on Availability)
- 11.2.4 A/S Cimbria
- 11.2.4.1. Overview
- 11.2.4.2. Products
- 11.2.4.3. SWOT Analysis
- 11.2.4.4. Recent Developments
- 11.2.4.5. Financials (Based on Availability)
- 11.2.5 CP Manufacturing Inc.
- 11.2.5.1. Overview
- 11.2.5.2. Products
- 11.2.5.3. SWOT Analysis
- 11.2.5.4. Recent Developments
- 11.2.5.5. Financials (Based on Availability)
- 11.2.6 Greefa Italia GmbH
- 11.2.6.1. Overview
- 11.2.6.2. Products
- 11.2.6.3. SWOT Analysis
- 11.2.6.4. Recent Developments
- 11.2.6.5. Financials (Based on Availability)
- 11.2.7 Key Technology Inc.
- 11.2.7.1. Overview
- 11.2.7.2. Products
- 11.2.7.3. SWOT Analysis
- 11.2.7.4. Recent Developments
- 11.2.7.5. Financials (Based on Availability)
- 11.2.8 National Recovery Technologies LLC
- 11.2.8.1. Overview
- 11.2.8.2. Products
- 11.2.8.3. SWOT Analysis
- 11.2.8.4. Recent Developments
- 11.2.8.5. Financials (Based on Availability)
- 11.2.9 Newtec A/S
- 11.2.9.1. Overview
- 11.2.9.2. Products
- 11.2.9.3. SWOT Analysis
- 11.2.9.4. Recent Developments
- 11.2.9.5. Financials (Based on Availability)
- 11.2.10 Pellenc ST
- 11.2.10.1. Overview
- 11.2.10.2. Products
- 11.2.10.3. SWOT Analysis
- 11.2.10.4. Recent Developments
- 11.2.10.5. Financials (Based on Availability)
- 11.2.11 Raytec Vision SpA.
- 11.2.11.1. Overview
- 11.2.11.2. Products
- 11.2.11.3. SWOT Analysis
- 11.2.11.4. Recent Developments
- 11.2.11.5. Financials (Based on Availability)
- 11.2.12 Satake Corporation
- 11.2.12.1. Overview
- 11.2.12.2. Products
- 11.2.12.3. SWOT Analysis
- 11.2.12.4. Recent Developments
- 11.2.12.5. Financials (Based on Availability)
- 11.2.13 Sesotec GmbH
- 11.2.13.1. Overview
- 11.2.13.2. Products
- 11.2.13.3. SWOT Analysis
- 11.2.13.4. Recent Developments
- 11.2.13.5. Financials (Based on Availability)
- 11.2.14 Steinert GmbH
- 11.2.14.1. Overview
- 11.2.14.2. Products
- 11.2.14.3. SWOT Analysis
- 11.2.14.4. Recent Developments
- 11.2.14.5. Financials (Based on Availability)
- 11.2.15 Tomra Systems ASA
- 11.2.15.1. Overview
- 11.2.15.2. Products
- 11.2.15.3. SWOT Analysis
- 11.2.15.4. Recent Developments
- 11.2.15.5. Financials (Based on Availability)
- 11.2.1 Allgaier Werke GmbH
- Figure 1: Global Optical Sorter Market Revenue Breakdown (Billion, %) by Region 2024 & 2032
- Figure 2: Global Optical Sorter Market Volume Breakdown (units, %) by Region 2024 & 2032
- Figure 3: North America Optical Sorter Market Revenue (Billion), by Product 2024 & 2032
- Figure 4: North America Optical Sorter Market Volume (units), by Product 2024 & 2032
- Figure 5: North America Optical Sorter Market Revenue Share (%), by Product 2024 & 2032
- Figure 6: North America Optical Sorter Market Volume Share (%), by Product 2024 & 2032
- Figure 7: North America Optical Sorter Market Revenue (Billion), by Platform 2024 & 2032
- Figure 8: North America Optical Sorter Market Volume (units), by Platform 2024 & 2032
- Figure 9: North America Optical Sorter Market Revenue Share (%), by Platform 2024 & 2032
- Figure 10: North America Optical Sorter Market Volume Share (%), by Platform 2024 & 2032
- Figure 11: North America Optical Sorter Market Revenue (Billion), by Application 2024 & 2032
- Figure 12: North America Optical Sorter Market Volume (units), by Application 2024 & 2032
- Figure 13: North America Optical Sorter Market Revenue Share (%), by Application 2024 & 2032
- Figure 14: North America Optical Sorter Market Volume Share (%), by Application 2024 & 2032
- Figure 15: North America Optical Sorter Market Revenue (Billion), by Country 2024 & 2032
- Figure 16: North America Optical Sorter Market Volume (units), by Country 2024 & 2032
- Figure 17: North America Optical Sorter Market Revenue Share (%), by Country 2024 & 2032
- Figure 18: North America Optical Sorter Market Volume Share (%), by Country 2024 & 2032
- Figure 19: Europe Optical Sorter Market Revenue (Billion), by Product 2024 & 2032
- Figure 20: Europe Optical Sorter Market Volume (units), by Product 2024 & 2032
- Figure 21: Europe Optical Sorter Market Revenue Share (%), by Product 2024 & 2032
- Figure 22: Europe Optical Sorter Market Volume Share (%), by Product 2024 & 2032
- Figure 23: Europe Optical Sorter Market Revenue (Billion), by Platform 2024 & 2032
- Figure 24: Europe Optical Sorter Market Volume (units), by Platform 2024 & 2032
- Figure 25: Europe Optical Sorter Market Revenue Share (%), by Platform 2024 & 2032
- Figure 26: Europe Optical Sorter Market Volume Share (%), by Platform 2024 & 2032
- Figure 27: Europe Optical Sorter Market Revenue (Billion), by Application 2024 & 2032
- Figure 28: Europe Optical Sorter Market Volume (units), by Application 2024 & 2032
- Figure 29: Europe Optical Sorter Market Revenue Share (%), by Application 2024 & 2032
- Figure 30: Europe Optical Sorter Market Volume Share (%), by Application 2024 & 2032
- Figure 31: Europe Optical Sorter Market Revenue (Billion), by Country 2024 & 2032
- Figure 32: Europe Optical Sorter Market Volume (units), by Country 2024 & 2032
- Figure 33: Europe Optical Sorter Market Revenue Share (%), by Country 2024 & 2032
- Figure 34: Europe Optical Sorter Market Volume Share (%), by Country 2024 & 2032
- Figure 35: Asia Pacific Optical Sorter Market Revenue (Billion), by Product 2024 & 2032
- Figure 36: Asia Pacific Optical Sorter Market Volume (units), by Product 2024 & 2032
- Figure 37: Asia Pacific Optical Sorter Market Revenue Share (%), by Product 2024 & 2032
- Figure 38: Asia Pacific Optical Sorter Market Volume Share (%), by Product 2024 & 2032
- Figure 39: Asia Pacific Optical Sorter Market Revenue (Billion), by Platform 2024 & 2032
- Figure 40: Asia Pacific Optical Sorter Market Volume (units), by Platform 2024 & 2032
- Figure 41: Asia Pacific Optical Sorter Market Revenue Share (%), by Platform 2024 & 2032
- Figure 42: Asia Pacific Optical Sorter Market Volume Share (%), by Platform 2024 & 2032
- Figure 43: Asia Pacific Optical Sorter Market Revenue (Billion), by Application 2024 & 2032
- Figure 44: Asia Pacific Optical Sorter Market Volume (units), by Application 2024 & 2032
- Figure 45: Asia Pacific Optical Sorter Market Revenue Share (%), by Application 2024 & 2032
- Figure 46: Asia Pacific Optical Sorter Market Volume Share (%), by Application 2024 & 2032
- Figure 47: Asia Pacific Optical Sorter Market Revenue (Billion), by Country 2024 & 2032
- Figure 48: Asia Pacific Optical Sorter Market Volume (units), by Country 2024 & 2032
- Figure 49: Asia Pacific Optical Sorter Market Revenue Share (%), by Country 2024 & 2032
- Figure 50: Asia Pacific Optical Sorter Market Volume Share (%), by Country 2024 & 2032
- Figure 51: Latin America Optical Sorter Market Revenue (Billion), by Product 2024 & 2032
- Figure 52: Latin America Optical Sorter Market Volume (units), by Product 2024 & 2032
- Figure 53: Latin America Optical Sorter Market Revenue Share (%), by Product 2024 & 2032
- Figure 54: Latin America Optical Sorter Market Volume Share (%), by Product 2024 & 2032
- Figure 55: Latin America Optical Sorter Market Revenue (Billion), by Platform 2024 & 2032
- Figure 56: Latin America Optical Sorter Market Volume (units), by Platform 2024 & 2032
- Figure 57: Latin America Optical Sorter Market Revenue Share (%), by Platform 2024 & 2032
- Figure 58: Latin America Optical Sorter Market Volume Share (%), by Platform 2024 & 2032
- Figure 59: Latin America Optical Sorter Market Revenue (Billion), by Application 2024 & 2032
- Figure 60: Latin America Optical Sorter Market Volume (units), by Application 2024 & 2032
- Figure 61: Latin America Optical Sorter Market Revenue Share (%), by Application 2024 & 2032
- Figure 62: Latin America Optical Sorter Market Volume Share (%), by Application 2024 & 2032
- Figure 63: Latin America Optical Sorter Market Revenue (Billion), by Country 2024 & 2032
- Figure 64: Latin America Optical Sorter Market Volume (units), by Country 2024 & 2032
- Figure 65: Latin America Optical Sorter Market Revenue Share (%), by Country 2024 & 2032
- Figure 66: Latin America Optical Sorter Market Volume Share (%), by Country 2024 & 2032
- Figure 67: Middle East & Africa (MEA) Optical Sorter Market Revenue (Billion), by Product 2024 & 2032
- Figure 68: Middle East & Africa (MEA) Optical Sorter Market Volume (units), by Product 2024 & 2032
- Figure 69: Middle East & Africa (MEA) Optical Sorter Market Revenue Share (%), by Product 2024 & 2032
- Figure 70: Middle East & Africa (MEA) Optical Sorter Market Volume Share (%), by Product 2024 & 2032
- Figure 71: Middle East & Africa (MEA) Optical Sorter Market Revenue (Billion), by Platform 2024 & 2032
- Figure 72: Middle East & Africa (MEA) Optical Sorter Market Volume (units), by Platform 2024 & 2032
- Figure 73: Middle East & Africa (MEA) Optical Sorter Market Revenue Share (%), by Platform 2024 & 2032
- Figure 74: Middle East & Africa (MEA) Optical Sorter Market Volume Share (%), by Platform 2024 & 2032
- Figure 75: Middle East & Africa (MEA) Optical Sorter Market Revenue (Billion), by Application 2024 & 2032
- Figure 76: Middle East & Africa (MEA) Optical Sorter Market Volume (units), by Application 2024 & 2032
- Figure 77: Middle East & Africa (MEA) Optical Sorter Market Revenue Share (%), by Application 2024 & 2032
- Figure 78: Middle East & Africa (MEA) Optical Sorter Market Volume Share (%), by Application 2024 & 2032
- Figure 79: Middle East & Africa (MEA) Optical Sorter Market Revenue (Billion), by Country 2024 & 2032
- Figure 80: Middle East & Africa (MEA) Optical Sorter Market Volume (units), by Country 2024 & 2032
- Figure 81: Middle East & Africa (MEA) Optical Sorter Market Revenue Share (%), by Country 2024 & 2032
- Figure 82: Middle East & Africa (MEA) Optical Sorter Market Volume Share (%), by Country 2024 & 2032
- Table 1: Global Optical Sorter Market Revenue Billion Forecast, by Region 2019 & 2032
- Table 2: Global Optical Sorter Market Volume units Forecast, by Region 2019 & 2032
- Table 3: Global Optical Sorter Market Revenue Billion Forecast, by Product 2019 & 2032
- Table 4: Global Optical Sorter Market Volume units Forecast, by Product 2019 & 2032
- Table 5: Global Optical Sorter Market Revenue Billion Forecast, by Platform 2019 & 2032
- Table 6: Global Optical Sorter Market Volume units Forecast, by Platform 2019 & 2032
- Table 7: Global Optical Sorter Market Revenue Billion Forecast, by Application 2019 & 2032
- Table 8: Global Optical Sorter Market Volume units Forecast, by Application 2019 & 2032
- Table 9: Global Optical Sorter Market Revenue Billion Forecast, by Region 2019 & 2032
- Table 10: Global Optical Sorter Market Volume units Forecast, by Region 2019 & 2032
- Table 11: Global Optical Sorter Market Revenue Billion Forecast, by Product 2019 & 2032
- Table 12: Global Optical Sorter Market Volume units Forecast, by Product 2019 & 2032
- Table 13: Global Optical Sorter Market Revenue Billion Forecast, by Platform 2019 & 2032
- Table 14: Global Optical Sorter Market Volume units Forecast, by Platform 2019 & 2032
- Table 15: Global Optical Sorter Market Revenue Billion Forecast, by Application 2019 & 2032
- Table 16: Global Optical Sorter Market Volume units Forecast, by Application 2019 & 2032
- Table 17: Global Optical Sorter Market Revenue Billion Forecast, by Country 2019 & 2032
- Table 18: Global Optical Sorter Market Volume units Forecast, by Country 2019 & 2032
- Table 19: U.S. Optical Sorter Market Revenue (Billion) Forecast, by Application 2019 & 2032
- Table 20: U.S. Optical Sorter Market Volume (units) Forecast, by Application 2019 & 2032
- Table 21: Canada Optical Sorter Market Revenue (Billion) Forecast, by Application 2019 & 2032
- Table 22: Canada Optical Sorter Market Volume (units) Forecast, by Application 2019 & 2032
- Table 23: Global Optical Sorter Market Revenue Billion Forecast, by Product 2019 & 2032
- Table 24: Global Optical Sorter Market Volume units Forecast, by Product 2019 & 2032
- Table 25: Global Optical Sorter Market Revenue Billion Forecast, by Platform 2019 & 2032
- Table 26: Global Optical Sorter Market Volume units Forecast, by Platform 2019 & 2032
- Table 27: Global Optical Sorter Market Revenue Billion Forecast, by Application 2019 & 2032
- Table 28: Global Optical Sorter Market Volume units Forecast, by Application 2019 & 2032
- Table 29: Global Optical Sorter Market Revenue Billion Forecast, by Country 2019 & 2032
- Table 30: Global Optical Sorter Market Volume units Forecast, by Country 2019 & 2032
- Table 31: UK Optical Sorter Market Revenue (Billion) Forecast, by Application 2019 & 2032
- Table 32: UK Optical Sorter Market Volume (units) Forecast, by Application 2019 & 2032
- Table 33: Germany Optical Sorter Market Revenue (Billion) Forecast, by Application 2019 & 2032
- Table 34: Germany Optical Sorter Market Volume (units) Forecast, by Application 2019 & 2032
- Table 35: France Optical Sorter Market Revenue (Billion) Forecast, by Application 2019 & 2032
- Table 36: France Optical Sorter Market Volume (units) Forecast, by Application 2019 & 2032
- Table 37: Italy Optical Sorter Market Revenue (Billion) Forecast, by Application 2019 & 2032
- Table 38: Italy Optical Sorter Market Volume (units) Forecast, by Application 2019 & 2032
- Table 39: Spain Optical Sorter Market Revenue (Billion) Forecast, by Application 2019 & 2032
- Table 40: Spain Optical Sorter Market Volume (units) Forecast, by Application 2019 & 2032
- Table 41: Global Optical Sorter Market Revenue Billion Forecast, by Product 2019 & 2032
- Table 42: Global Optical Sorter Market Volume units Forecast, by Product 2019 & 2032
- Table 43: Global Optical Sorter Market Revenue Billion Forecast, by Platform 2019 & 2032
- Table 44: Global Optical Sorter Market Volume units Forecast, by Platform 2019 & 2032
- Table 45: Global Optical Sorter Market Revenue Billion Forecast, by Application 2019 & 2032
- Table 46: Global Optical Sorter Market Volume units Forecast, by Application 2019 & 2032
- Table 47: Global Optical Sorter Market Revenue Billion Forecast, by Country 2019 & 2032
- Table 48: Global Optical Sorter Market Volume units Forecast, by Country 2019 & 2032
- Table 49: China Optical Sorter Market Revenue (Billion) Forecast, by Application 2019 & 2032
- Table 50: China Optical Sorter Market Volume (units) Forecast, by Application 2019 & 2032
- Table 51: India Optical Sorter Market Revenue (Billion) Forecast, by Application 2019 & 2032
- Table 52: India Optical Sorter Market Volume (units) Forecast, by Application 2019 & 2032
- Table 53: Japan Optical Sorter Market Revenue (Billion) Forecast, by Application 2019 & 2032
- Table 54: Japan Optical Sorter Market Volume (units) Forecast, by Application 2019 & 2032
- Table 55: South Korea Optical Sorter Market Revenue (Billion) Forecast, by Application 2019 & 2032
- Table 56: South Korea Optical Sorter Market Volume (units) Forecast, by Application 2019 & 2032
- Table 57: Taiwan Optical Sorter Market Revenue (Billion) Forecast, by Application 2019 & 2032
- Table 58: Taiwan Optical Sorter Market Volume (units) Forecast, by Application 2019 & 2032
- Table 59: Australia Optical Sorter Market Revenue (Billion) Forecast, by Application 2019 & 2032
- Table 60: Australia Optical Sorter Market Volume (units) Forecast, by Application 2019 & 2032
- Table 61: Global Optical Sorter Market Revenue Billion Forecast, by Product 2019 & 2032
- Table 62: Global Optical Sorter Market Volume units Forecast, by Product 2019 & 2032
- Table 63: Global Optical Sorter Market Revenue Billion Forecast, by Platform 2019 & 2032
- Table 64: Global Optical Sorter Market Volume units Forecast, by Platform 2019 & 2032
- Table 65: Global Optical Sorter Market Revenue Billion Forecast, by Application 2019 & 2032
- Table 66: Global Optical Sorter Market Volume units Forecast, by Application 2019 & 2032
- Table 67: Global Optical Sorter Market Revenue Billion Forecast, by Country 2019 & 2032
- Table 68: Global Optical Sorter Market Volume units Forecast, by Country 2019 & 2032
- Table 69: Brazil Optical Sorter Market Revenue (Billion) Forecast, by Application 2019 & 2032
- Table 70: Brazil Optical Sorter Market Volume (units) Forecast, by Application 2019 & 2032
- Table 71: Mexico Optical Sorter Market Revenue (Billion) Forecast, by Application 2019 & 2032
- Table 72: Mexico Optical Sorter Market Volume (units) Forecast, by Application 2019 & 2032
- Table 73: Global Optical Sorter Market Revenue Billion Forecast, by Product 2019 & 2032
- Table 74: Global Optical Sorter Market Volume units Forecast, by Product 2019 & 2032
- Table 75: Global Optical Sorter Market Revenue Billion Forecast, by Platform 2019 & 2032
- Table 76: Global Optical Sorter Market Volume units Forecast, by Platform 2019 & 2032
- Table 77: Global Optical Sorter Market Revenue Billion Forecast, by Application 2019 & 2032
- Table 78: Global Optical Sorter Market Volume units Forecast, by Application 2019 & 2032
- Table 79: Global Optical Sorter Market Revenue Billion Forecast, by Country 2019 & 2032
- Table 80: Global Optical Sorter Market Volume units Forecast, by Country 2019 & 2032
- Table 81: Saudi Arabia Optical Sorter Market Revenue (Billion) Forecast, by Application 2019 & 2032
- Table 82: Saudi Arabia Optical Sorter Market Volume (units) Forecast, by Application 2019 & 2032
- Table 83: UAE Optical Sorter Market Revenue (Billion) Forecast, by Application 2019 & 2032
- Table 84: UAE Optical Sorter Market Volume (units) Forecast, by Application 2019 & 2032
- Table 85: South Africa Optical Sorter Market Revenue (Billion) Forecast, by Application 2019 & 2032
- Table 86: South Africa Optical Sorter Market Volume (units) Forecast, by Application 2019 & 2032
STEP 1 - Identification of Relevant Samples Size from Population Database


STEP 2 - Approaches for Defining Global Market Size (Value, Volume* & Price*)

Note* : In applicable scenarios
STEP 3 - Data Sources
Primary Research
- Web Analytics
- Survey Reports
- Research Institute
- Latest Research Reports
- Opinion Leaders
Secondary Research
- Annual Reports
- White Paper
- Latest Press Release
- Industry Association
- Paid Database
- Investor Presentations

STEP 4 - Data Triangulation
Involves using different sources of information in order to increase the validity of a study
These sources are likely to be stakeholders in a program - participants, other researchers, program staff, other community members, and so on.
Then we put all data in single framework & apply various statistical tools to find out the dynamic on the market.
During the analysis stage, feedback from the stakeholder groups would be compared to determine areas of agreement as well as areas of divergence
Frequently Asked Questions
Related Reports
See the similar reports


About Market Insights Report
Market Insights Reports offers comprehensive market research reports and analysis, giving businesses important information about their clients, rivals, and sector to help them make well-informed decisions on operations, marketing, and business strategy. We offer a variety of services in addition to market research, data analysis, and strategy planning. In order to find opportunities and learn more about our competitors and the industry at large, we employ competitive analysis. To identify areas for development, we also evaluate our performance against that of our rivals. We can determine the places at which we can offer our clients the most value by performing value chain analysis.
Additionally, clients receive a thorough overview of their industry business environment. We can find trends that help us forecast future possibilities and threats by examining global macroeconomic dynamics and consumer behavior patterns. By analyzing their features and advantages, contrasting them with comparable items on the market, and evaluating both their quantitative and qualitative performance, we comprehensively evaluate our clients' products. This allows us to assist customers in determining how their goods compare to those of their rivals and in creating successful marketing plans. Our group has been successful in gaining a thorough grasp of our clients' requirements and offering them creative solutions. We currently provide services to more than 50 nations in Europe, the Middle East, Africa, Latin America, Asia Pacific, and North America. Because of our global reach, we have been able to establish trusting bonds with our partners and clients in various nations, improving customer service and forging a more cohesive worldwide presence.