
.jpg&w=3840&q=100)
Market
Insights
Reports delivered globally, covering a wide range of industries and sectors.
Clients who trust our expertise and rely on our insights for business decisions.
Managed Reports, ensuring seamless updates and premium service.
Satisfied Customers, committed to delivering exceptional value and quality.
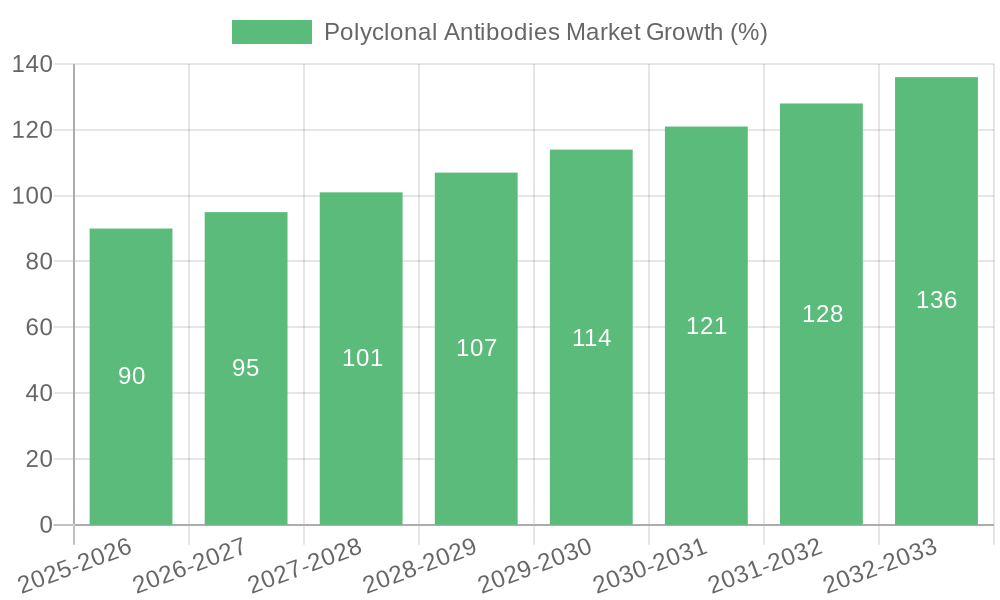
Polyclonal Antibodies Market 2025-2033 Trends: Unveiling Growth Opportunities and Competitor Dynamics
Polyclonal Antibodies Market by Based on route of administration, the polyclonal antibodies market is classified into intravenous (IV), subcutaneous (SC), and other routes of administration. The intravenous (IV) segment is expected to exhibit CAGR of 5.3% by 2032. (The popularity of intravenous administration in clinical settings, along with its convenience and established safety profile, consolidates its dominance in the market Intravenous (IV), route is preferred for several polyclonal antibody-based treatments as it allows precise dosing control and immediate systemic distribution. According to a study published in NCBI, approximately 70% of the antibodies are administered via intravenous (IV) injection, enabling rapid systemic drug delivery. And maximizing their bioavailability.), by Product, 2018 – 2032 (USD Million) (Primary antibodies, Secondary antibodies), by Application, 2018 – 2032 (USD Million) (Diagnostics, Therapeutics, Research), by Route of Administration, 2018 – 2032 (USD Million) (Intravenous (IV), Subcutaneous (SC), Other routes of administration), by Source, 2018 – 2032 (USD Million) (Rabbit Polyclonal Antibodies, Goat Polyclonal Antibodies, Mouse Polyclonal Antibodies, Human, Other sources), by End-user, 2018 – 2032 (USD Million) (Pharmaceutical and Biotechnology Companies, Academic and Research Institutes, Contract Research Organizations (CROs), Diagnostic Laboratories, Other end-users), by North America (U.S., Canada), by Europe (Germany, UK, France, Spain, Italy, Rest of Europe), by Asia Pacific (China, Japan, India, Australia, Rest of Asia Pacific), by Latin America (Brazil, Mexico, Rest of Latin America), by Middle East & Africa (South Africa, Saudi Arabia, Rest of Middle East & Africa) Forecast 2025-2033
Polyclonal Antibodies Market 2025-2033 Trends: Unveiling Growth Opportunities and Competitor Dynamics
Key Insights
The global polyclonal antibodies market, valued at $1.5 billion in 2025, is projected to experience robust growth, exhibiting a compound annual growth rate (CAGR) of 5.9% from 2025 to 2033. This expansion is driven by several key factors. The increasing prevalence of chronic diseases necessitating advanced therapeutic interventions fuels demand for polyclonal antibodies in diagnostics and therapeutics. Furthermore, ongoing research and development efforts are yielding innovative applications in various fields, expanding the market's scope. The intravenous (IV) route of administration currently dominates, accounting for approximately 70% of the market share due to its proven efficacy in delivering precise dosages and achieving rapid systemic distribution. However, the subcutaneous (SC) route is expected to witness significant growth driven by the increasing preference for convenient, at-home administration. Key market segments include primary and secondary antibodies, with applications spanning diagnostics, therapeutics, and research. Leading players such as Thermo Fisher Scientific, Roche, and Merck are driving innovation and expanding market access through strategic partnerships and technological advancements. Geographic expansion, particularly in emerging economies, is also anticipated to contribute to the market's overall growth.
The market segmentation reveals a diverse landscape. Rabbit, goat, and mouse polyclonal antibodies represent major sources, while pharmaceutical and biotechnology companies constitute a significant portion of the end-user segment. Growth in the research sector, driven by academic institutions and contract research organizations (CROs), is further fueling demand. While regulatory hurdles and potential side effects pose certain restraints, ongoing technological advancements focused on improved safety profiles and efficacy are mitigating these challenges. North America currently holds a substantial market share, fueled by robust research infrastructure and high healthcare spending, but Asia Pacific is projected to show substantial growth in the coming years driven by expanding healthcare infrastructure and increasing awareness of advanced therapies. The continuous development of novel polyclonal antibody-based therapies across various disease areas will ensure sustained market growth over the forecast period.

Polyclonal Antibodies Market Concentration & Characteristics
The global polyclonal antibodies market is moderately concentrated, with several large players holding significant market share, but also featuring a substantial number of smaller, specialized companies. Thermo Fisher Scientific, Roche, Merck KGaA, and Abcam are among the leading players, benefiting from established distribution networks and extensive product portfolios. However, the market displays a high degree of innovation, particularly in the development of novel antibody sources, improved purification techniques, and applications in emerging therapeutic areas. This drives a dynamic competitive landscape with frequent product launches and collaborations.
- Concentration Areas: North America and Europe currently dominate the market, due to high research spending and the presence of major pharmaceutical and biotechnology companies. However, Asia-Pacific is exhibiting rapid growth driven by increasing healthcare investments.
- Characteristics of Innovation: The market is characterized by continuous innovation in antibody engineering, including advancements in antibody conjugation, novel antigen delivery systems, and the development of antibodies targeting previously intractable targets.
- Impact of Regulations: Stringent regulatory requirements, particularly concerning safety and efficacy for therapeutic applications, influence market dynamics. These regulations are a significant barrier to entry for smaller players, but also help ensure product quality and safety.
- Product Substitutes: Monoclonal antibodies represent the primary substitute, offering enhanced specificity and consistency. However, polyclonal antibodies often maintain a cost advantage, making them attractive for certain research and diagnostic applications.
- End-User Concentration: Pharmaceutical and biotechnology companies are major consumers of polyclonal antibodies for therapeutic development. Academic and research institutions constitute another significant segment, driving demand for research-grade antibodies.
- Level of M&A: The market has witnessed a moderate level of mergers and acquisitions, primarily focused on strengthening product portfolios and expanding geographical reach. This consolidation trend is expected to continue as larger players seek to enhance their market positions.
Polyclonal Antibodies Market Trends
The polyclonal antibodies market is experiencing significant growth, fueled by several key trends. The increasing prevalence of chronic diseases and infectious ailments is driving higher demand for diagnostic tools and therapeutic interventions utilizing polyclonal antibodies. Furthermore, the burgeoning field of immunotherapy and personalized medicine is creating new opportunities for the development and application of polyclonal antibody-based therapeutics. The rising adoption of advanced technologies such as high-throughput screening and next-generation sequencing is accelerating the discovery and development of new antibodies. Simultaneously, the expanding research activities across diverse biological areas are creating a consistent demand for high-quality polyclonal antibodies.
The market is also witnessing a shift towards customized antibody solutions, where manufacturers cater to specific research and development needs. Furthermore, advancements in antibody engineering techniques are improving the efficiency and specificity of polyclonal antibodies, leading to their wider adoption across various fields. A notable trend is the increasing use of automation and sophisticated analytical techniques in antibody production and quality control. This reduces manufacturing costs and enhances the consistency and reliability of polyclonal antibody products. This automation trend reduces human error in critical stages, thus minimizing production and quality variations. The market is also seeing a growing demand for antibodies derived from novel sources, such as camelids, offering unique advantages in terms of specificity and stability. These novel sources broaden the range of possible antibody functionalities and applications. Finally, the rising adoption of contract research organizations (CROs) for antibody development and manufacturing is streamlining the overall process for numerous companies. This increased outsourcing signifies a growing preference for efficient and cost-effective solutions in this field. The global market value is estimated to surpass $6 billion by 2032, reflecting this robust expansion.
Key Region or Country & Segment to Dominate the Market
The intravenous (IV) route of administration segment is projected to dominate the polyclonal antibodies market throughout the forecast period. This dominance stems from several factors:
- Established Efficacy: IV administration is well-established for delivering large molecules like antibodies, ensuring efficient systemic distribution.
- Precise Dosing Control: IV delivery allows for precise control of dosage, crucial for therapeutic applications. This precise control is critical to maintaining therapeutic efficacy while minimizing side effects.
- Rapid Bioavailability: IV administration achieves rapid systemic drug delivery, enabling prompt therapeutic responses. This rapid response is particularly important in emergency or critical care scenarios.
- Established Clinical Infrastructure: Existing clinical infrastructure is well-equipped to handle IV administrations, making it a convenient and readily available option.
- High Market Penetration: Approximately 70% of antibody administrations are currently via IV, solidifying its substantial market presence and suggesting continued growth in the foreseeable future. This high penetration rate indicates a strong and stable foundation for continued market expansion.
While subcutaneous (SC) administration is gaining traction due to its improved patient convenience, the IV route will likely maintain its dominant position, especially in therapeutic applications requiring immediate and precise control of drug delivery. The market is expected to expand with a CAGR of 5.3% until 2032. The expansion reflects the growing adoption of polyclonal antibody-based treatments, continued improvements in administration technologies, and consistent demand for high-quality products.
Geographical dominance lies with North America, fuelled by substantial R&D investments, a high density of biotechnology and pharmaceutical companies, and well-established healthcare systems. Europe holds a significant share, driven by similar factors, while the Asia-Pacific region is experiencing rapid growth, although currently holding a smaller market share than North America and Europe.
Polyclonal Antibodies Market Product Insights Report Coverage & Deliverables
This report provides a comprehensive analysis of the polyclonal antibodies market, covering market size and growth projections, detailed segmentation by product type (primary and secondary antibodies), application (diagnostics, therapeutics, and research), route of administration (IV, SC, and others), source animal, and end-user. The report also incorporates a competitive landscape analysis highlighting key players, their market share, and recent strategic activities, including mergers and acquisitions and product launches. Finally, it delves into market trends, drivers, challenges, and regional insights to provide a holistic view of this dynamic market.
Polyclonal Antibodies Market Analysis
The global polyclonal antibodies market is projected to reach a substantial valuation, exceeding $5 billion by 2028 and showing continued growth toward a projected $6 billion by 2032. This expansion is driven by the increasing demand across various applications including diagnostics, therapeutics, and research. The market is segmented into several key areas:
- Market Size: The overall market size encompasses both the research and therapeutic sectors, reflecting the multifaceted applications of polyclonal antibodies. Growth is predicted across all major segments, indicating consistent demand across the board.
- Market Share: Leading companies hold significant shares, but the market also houses numerous smaller players specializing in niche applications or antibody sources, contributing to the vibrant and diverse market landscape.
- Growth: The market's growth is consistent across various geographical regions and application areas, fueled by the increasing adoption of advanced technologies, heightened research activities, and the rise of novel antibody sources. Key segments, such as the therapeutic applications of polyclonal antibodies, are expected to witness particularly rapid expansion. The growth is driven by factors such as increased investment in healthcare research, ongoing efforts to develop new treatments for various diseases, and the need for affordable antibody-based diagnostic tools.
Polyclonal Antibodies Market Regional Insights
- North America
- U.S.
- Canada
- Europe
- Germany
- UK
- France
- Spain
- Italy
- Rest of Europe
- Asia Pacific
- China
- Japan
- India
- Australia
- Rest of Asia Pacific
- Latin America
- Brazil
- Mexico
- Rest of Latin America
- Middle East & Africa
- South Africa
- Saudi Arabia
- Rest of Middle East & Africa
Each region's market is influenced by factors such as healthcare infrastructure, regulatory landscape, research funding, and disease prevalence. North America and Europe currently hold the largest market shares due to strong pharmaceutical and biotechnology industries, and higher per capita healthcare spending. However, the Asia Pacific region is projected to exhibit the fastest growth rate due to increasing healthcare investments and growing demand for diagnostics and therapeutics.
Driving Forces: What's Propelling the Polyclonal Antibodies Market
The polyclonal antibodies market is propelled by several factors. The increasing prevalence of chronic and infectious diseases is fueling demand for diagnostic tools and therapeutic agents. Advancements in antibody engineering and production technologies are enhancing antibody efficacy and cost-effectiveness. A rising number of research initiatives are driving demand for research-grade antibodies. Finally, the expanding application of polyclonal antibodies in emerging therapeutic areas is expanding the overall market potential.
Challenges and Restraints in Polyclonal Antibodies Market
Challenges include the inherent batch-to-batch variability associated with polyclonal antibodies, potentially impacting consistency and reproducibility. The rise of monoclonal antibodies, with their superior specificity and consistency, presents competition. Stringent regulatory hurdles and rising production costs are additional constraints that impact market growth.
Emerging Trends in Polyclonal Antibodies Market
Emerging trends include the increasing adoption of novel antibody sources, improving antibody characteristics, and the growing interest in customized antibody solutions tailored to specific research needs. Advanced manufacturing technologies, like automation and high-throughput screening, are enhancing production efficiency. The development of antibody conjugates with improved therapeutic properties is another key trend.
Polyclonal Antibodies Industry News
- April 2022: Aviva Systems Biology launched high-throughput antibody characterization services.
- December 2021: Atlas Antibodies launched 1,200 novel Triple-A Polyclonals.
Leading Players in the Polyclonal Antibodies Market
- Thermo Fisher Scientific Inc.
- F. Hoffmann-La Roche Ltd.
- Merck Group (Merck KGaA)
- Abcam plc
- Bio-Rad Laboratories, Inc.
- GenScript Biotech Corporation
- Cell Signaling Technology, Inc.
- Rockland Immunochemicals Inc.
- BioLegend, Inc.
- Santa Cruz Biotechnology, Inc.
- Antibodies Inc.
- Emergent
Polyclonal Antibodies Market Segmentation
-
1. Based on route of administration, the polyclonal antibodies market is classified into intravenous (IV), subcutaneous (SC), and other routes of administration. The intravenous (IV) segment is expected to exhibit CAGR of 5.3% by 2032.
- 1.1. The popularity of intravenous administration in clinical settings, along with its convenience and established safety profile, consolidates its dominance in the market Intravenous (IV), route is preferred for several polyclonal antibody-based treatments as it allows precise dosing control and immediate systemic distribution. According to a study published in NCBI, approximately 70% of the antibodies are administered via intravenous (IV) injection, enabling rapid systemic drug delivery. And maximizing their bioavailability.
-
2. Product, 2018 – 2032 (USD Million)
- 2.1. Primary antibodies
- 2.2. Secondary antibodies
-
3. Application, 2018 – 2032 (USD Million)
- 3.1. Diagnostics
- 3.2. Therapeutics
- 3.3. Research
-
4. Route of Administration, 2018 – 2032 (USD Million)
- 4.1. Intravenous (IV)
- 4.2. Subcutaneous (SC)
- 4.3. Other routes of administration
-
5. Source, 2018 – 2032 (USD Million)
- 5.1. Rabbit Polyclonal Antibodies
- 5.2. Goat Polyclonal Antibodies
- 5.3. Mouse Polyclonal Antibodies
- 5.4. Human
- 5.5. Other sources
-
6. End-user, 2018 – 2032 (USD Million)
- 6.1. Pharmaceutical and Biotechnology Companies
- 6.2. Academic and Research Institutes
- 6.3. Contract Research Organizations (CROs)
- 6.4. Diagnostic Laboratories
- 6.5. Other end-users
Polyclonal Antibodies Market Segmentation By Geography
-
1. North America
- 1.1. U.S.
- 1.2. Canada
-
2. Europe
- 2.1. Germany
- 2.2. UK
- 2.3. France
- 2.4. Spain
- 2.5. Italy
- 2.6. Rest of Europe
-
3. Asia Pacific
- 3.1. China
- 3.2. Japan
- 3.3. India
- 3.4. Australia
- 3.5. Rest of Asia Pacific
-
4. Latin America
- 4.1. Brazil
- 4.2. Mexico
- 4.3. Rest of Latin America
-
5. Middle East & Africa
- 5.1. South Africa
- 5.2. Saudi Arabia
- 5.3. Rest of Middle East & Africa

Polyclonal Antibodies Market REPORT HIGHLIGHTS
| Aspects | Details |
|---|---|
| Study Period | 2019-2033 |
| Base Year | 2024 |
| Estimated Year | 2025 |
| Forecast Period | 2025-2033 |
| Historical Period | 2019-2024 |
| Growth Rate | CAGR of 5.9% from 2019-2033 |
| Segmentation |
|
- 1. Introduction
- 1.1. Research Scope
- 1.2. Market Segmentation
- 1.3. Research Methodology
- 1.4. Definitions and Assumptions
- 2. Executive Summary
- 2.1. Introduction
- 3. Market Dynamics
- 3.1. Introduction
- 3.2. Market Drivers
- 3.2.1 Increasing prevalence of chronic and infectious diseases
- 3.2.2 Growing demand for personalized medicines
- 3.2.3 Increasing biopharmaceutical R&D activities
- 3.3. Market Restrains
- 3.3.1. Stringency of regulatory procedures
- 3.4. Market Trends
- 4. Market Factor Analysis
- 4.1. Porters Five Forces
- 4.2. Supply/Value Chain
- 4.3. PESTEL analysis
- 4.4. Market Entropy
- 4.5. Patent/Trademark Analysis
- 5. Global Polyclonal Antibodies Market Analysis, Insights and Forecast, 2019-2031
- 5.1. Market Analysis, Insights and Forecast - by Based on route of administration, the polyclonal antibodies market is classified into intravenous (IV), subcutaneous (SC), and other routes of administration. The intravenous (IV) segment is expected to exhibit CAGR of 5.3% by 2032.
- 5.1.1. The popularity of intravenous administration in clinical settings, along with its convenience and established safety profile, consolidates its dominance in the market Intravenous (IV), route is preferred for several polyclonal antibody-based treatments as it allows precise dosing control and immediate systemic distribution. According to a study published in NCBI, approximately 70% of the antibodies are administered via intravenous (IV) injection, enabling rapid systemic drug delivery. And maximizing their bioavailability.
- 5.2. Market Analysis, Insights and Forecast - by Product, 2018 – 2032 (USD Million)
- 5.2.1. Primary antibodies
- 5.2.2. Secondary antibodies
- 5.3. Market Analysis, Insights and Forecast - by Application, 2018 – 2032 (USD Million)
- 5.3.1. Diagnostics
- 5.3.2. Therapeutics
- 5.3.3. Research
- 5.4. Market Analysis, Insights and Forecast - by Route of Administration, 2018 – 2032 (USD Million)
- 5.4.1. Intravenous (IV)
- 5.4.2. Subcutaneous (SC)
- 5.4.3. Other routes of administration
- 5.5. Market Analysis, Insights and Forecast - by Source, 2018 – 2032 (USD Million)
- 5.5.1. Rabbit Polyclonal Antibodies
- 5.5.2. Goat Polyclonal Antibodies
- 5.5.3. Mouse Polyclonal Antibodies
- 5.5.4. Human
- 5.5.5. Other sources
- 5.6. Market Analysis, Insights and Forecast - by End-user, 2018 – 2032 (USD Million)
- 5.6.1. Pharmaceutical and Biotechnology Companies
- 5.6.2. Academic and Research Institutes
- 5.6.3. Contract Research Organizations (CROs)
- 5.6.4. Diagnostic Laboratories
- 5.6.5. Other end-users
- 5.7. Market Analysis, Insights and Forecast - by Region
- 5.7.1. North America
- 5.7.2. Europe
- 5.7.3. Asia Pacific
- 5.7.4. Latin America
- 5.7.5. Middle East & Africa
- 5.1. Market Analysis, Insights and Forecast - by Based on route of administration, the polyclonal antibodies market is classified into intravenous (IV), subcutaneous (SC), and other routes of administration. The intravenous (IV) segment is expected to exhibit CAGR of 5.3% by 2032.
- 6. North America Polyclonal Antibodies Market Analysis, Insights and Forecast, 2019-2031
- 6.1. Market Analysis, Insights and Forecast - by Based on route of administration, the polyclonal antibodies market is classified into intravenous (IV), subcutaneous (SC), and other routes of administration. The intravenous (IV) segment is expected to exhibit CAGR of 5.3% by 2032.
- 6.1.1. The popularity of intravenous administration in clinical settings, along with its convenience and established safety profile, consolidates its dominance in the market Intravenous (IV), route is preferred for several polyclonal antibody-based treatments as it allows precise dosing control and immediate systemic distribution. According to a study published in NCBI, approximately 70% of the antibodies are administered via intravenous (IV) injection, enabling rapid systemic drug delivery. And maximizing their bioavailability.
- 6.2. Market Analysis, Insights and Forecast - by Product, 2018 – 2032 (USD Million)
- 6.2.1. Primary antibodies
- 6.2.2. Secondary antibodies
- 6.3. Market Analysis, Insights and Forecast - by Application, 2018 – 2032 (USD Million)
- 6.3.1. Diagnostics
- 6.3.2. Therapeutics
- 6.3.3. Research
- 6.4. Market Analysis, Insights and Forecast - by Route of Administration, 2018 – 2032 (USD Million)
- 6.4.1. Intravenous (IV)
- 6.4.2. Subcutaneous (SC)
- 6.4.3. Other routes of administration
- 6.5. Market Analysis, Insights and Forecast - by Source, 2018 – 2032 (USD Million)
- 6.5.1. Rabbit Polyclonal Antibodies
- 6.5.2. Goat Polyclonal Antibodies
- 6.5.3. Mouse Polyclonal Antibodies
- 6.5.4. Human
- 6.5.5. Other sources
- 6.6. Market Analysis, Insights and Forecast - by End-user, 2018 – 2032 (USD Million)
- 6.6.1. Pharmaceutical and Biotechnology Companies
- 6.6.2. Academic and Research Institutes
- 6.6.3. Contract Research Organizations (CROs)
- 6.6.4. Diagnostic Laboratories
- 6.6.5. Other end-users
- 6.1. Market Analysis, Insights and Forecast - by Based on route of administration, the polyclonal antibodies market is classified into intravenous (IV), subcutaneous (SC), and other routes of administration. The intravenous (IV) segment is expected to exhibit CAGR of 5.3% by 2032.
- 7. Europe Polyclonal Antibodies Market Analysis, Insights and Forecast, 2019-2031
- 7.1. Market Analysis, Insights and Forecast - by Based on route of administration, the polyclonal antibodies market is classified into intravenous (IV), subcutaneous (SC), and other routes of administration. The intravenous (IV) segment is expected to exhibit CAGR of 5.3% by 2032.
- 7.1.1. The popularity of intravenous administration in clinical settings, along with its convenience and established safety profile, consolidates its dominance in the market Intravenous (IV), route is preferred for several polyclonal antibody-based treatments as it allows precise dosing control and immediate systemic distribution. According to a study published in NCBI, approximately 70% of the antibodies are administered via intravenous (IV) injection, enabling rapid systemic drug delivery. And maximizing their bioavailability.
- 7.2. Market Analysis, Insights and Forecast - by Product, 2018 – 2032 (USD Million)
- 7.2.1. Primary antibodies
- 7.2.2. Secondary antibodies
- 7.3. Market Analysis, Insights and Forecast - by Application, 2018 – 2032 (USD Million)
- 7.3.1. Diagnostics
- 7.3.2. Therapeutics
- 7.3.3. Research
- 7.4. Market Analysis, Insights and Forecast - by Route of Administration, 2018 – 2032 (USD Million)
- 7.4.1. Intravenous (IV)
- 7.4.2. Subcutaneous (SC)
- 7.4.3. Other routes of administration
- 7.5. Market Analysis, Insights and Forecast - by Source, 2018 – 2032 (USD Million)
- 7.5.1. Rabbit Polyclonal Antibodies
- 7.5.2. Goat Polyclonal Antibodies
- 7.5.3. Mouse Polyclonal Antibodies
- 7.5.4. Human
- 7.5.5. Other sources
- 7.6. Market Analysis, Insights and Forecast - by End-user, 2018 – 2032 (USD Million)
- 7.6.1. Pharmaceutical and Biotechnology Companies
- 7.6.2. Academic and Research Institutes
- 7.6.3. Contract Research Organizations (CROs)
- 7.6.4. Diagnostic Laboratories
- 7.6.5. Other end-users
- 7.1. Market Analysis, Insights and Forecast - by Based on route of administration, the polyclonal antibodies market is classified into intravenous (IV), subcutaneous (SC), and other routes of administration. The intravenous (IV) segment is expected to exhibit CAGR of 5.3% by 2032.
- 8. Asia Pacific Polyclonal Antibodies Market Analysis, Insights and Forecast, 2019-2031
- 8.1. Market Analysis, Insights and Forecast - by Based on route of administration, the polyclonal antibodies market is classified into intravenous (IV), subcutaneous (SC), and other routes of administration. The intravenous (IV) segment is expected to exhibit CAGR of 5.3% by 2032.
- 8.1.1. The popularity of intravenous administration in clinical settings, along with its convenience and established safety profile, consolidates its dominance in the market Intravenous (IV), route is preferred for several polyclonal antibody-based treatments as it allows precise dosing control and immediate systemic distribution. According to a study published in NCBI, approximately 70% of the antibodies are administered via intravenous (IV) injection, enabling rapid systemic drug delivery. And maximizing their bioavailability.
- 8.2. Market Analysis, Insights and Forecast - by Product, 2018 – 2032 (USD Million)
- 8.2.1. Primary antibodies
- 8.2.2. Secondary antibodies
- 8.3. Market Analysis, Insights and Forecast - by Application, 2018 – 2032 (USD Million)
- 8.3.1. Diagnostics
- 8.3.2. Therapeutics
- 8.3.3. Research
- 8.4. Market Analysis, Insights and Forecast - by Route of Administration, 2018 – 2032 (USD Million)
- 8.4.1. Intravenous (IV)
- 8.4.2. Subcutaneous (SC)
- 8.4.3. Other routes of administration
- 8.5. Market Analysis, Insights and Forecast - by Source, 2018 – 2032 (USD Million)
- 8.5.1. Rabbit Polyclonal Antibodies
- 8.5.2. Goat Polyclonal Antibodies
- 8.5.3. Mouse Polyclonal Antibodies
- 8.5.4. Human
- 8.5.5. Other sources
- 8.6. Market Analysis, Insights and Forecast - by End-user, 2018 – 2032 (USD Million)
- 8.6.1. Pharmaceutical and Biotechnology Companies
- 8.6.2. Academic and Research Institutes
- 8.6.3. Contract Research Organizations (CROs)
- 8.6.4. Diagnostic Laboratories
- 8.6.5. Other end-users
- 8.1. Market Analysis, Insights and Forecast - by Based on route of administration, the polyclonal antibodies market is classified into intravenous (IV), subcutaneous (SC), and other routes of administration. The intravenous (IV) segment is expected to exhibit CAGR of 5.3% by 2032.
- 9. Latin America Polyclonal Antibodies Market Analysis, Insights and Forecast, 2019-2031
- 9.1. Market Analysis, Insights and Forecast - by Based on route of administration, the polyclonal antibodies market is classified into intravenous (IV), subcutaneous (SC), and other routes of administration. The intravenous (IV) segment is expected to exhibit CAGR of 5.3% by 2032.
- 9.1.1. The popularity of intravenous administration in clinical settings, along with its convenience and established safety profile, consolidates its dominance in the market Intravenous (IV), route is preferred for several polyclonal antibody-based treatments as it allows precise dosing control and immediate systemic distribution. According to a study published in NCBI, approximately 70% of the antibodies are administered via intravenous (IV) injection, enabling rapid systemic drug delivery. And maximizing their bioavailability.
- 9.2. Market Analysis, Insights and Forecast - by Product, 2018 – 2032 (USD Million)
- 9.2.1. Primary antibodies
- 9.2.2. Secondary antibodies
- 9.3. Market Analysis, Insights and Forecast - by Application, 2018 – 2032 (USD Million)
- 9.3.1. Diagnostics
- 9.3.2. Therapeutics
- 9.3.3. Research
- 9.4. Market Analysis, Insights and Forecast - by Route of Administration, 2018 – 2032 (USD Million)
- 9.4.1. Intravenous (IV)
- 9.4.2. Subcutaneous (SC)
- 9.4.3. Other routes of administration
- 9.5. Market Analysis, Insights and Forecast - by Source, 2018 – 2032 (USD Million)
- 9.5.1. Rabbit Polyclonal Antibodies
- 9.5.2. Goat Polyclonal Antibodies
- 9.5.3. Mouse Polyclonal Antibodies
- 9.5.4. Human
- 9.5.5. Other sources
- 9.6. Market Analysis, Insights and Forecast - by End-user, 2018 – 2032 (USD Million)
- 9.6.1. Pharmaceutical and Biotechnology Companies
- 9.6.2. Academic and Research Institutes
- 9.6.3. Contract Research Organizations (CROs)
- 9.6.4. Diagnostic Laboratories
- 9.6.5. Other end-users
- 9.1. Market Analysis, Insights and Forecast - by Based on route of administration, the polyclonal antibodies market is classified into intravenous (IV), subcutaneous (SC), and other routes of administration. The intravenous (IV) segment is expected to exhibit CAGR of 5.3% by 2032.
- 10. Middle East & Africa Polyclonal Antibodies Market Analysis, Insights and Forecast, 2019-2031
- 10.1. Market Analysis, Insights and Forecast - by Based on route of administration, the polyclonal antibodies market is classified into intravenous (IV), subcutaneous (SC), and other routes of administration. The intravenous (IV) segment is expected to exhibit CAGR of 5.3% by 2032.
- 10.1.1. The popularity of intravenous administration in clinical settings, along with its convenience and established safety profile, consolidates its dominance in the market Intravenous (IV), route is preferred for several polyclonal antibody-based treatments as it allows precise dosing control and immediate systemic distribution. According to a study published in NCBI, approximately 70% of the antibodies are administered via intravenous (IV) injection, enabling rapid systemic drug delivery. And maximizing their bioavailability.
- 10.2. Market Analysis, Insights and Forecast - by Product, 2018 – 2032 (USD Million)
- 10.2.1. Primary antibodies
- 10.2.2. Secondary antibodies
- 10.3. Market Analysis, Insights and Forecast - by Application, 2018 – 2032 (USD Million)
- 10.3.1. Diagnostics
- 10.3.2. Therapeutics
- 10.3.3. Research
- 10.4. Market Analysis, Insights and Forecast - by Route of Administration, 2018 – 2032 (USD Million)
- 10.4.1. Intravenous (IV)
- 10.4.2. Subcutaneous (SC)
- 10.4.3. Other routes of administration
- 10.5. Market Analysis, Insights and Forecast - by Source, 2018 – 2032 (USD Million)
- 10.5.1. Rabbit Polyclonal Antibodies
- 10.5.2. Goat Polyclonal Antibodies
- 10.5.3. Mouse Polyclonal Antibodies
- 10.5.4. Human
- 10.5.5. Other sources
- 10.6. Market Analysis, Insights and Forecast - by End-user, 2018 – 2032 (USD Million)
- 10.6.1. Pharmaceutical and Biotechnology Companies
- 10.6.2. Academic and Research Institutes
- 10.6.3. Contract Research Organizations (CROs)
- 10.6.4. Diagnostic Laboratories
- 10.6.5. Other end-users
- 10.1. Market Analysis, Insights and Forecast - by Based on route of administration, the polyclonal antibodies market is classified into intravenous (IV), subcutaneous (SC), and other routes of administration. The intravenous (IV) segment is expected to exhibit CAGR of 5.3% by 2032.
- 11. Competitive Analysis
- 11.1. Global Market Share Analysis 2024
- 11.2. Company Profiles
- 11.2.1 Thermo Fisher Scientific Inc.
- 11.2.1.1. Overview
- 11.2.1.2. Products
- 11.2.1.3. SWOT Analysis
- 11.2.1.4. Recent Developments
- 11.2.1.5. Financials (Based on Availability)
- 11.2.2 F. Hoffmann-La Roche Ltd.
- 11.2.2.1. Overview
- 11.2.2.2. Products
- 11.2.2.3. SWOT Analysis
- 11.2.2.4. Recent Developments
- 11.2.2.5. Financials (Based on Availability)
- 11.2.3 Merck Group (Merck KGaA)
- 11.2.3.1. Overview
- 11.2.3.2. Products
- 11.2.3.3. SWOT Analysis
- 11.2.3.4. Recent Developments
- 11.2.3.5. Financials (Based on Availability)
- 11.2.4 Abcam plc
- 11.2.4.1. Overview
- 11.2.4.2. Products
- 11.2.4.3. SWOT Analysis
- 11.2.4.4. Recent Developments
- 11.2.4.5. Financials (Based on Availability)
- 11.2.5 Bio-Rad Laboratories Inc.
- 11.2.5.1. Overview
- 11.2.5.2. Products
- 11.2.5.3. SWOT Analysis
- 11.2.5.4. Recent Developments
- 11.2.5.5. Financials (Based on Availability)
- 11.2.6 GenScript Biotech Corporation
- 11.2.6.1. Overview
- 11.2.6.2. Products
- 11.2.6.3. SWOT Analysis
- 11.2.6.4. Recent Developments
- 11.2.6.5. Financials (Based on Availability)
- 11.2.7 Cell Signaling Technology Inc.
- 11.2.7.1. Overview
- 11.2.7.2. Products
- 11.2.7.3. SWOT Analysis
- 11.2.7.4. Recent Developments
- 11.2.7.5. Financials (Based on Availability)
- 11.2.8 Rockland Immunochemicals Inc.
- 11.2.8.1. Overview
- 11.2.8.2. Products
- 11.2.8.3. SWOT Analysis
- 11.2.8.4. Recent Developments
- 11.2.8.5. Financials (Based on Availability)
- 11.2.9 BioLegend Inc.
- 11.2.9.1. Overview
- 11.2.9.2. Products
- 11.2.9.3. SWOT Analysis
- 11.2.9.4. Recent Developments
- 11.2.9.5. Financials (Based on Availability)
- 11.2.10 Santa Cruz Biotechnology Inc.
- 11.2.10.1. Overview
- 11.2.10.2. Products
- 11.2.10.3. SWOT Analysis
- 11.2.10.4. Recent Developments
- 11.2.10.5. Financials (Based on Availability)
- 11.2.11 Antibodies Inc.
- 11.2.11.1. Overview
- 11.2.11.2. Products
- 11.2.11.3. SWOT Analysis
- 11.2.11.4. Recent Developments
- 11.2.11.5. Financials (Based on Availability)
- 11.2.12 Emergent
- 11.2.12.1. Overview
- 11.2.12.2. Products
- 11.2.12.3. SWOT Analysis
- 11.2.12.4. Recent Developments
- 11.2.12.5. Financials (Based on Availability)
- 11.2.1 Thermo Fisher Scientific Inc.
- Figure 1: Global Polyclonal Antibodies Market Revenue Breakdown (Billion, %) by Region 2024 & 2032
- Figure 2: North America Polyclonal Antibodies Market Revenue (Billion), by Based on route of administration, the polyclonal antibodies market is classified into intravenous (IV), subcutaneous (SC), and other routes of administration. The intravenous (IV) segment is expected to exhibit CAGR of 5.3% by 2032. 2024 & 2032
- Figure 3: North America Polyclonal Antibodies Market Revenue Share (%), by Based on route of administration, the polyclonal antibodies market is classified into intravenous (IV), subcutaneous (SC), and other routes of administration. The intravenous (IV) segment is expected to exhibit CAGR of 5.3% by 2032. 2024 & 2032
- Figure 4: North America Polyclonal Antibodies Market Revenue (Billion), by Product, 2018 – 2032 (USD Million) 2024 & 2032
- Figure 5: North America Polyclonal Antibodies Market Revenue Share (%), by Product, 2018 – 2032 (USD Million) 2024 & 2032
- Figure 6: North America Polyclonal Antibodies Market Revenue (Billion), by Application, 2018 – 2032 (USD Million) 2024 & 2032
- Figure 7: North America Polyclonal Antibodies Market Revenue Share (%), by Application, 2018 – 2032 (USD Million) 2024 & 2032
- Figure 8: North America Polyclonal Antibodies Market Revenue (Billion), by Route of Administration, 2018 – 2032 (USD Million) 2024 & 2032
- Figure 9: North America Polyclonal Antibodies Market Revenue Share (%), by Route of Administration, 2018 – 2032 (USD Million) 2024 & 2032
- Figure 10: North America Polyclonal Antibodies Market Revenue (Billion), by Source, 2018 – 2032 (USD Million) 2024 & 2032
- Figure 11: North America Polyclonal Antibodies Market Revenue Share (%), by Source, 2018 – 2032 (USD Million) 2024 & 2032
- Figure 12: North America Polyclonal Antibodies Market Revenue (Billion), by End-user, 2018 – 2032 (USD Million) 2024 & 2032
- Figure 13: North America Polyclonal Antibodies Market Revenue Share (%), by End-user, 2018 – 2032 (USD Million) 2024 & 2032
- Figure 14: North America Polyclonal Antibodies Market Revenue (Billion), by Country 2024 & 2032
- Figure 15: North America Polyclonal Antibodies Market Revenue Share (%), by Country 2024 & 2032
- Figure 16: Europe Polyclonal Antibodies Market Revenue (Billion), by Based on route of administration, the polyclonal antibodies market is classified into intravenous (IV), subcutaneous (SC), and other routes of administration. The intravenous (IV) segment is expected to exhibit CAGR of 5.3% by 2032. 2024 & 2032
- Figure 17: Europe Polyclonal Antibodies Market Revenue Share (%), by Based on route of administration, the polyclonal antibodies market is classified into intravenous (IV), subcutaneous (SC), and other routes of administration. The intravenous (IV) segment is expected to exhibit CAGR of 5.3% by 2032. 2024 & 2032
- Figure 18: Europe Polyclonal Antibodies Market Revenue (Billion), by Product, 2018 – 2032 (USD Million) 2024 & 2032
- Figure 19: Europe Polyclonal Antibodies Market Revenue Share (%), by Product, 2018 – 2032 (USD Million) 2024 & 2032
- Figure 20: Europe Polyclonal Antibodies Market Revenue (Billion), by Application, 2018 – 2032 (USD Million) 2024 & 2032
- Figure 21: Europe Polyclonal Antibodies Market Revenue Share (%), by Application, 2018 – 2032 (USD Million) 2024 & 2032
- Figure 22: Europe Polyclonal Antibodies Market Revenue (Billion), by Route of Administration, 2018 – 2032 (USD Million) 2024 & 2032
- Figure 23: Europe Polyclonal Antibodies Market Revenue Share (%), by Route of Administration, 2018 – 2032 (USD Million) 2024 & 2032
- Figure 24: Europe Polyclonal Antibodies Market Revenue (Billion), by Source, 2018 – 2032 (USD Million) 2024 & 2032
- Figure 25: Europe Polyclonal Antibodies Market Revenue Share (%), by Source, 2018 – 2032 (USD Million) 2024 & 2032
- Figure 26: Europe Polyclonal Antibodies Market Revenue (Billion), by End-user, 2018 – 2032 (USD Million) 2024 & 2032
- Figure 27: Europe Polyclonal Antibodies Market Revenue Share (%), by End-user, 2018 – 2032 (USD Million) 2024 & 2032
- Figure 28: Europe Polyclonal Antibodies Market Revenue (Billion), by Country 2024 & 2032
- Figure 29: Europe Polyclonal Antibodies Market Revenue Share (%), by Country 2024 & 2032
- Figure 30: Asia Pacific Polyclonal Antibodies Market Revenue (Billion), by Based on route of administration, the polyclonal antibodies market is classified into intravenous (IV), subcutaneous (SC), and other routes of administration. The intravenous (IV) segment is expected to exhibit CAGR of 5.3% by 2032. 2024 & 2032
- Figure 31: Asia Pacific Polyclonal Antibodies Market Revenue Share (%), by Based on route of administration, the polyclonal antibodies market is classified into intravenous (IV), subcutaneous (SC), and other routes of administration. The intravenous (IV) segment is expected to exhibit CAGR of 5.3% by 2032. 2024 & 2032
- Figure 32: Asia Pacific Polyclonal Antibodies Market Revenue (Billion), by Product, 2018 – 2032 (USD Million) 2024 & 2032
- Figure 33: Asia Pacific Polyclonal Antibodies Market Revenue Share (%), by Product, 2018 – 2032 (USD Million) 2024 & 2032
- Figure 34: Asia Pacific Polyclonal Antibodies Market Revenue (Billion), by Application, 2018 – 2032 (USD Million) 2024 & 2032
- Figure 35: Asia Pacific Polyclonal Antibodies Market Revenue Share (%), by Application, 2018 – 2032 (USD Million) 2024 & 2032
- Figure 36: Asia Pacific Polyclonal Antibodies Market Revenue (Billion), by Route of Administration, 2018 – 2032 (USD Million) 2024 & 2032
- Figure 37: Asia Pacific Polyclonal Antibodies Market Revenue Share (%), by Route of Administration, 2018 – 2032 (USD Million) 2024 & 2032
- Figure 38: Asia Pacific Polyclonal Antibodies Market Revenue (Billion), by Source, 2018 – 2032 (USD Million) 2024 & 2032
- Figure 39: Asia Pacific Polyclonal Antibodies Market Revenue Share (%), by Source, 2018 – 2032 (USD Million) 2024 & 2032
- Figure 40: Asia Pacific Polyclonal Antibodies Market Revenue (Billion), by End-user, 2018 – 2032 (USD Million) 2024 & 2032
- Figure 41: Asia Pacific Polyclonal Antibodies Market Revenue Share (%), by End-user, 2018 – 2032 (USD Million) 2024 & 2032
- Figure 42: Asia Pacific Polyclonal Antibodies Market Revenue (Billion), by Country 2024 & 2032
- Figure 43: Asia Pacific Polyclonal Antibodies Market Revenue Share (%), by Country 2024 & 2032
- Figure 44: Latin America Polyclonal Antibodies Market Revenue (Billion), by Based on route of administration, the polyclonal antibodies market is classified into intravenous (IV), subcutaneous (SC), and other routes of administration. The intravenous (IV) segment is expected to exhibit CAGR of 5.3% by 2032. 2024 & 2032
- Figure 45: Latin America Polyclonal Antibodies Market Revenue Share (%), by Based on route of administration, the polyclonal antibodies market is classified into intravenous (IV), subcutaneous (SC), and other routes of administration. The intravenous (IV) segment is expected to exhibit CAGR of 5.3% by 2032. 2024 & 2032
- Figure 46: Latin America Polyclonal Antibodies Market Revenue (Billion), by Product, 2018 – 2032 (USD Million) 2024 & 2032
- Figure 47: Latin America Polyclonal Antibodies Market Revenue Share (%), by Product, 2018 – 2032 (USD Million) 2024 & 2032
- Figure 48: Latin America Polyclonal Antibodies Market Revenue (Billion), by Application, 2018 – 2032 (USD Million) 2024 & 2032
- Figure 49: Latin America Polyclonal Antibodies Market Revenue Share (%), by Application, 2018 – 2032 (USD Million) 2024 & 2032
- Figure 50: Latin America Polyclonal Antibodies Market Revenue (Billion), by Route of Administration, 2018 – 2032 (USD Million) 2024 & 2032
- Figure 51: Latin America Polyclonal Antibodies Market Revenue Share (%), by Route of Administration, 2018 – 2032 (USD Million) 2024 & 2032
- Figure 52: Latin America Polyclonal Antibodies Market Revenue (Billion), by Source, 2018 – 2032 (USD Million) 2024 & 2032
- Figure 53: Latin America Polyclonal Antibodies Market Revenue Share (%), by Source, 2018 – 2032 (USD Million) 2024 & 2032
- Figure 54: Latin America Polyclonal Antibodies Market Revenue (Billion), by End-user, 2018 – 2032 (USD Million) 2024 & 2032
- Figure 55: Latin America Polyclonal Antibodies Market Revenue Share (%), by End-user, 2018 – 2032 (USD Million) 2024 & 2032
- Figure 56: Latin America Polyclonal Antibodies Market Revenue (Billion), by Country 2024 & 2032
- Figure 57: Latin America Polyclonal Antibodies Market Revenue Share (%), by Country 2024 & 2032
- Figure 58: Middle East & Africa Polyclonal Antibodies Market Revenue (Billion), by Based on route of administration, the polyclonal antibodies market is classified into intravenous (IV), subcutaneous (SC), and other routes of administration. The intravenous (IV) segment is expected to exhibit CAGR of 5.3% by 2032. 2024 & 2032
- Figure 59: Middle East & Africa Polyclonal Antibodies Market Revenue Share (%), by Based on route of administration, the polyclonal antibodies market is classified into intravenous (IV), subcutaneous (SC), and other routes of administration. The intravenous (IV) segment is expected to exhibit CAGR of 5.3% by 2032. 2024 & 2032
- Figure 60: Middle East & Africa Polyclonal Antibodies Market Revenue (Billion), by Product, 2018 – 2032 (USD Million) 2024 & 2032
- Figure 61: Middle East & Africa Polyclonal Antibodies Market Revenue Share (%), by Product, 2018 – 2032 (USD Million) 2024 & 2032
- Figure 62: Middle East & Africa Polyclonal Antibodies Market Revenue (Billion), by Application, 2018 – 2032 (USD Million) 2024 & 2032
- Figure 63: Middle East & Africa Polyclonal Antibodies Market Revenue Share (%), by Application, 2018 – 2032 (USD Million) 2024 & 2032
- Figure 64: Middle East & Africa Polyclonal Antibodies Market Revenue (Billion), by Route of Administration, 2018 – 2032 (USD Million) 2024 & 2032
- Figure 65: Middle East & Africa Polyclonal Antibodies Market Revenue Share (%), by Route of Administration, 2018 – 2032 (USD Million) 2024 & 2032
- Figure 66: Middle East & Africa Polyclonal Antibodies Market Revenue (Billion), by Source, 2018 – 2032 (USD Million) 2024 & 2032
- Figure 67: Middle East & Africa Polyclonal Antibodies Market Revenue Share (%), by Source, 2018 – 2032 (USD Million) 2024 & 2032
- Figure 68: Middle East & Africa Polyclonal Antibodies Market Revenue (Billion), by End-user, 2018 – 2032 (USD Million) 2024 & 2032
- Figure 69: Middle East & Africa Polyclonal Antibodies Market Revenue Share (%), by End-user, 2018 – 2032 (USD Million) 2024 & 2032
- Figure 70: Middle East & Africa Polyclonal Antibodies Market Revenue (Billion), by Country 2024 & 2032
- Figure 71: Middle East & Africa Polyclonal Antibodies Market Revenue Share (%), by Country 2024 & 2032
- Table 1: Global Polyclonal Antibodies Market Revenue Billion Forecast, by Region 2019 & 2032
- Table 2: Global Polyclonal Antibodies Market Revenue Billion Forecast, by Based on route of administration, the polyclonal antibodies market is classified into intravenous (IV), subcutaneous (SC), and other routes of administration. The intravenous (IV) segment is expected to exhibit CAGR of 5.3% by 2032. 2019 & 2032
- Table 3: Global Polyclonal Antibodies Market Revenue Billion Forecast, by Product, 2018 – 2032 (USD Million) 2019 & 2032
- Table 4: Global Polyclonal Antibodies Market Revenue Billion Forecast, by Application, 2018 – 2032 (USD Million) 2019 & 2032
- Table 5: Global Polyclonal Antibodies Market Revenue Billion Forecast, by Route of Administration, 2018 – 2032 (USD Million) 2019 & 2032
- Table 6: Global Polyclonal Antibodies Market Revenue Billion Forecast, by Source, 2018 – 2032 (USD Million) 2019 & 2032
- Table 7: Global Polyclonal Antibodies Market Revenue Billion Forecast, by End-user, 2018 – 2032 (USD Million) 2019 & 2032
- Table 8: Global Polyclonal Antibodies Market Revenue Billion Forecast, by Region 2019 & 2032
- Table 9: Global Polyclonal Antibodies Market Revenue Billion Forecast, by Based on route of administration, the polyclonal antibodies market is classified into intravenous (IV), subcutaneous (SC), and other routes of administration. The intravenous (IV) segment is expected to exhibit CAGR of 5.3% by 2032. 2019 & 2032
- Table 10: Global Polyclonal Antibodies Market Revenue Billion Forecast, by Product, 2018 – 2032 (USD Million) 2019 & 2032
- Table 11: Global Polyclonal Antibodies Market Revenue Billion Forecast, by Application, 2018 – 2032 (USD Million) 2019 & 2032
- Table 12: Global Polyclonal Antibodies Market Revenue Billion Forecast, by Route of Administration, 2018 – 2032 (USD Million) 2019 & 2032
- Table 13: Global Polyclonal Antibodies Market Revenue Billion Forecast, by Source, 2018 – 2032 (USD Million) 2019 & 2032
- Table 14: Global Polyclonal Antibodies Market Revenue Billion Forecast, by End-user, 2018 – 2032 (USD Million) 2019 & 2032
- Table 15: Global Polyclonal Antibodies Market Revenue Billion Forecast, by Country 2019 & 2032
- Table 16: U.S. Polyclonal Antibodies Market Revenue (Billion) Forecast, by Application 2019 & 2032
- Table 17: Canada Polyclonal Antibodies Market Revenue (Billion) Forecast, by Application 2019 & 2032
- Table 18: Global Polyclonal Antibodies Market Revenue Billion Forecast, by Based on route of administration, the polyclonal antibodies market is classified into intravenous (IV), subcutaneous (SC), and other routes of administration. The intravenous (IV) segment is expected to exhibit CAGR of 5.3% by 2032. 2019 & 2032
- Table 19: Global Polyclonal Antibodies Market Revenue Billion Forecast, by Product, 2018 – 2032 (USD Million) 2019 & 2032
- Table 20: Global Polyclonal Antibodies Market Revenue Billion Forecast, by Application, 2018 – 2032 (USD Million) 2019 & 2032
- Table 21: Global Polyclonal Antibodies Market Revenue Billion Forecast, by Route of Administration, 2018 – 2032 (USD Million) 2019 & 2032
- Table 22: Global Polyclonal Antibodies Market Revenue Billion Forecast, by Source, 2018 – 2032 (USD Million) 2019 & 2032
- Table 23: Global Polyclonal Antibodies Market Revenue Billion Forecast, by End-user, 2018 – 2032 (USD Million) 2019 & 2032
- Table 24: Global Polyclonal Antibodies Market Revenue Billion Forecast, by Country 2019 & 2032
- Table 25: Germany Polyclonal Antibodies Market Revenue (Billion) Forecast, by Application 2019 & 2032
- Table 26: UK Polyclonal Antibodies Market Revenue (Billion) Forecast, by Application 2019 & 2032
- Table 27: France Polyclonal Antibodies Market Revenue (Billion) Forecast, by Application 2019 & 2032
- Table 28: Spain Polyclonal Antibodies Market Revenue (Billion) Forecast, by Application 2019 & 2032
- Table 29: Italy Polyclonal Antibodies Market Revenue (Billion) Forecast, by Application 2019 & 2032
- Table 30: Rest of Europe Polyclonal Antibodies Market Revenue (Billion) Forecast, by Application 2019 & 2032
- Table 31: Global Polyclonal Antibodies Market Revenue Billion Forecast, by Based on route of administration, the polyclonal antibodies market is classified into intravenous (IV), subcutaneous (SC), and other routes of administration. The intravenous (IV) segment is expected to exhibit CAGR of 5.3% by 2032. 2019 & 2032
- Table 32: Global Polyclonal Antibodies Market Revenue Billion Forecast, by Product, 2018 – 2032 (USD Million) 2019 & 2032
- Table 33: Global Polyclonal Antibodies Market Revenue Billion Forecast, by Application, 2018 – 2032 (USD Million) 2019 & 2032
- Table 34: Global Polyclonal Antibodies Market Revenue Billion Forecast, by Route of Administration, 2018 – 2032 (USD Million) 2019 & 2032
- Table 35: Global Polyclonal Antibodies Market Revenue Billion Forecast, by Source, 2018 – 2032 (USD Million) 2019 & 2032
- Table 36: Global Polyclonal Antibodies Market Revenue Billion Forecast, by End-user, 2018 – 2032 (USD Million) 2019 & 2032
- Table 37: Global Polyclonal Antibodies Market Revenue Billion Forecast, by Country 2019 & 2032
- Table 38: China Polyclonal Antibodies Market Revenue (Billion) Forecast, by Application 2019 & 2032
- Table 39: Japan Polyclonal Antibodies Market Revenue (Billion) Forecast, by Application 2019 & 2032
- Table 40: India Polyclonal Antibodies Market Revenue (Billion) Forecast, by Application 2019 & 2032
- Table 41: Australia Polyclonal Antibodies Market Revenue (Billion) Forecast, by Application 2019 & 2032
- Table 42: Rest of Asia Pacific Polyclonal Antibodies Market Revenue (Billion) Forecast, by Application 2019 & 2032
- Table 43: Global Polyclonal Antibodies Market Revenue Billion Forecast, by Based on route of administration, the polyclonal antibodies market is classified into intravenous (IV), subcutaneous (SC), and other routes of administration. The intravenous (IV) segment is expected to exhibit CAGR of 5.3% by 2032. 2019 & 2032
- Table 44: Global Polyclonal Antibodies Market Revenue Billion Forecast, by Product, 2018 – 2032 (USD Million) 2019 & 2032
- Table 45: Global Polyclonal Antibodies Market Revenue Billion Forecast, by Application, 2018 – 2032 (USD Million) 2019 & 2032
- Table 46: Global Polyclonal Antibodies Market Revenue Billion Forecast, by Route of Administration, 2018 – 2032 (USD Million) 2019 & 2032
- Table 47: Global Polyclonal Antibodies Market Revenue Billion Forecast, by Source, 2018 – 2032 (USD Million) 2019 & 2032
- Table 48: Global Polyclonal Antibodies Market Revenue Billion Forecast, by End-user, 2018 – 2032 (USD Million) 2019 & 2032
- Table 49: Global Polyclonal Antibodies Market Revenue Billion Forecast, by Country 2019 & 2032
- Table 50: Brazil Polyclonal Antibodies Market Revenue (Billion) Forecast, by Application 2019 & 2032
- Table 51: Mexico Polyclonal Antibodies Market Revenue (Billion) Forecast, by Application 2019 & 2032
- Table 52: Rest of Latin America Polyclonal Antibodies Market Revenue (Billion) Forecast, by Application 2019 & 2032
- Table 53: Global Polyclonal Antibodies Market Revenue Billion Forecast, by Based on route of administration, the polyclonal antibodies market is classified into intravenous (IV), subcutaneous (SC), and other routes of administration. The intravenous (IV) segment is expected to exhibit CAGR of 5.3% by 2032. 2019 & 2032
- Table 54: Global Polyclonal Antibodies Market Revenue Billion Forecast, by Product, 2018 – 2032 (USD Million) 2019 & 2032
- Table 55: Global Polyclonal Antibodies Market Revenue Billion Forecast, by Application, 2018 – 2032 (USD Million) 2019 & 2032
- Table 56: Global Polyclonal Antibodies Market Revenue Billion Forecast, by Route of Administration, 2018 – 2032 (USD Million) 2019 & 2032
- Table 57: Global Polyclonal Antibodies Market Revenue Billion Forecast, by Source, 2018 – 2032 (USD Million) 2019 & 2032
- Table 58: Global Polyclonal Antibodies Market Revenue Billion Forecast, by End-user, 2018 – 2032 (USD Million) 2019 & 2032
- Table 59: Global Polyclonal Antibodies Market Revenue Billion Forecast, by Country 2019 & 2032
- Table 60: South Africa Polyclonal Antibodies Market Revenue (Billion) Forecast, by Application 2019 & 2032
- Table 61: Saudi Arabia Polyclonal Antibodies Market Revenue (Billion) Forecast, by Application 2019 & 2032
- Table 62: Rest of Middle East & Africa Polyclonal Antibodies Market Revenue (Billion) Forecast, by Application 2019 & 2032
STEP 1 - Identification of Relevant Samples Size from Population Database


STEP 2 - Approaches for Defining Global Market Size (Value, Volume* & Price*)

Note* : In applicable scenarios
STEP 3 - Data Sources
Primary Research
- Web Analytics
- Survey Reports
- Research Institute
- Latest Research Reports
- Opinion Leaders
Secondary Research
- Annual Reports
- White Paper
- Latest Press Release
- Industry Association
- Paid Database
- Investor Presentations

STEP 4 - Data Triangulation
Involves using different sources of information in order to increase the validity of a study
These sources are likely to be stakeholders in a program - participants, other researchers, program staff, other community members, and so on.
Then we put all data in single framework & apply various statistical tools to find out the dynamic on the market.
During the analysis stage, feedback from the stakeholder groups would be compared to determine areas of agreement as well as areas of divergence
Frequently Asked Questions
Related Reports
See the similar reports


About Market Insights Report
Market Insights Reports offers comprehensive market research reports and analysis, giving businesses important information about their clients, rivals, and sector to help them make well-informed decisions on operations, marketing, and business strategy. We offer a variety of services in addition to market research, data analysis, and strategy planning. In order to find opportunities and learn more about our competitors and the industry at large, we employ competitive analysis. To identify areas for development, we also evaluate our performance against that of our rivals. We can determine the places at which we can offer our clients the most value by performing value chain analysis.
Additionally, clients receive a thorough overview of their industry business environment. We can find trends that help us forecast future possibilities and threats by examining global macroeconomic dynamics and consumer behavior patterns. By analyzing their features and advantages, contrasting them with comparable items on the market, and evaluating both their quantitative and qualitative performance, we comprehensively evaluate our clients' products. This allows us to assist customers in determining how their goods compare to those of their rivals and in creating successful marketing plans. Our group has been successful in gaining a thorough grasp of our clients' requirements and offering them creative solutions. We currently provide services to more than 50 nations in Europe, the Middle East, Africa, Latin America, Asia Pacific, and North America. Because of our global reach, we have been able to establish trusting bonds with our partners and clients in various nations, improving customer service and forging a more cohesive worldwide presence.